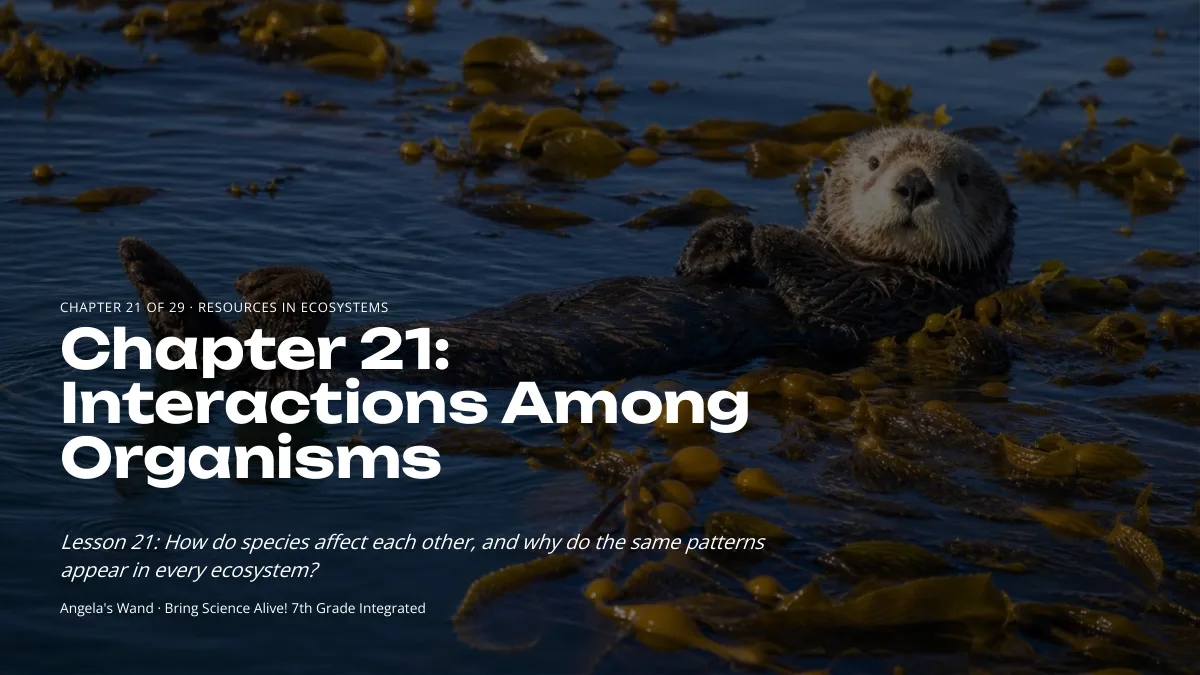
Chapter 21 · Unit 7: Resources in Ecosystems · Segment 3

Interactions Among Organisms

Why do the same kinds of relationships between species appear in ecosystems that share no species at all, and how can knowing those patterns let us predict what happens when one population changes?

Overview

Students figure out that every meeting between two species in an ecosystem can be sorted by what each partner gains or loses: predation and parasitism help one and harm the other, competition harms both, mutualism helps both, and commensalism helps one while leaving the other with no measurable change. They use these plus-minus-zero patterns to read predator-prey graphs, to explain why the same five relationships show up in a kelp forest, a desert, a rainforest and a city park, and to predict what happens to a population when one of its partners changes. The lesson's engineering strand, which asks what criteria and constraints a wildlife-monitoring tool must meet, becomes a design challenge to shield a frog-call sensor from highway noise.

Estimated class time: presentation about 132 minutes · worksheets about 420 minutes in total · labs 4 sessions. Six to seven 50-minute periods: one for the phenomenon and predation vocabulary; two for predator-prey dynamics and the bead simulation; one for mutualism, commensalism and parasitism with the card mystery; two for the sound-shield design challenge; one for synthesis and mastery.

Phenomenon

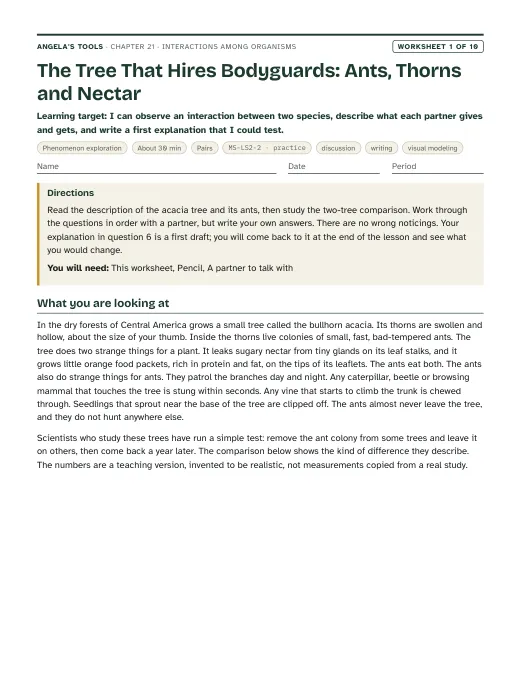
The tree that feeds its own bodyguards

In the dry forests of Central America, a bullhorn acacia grows pairs of fat, hollow thorns and leaks sugary nectar from glands on its leaf stalks. The tree gets no food from that nectar, and the hollow thorns do not help it stand or grow. Yet a colony of small, fierce ants moves into the thorns, drinks the nectar, and patrols the branches day and night. Touch a branch and dozens of ants pour out stinging. The ants also bite off any vine or seedling that leans against the trunk. If a tree spends energy on sugar it cannot use and thorns it cannot use, why is it still standing while its neighbors are stripped by goats and deer?

Notice and wonder prompts

  • What does each partner, the tree and the ant colony, actually get from the other?
  • What would happen to the tree if every ant disappeared for a year? What would happen to the ants?
  • Is this friendship, or is each partner just getting something for itself?
  • Could a relationship like this exist between a plant and an animal in California? Between two animals in the ocean?

Learning targets

  • I can classify an interaction between two species as predation, competition, mutualism, commensalism or parasitism by rating its effect on each partner as plus, minus or zero.
  • I can explain the cause-and-effect link between predator and prey populations and interpret a graph in which predator peaks follow prey peaks.
  • I can predict how a change in one population ripples through its interactions to other populations in the same ecosystem.
  • I can explain why the same patterns of interaction appear in ecosystems with completely different species, and use those patterns to make a prediction about an ecosystem I have never studied.
  • I can define criteria and constraints for a design problem that involves living things, and use them to compare competing solutions fairly.

What shows the learning happened

  • A completed plus-minus-zero grid (Lab 2) that places sixteen interaction cards from four ecosystems into the five interaction types, with each rating justified by the evidence on the card.
  • A written prediction for a missing cell in that grid (for example, what a parasite in a kelp forest would look like) that names both partners, rates each one, and explains why every ecosystem is expected to contain that type.
  • A graph of vole and fox counts over twenty rounds of the bead simulation (Lab 1) with the first vole peak and the first fox peak marked, and a sentence explaining why the fox peak comes later.
  • A Claim-Evidence-Reasoning paragraph (W6) that uses population data to decide which interaction links two species and predicts what happens to one if the other declines.
  • A set of measurable criteria and real constraints for a frog-call sensor shield, a decision matrix comparing two designs, and test data in decibels or detections before and after the shield (Lab 3, W9).
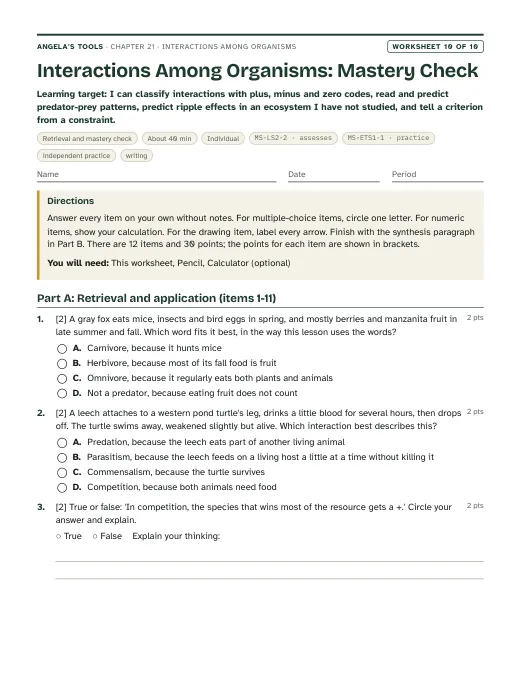
  • Short answers (W10, exit ticket) that correctly distinguish a parasite from a predator, a mutualist from a commensal partner, and a criterion from a constraint.

Key vocabulary 12 terms

predationAn interaction where a predator gets food by eating all or part of another living thing, its prey. In this lesson the word covers plant eaters as well as hunters.Divers counted far fewer purple sea urchins on reefs where sea otters hunt, which is the signature of predation.
predatorThe organism that does the eating in predation. Hunters such as owls count, and so do grazers such as deer, because both take resources from another living thing.A deer browsing an oak seedling is a predator of that seedling, even though the seedling usually survives the meal.
preyThe organism that gets eaten in predation, whether it is an animal, a plant or a microbe.When prey becomes scarce, a predator population usually shrinks a few seasons later.
carnivoreA predator whose food is mostly other animals.A Cooper's hawk in a city park is a carnivore that takes pigeons and starlings.
herbivoreA predator whose food is mostly plants or plant parts, such as leaves, seeds or nectar.Desert tortoises are herbivores that strip wildflowers in spring and reduce how many seeds those plants set.
omnivoreA predator that regularly eats both plants and animals. The mix does not have to be equal: black bears eat mostly plant food and are still omnivores.A raccoon that eats crayfish one night and fallen figs the next is an omnivore.
competitionAn interaction in which two species need the same limited resource, so each one gets less than it would alone. Both are harmed.Starlings and bluebirds compete for the few nest holes in a park: every hole one species takes is a hole the other cannot use.
mutualismAn interaction between two species in which each partner gains something that helps it survive, grow or reproduce. Each partner is acting for itself, not out of kindness.The yucca moth pollinates the yucca while laying its eggs, and the yucca feeds the moth's young with a few of its seeds, a mutualism neither can do without.
commensalismAn interaction that helps one species while the other shows no measurable gain or loss, as far as scientists can tell.Lichens growing on oak bark use the trunk as a surface, and the oak's growth rings look the same with or without them, so ecologists call it commensalism.
parasitismAn interaction in which one species, the parasite, lives on or inside another living species, the host, and takes resources from it. The host is weakened but usually not killed.Winter ticks drinking blood from a moose are parasites; a moose carrying tens of thousands of them loses weight and may die in a hard winter.
hostThe living organism that a parasite lives on or inside and feeds from.A pigeon is the host for feather lice that chew on the barbs of its feathers.
criteria and constraintsCriteria are the requirements a design must meet to count as a success; constraints are the limits, such as cost, size, time or effects on living things, that narrow down which designs are allowed.A criterion for the frog-call sensor shield was cutting highway noise by at least 5 decibels; a constraint was that nothing could block the pond side.

Standards alignment

California NGSS, Grade 7 Preferred Integrated Course Model. Each entry says whether this chapter's work assesses the performance expectation, gives practice toward it, or supports it as background; the resource lists below repeat this for every worksheet and lab.

MS-LS2-2Assesses: the full PE: an explanation that predicts patterns of interaction across ecosystemsCA Grade 7

Construct an explanation that predicts patterns of interactions among organisms across multiple ecosystems.

The lesson's core claim is that predation, competition, mutualism, commensalism and parasitism recur in every ecosystem even though the species change. Lab 2, the slide task, W6 and W9 ask students to classify interactions from evidence, state the pattern, and use it to predict an interaction or a population change in an ecosystem they have not studied, which is evidence toward this PE as written.

MS-LS2-1Supports: the resource-limitation background from Lesson 20CA Grade 7

Analyze and interpret data to provide evidence for the effects of resource availability on organisms and populations of organisms in an ecosystem.

Predator-prey cycles and competition only make sense if students already see food, space and nest sites as limited resources. Lab 1 builds that in with a meadow that can only feed sixty voles, and the chapter refers back to Lesson 20 rather than reteaching it.

MS-ETS1-1Practice toward: defining criteria and constraints precisely for a monitoring problemCA Grade 6-8

Define the criteria and constraints of a design problem with sufficient precision to ensure a successful solution, taking into account relevant scientific principles and potential impacts on people and the natural environment that may limit possible solutions.

The textbook's engineering spread shows conservation scientists stating what a wolf-tracking tool must do and what limits it. In Lab 3 students write their own measurable criteria and constraints for a shield that protects a frog-call sensor from highway noise, including effects on the animals being monitored, before they build anything.

MS-ETS1-2Practice toward: evaluating competing designs with a systematic processCA Grade 6-8

Evaluate competing design solutions using a systematic process to determine how well they meet the criteria and constraints of the problem.

In Lab 3 and W9 students score two or more shield designs against the same criteria in a decision matrix and defend the choice with test data. The role is practice rather than assesses in both places: the criteria and the scoring steps are supplied (fully in W9, partly in Lab 3), and only a few designs are compared.

MS-PS4-2Supports: sound reflected, absorbed or transmitted by materials, used as background for the shield designCA Grade 8

Develop and use a model to describe that waves are reflected, absorbed, or transmitted through various materials.

Lab 3 and W9 use the idea that materials reflect, absorb or transmit sound to plan and explain noise shields. MS-PS4-2 is a Grade 8 performance expectation in the California integrated sequence; here it is used qualitatively as background and is not assessed.

Assessment boundary: Assessment is limited to qualitative applications pertaining to light and mechanical waves.

Science and engineering practices

  • Constructing Explanations and Designing Solutions. Students explain why a population changed by naming the interaction that caused it (W6, slide task), and they design, test and improve a noise shield for a wildlife sensor (Lab 3, W9).
  • Analyzing and Interpreting Data. Students graph vole and fox counts over twenty rounds of a bead simulation (Lab 1) and read simulated predator-prey graphs for lag and cycling (W4, W5, slides 8 to 12).
  • Asking Questions and Defining Problems. Students turn 'the highway drowns out the frogs' into a precise design problem with measurable criteria and real constraints before sketching solutions (Lab 3).
  • Developing and Using Models. The bead simulation is a model of a predator-prey system; students decide which rules of the model match a real ecosystem and which do not (Lab 1, W4).

Disciplinary core ideas

  • LS2.A Interdependent Relationships in Ecosystems. Organisms depend on their interactions with other living things and with nonliving factors; predation can reduce or eliminate populations, mutualists can become unable to live apart, and although the species differ from one ecosystem to another, the patterns of interaction are shared.
  • ETS1.A Defining and Delimiting Engineering Problems. A design is more likely to succeed when its criteria and constraints are stated precisely, including scientific facts (how sound travels, where the frogs are) that limit the possible solutions.
  • ETS1.B Developing Possible Solutions. Competing shield designs are compared against the same criteria with a decision matrix, and the best features of each are combined after testing.

Crosscutting concepts

  • Patterns. The plus-minus-zero rating turns hundreds of different species pairs into five repeating patterns, and those patterns let students predict interactions in ecosystems they have never seen.
  • Cause and Effect. Students trace how a rise in prey causes a later rise in predators, which causes a fall in prey, and they use that chain to predict ripple effects when a manager changes one population.
  • Influence of Science, Engineering, and Technology on Society and the Natural World. Radio collars in Yellowstone and the frog-sensor shield show how tools that gather population data let people manage ecosystems, and how constraints such as not disturbing the animals shape the tool.

Presentation 28 slides

Interactions Among Organisms: five patterns that show up everywhere. Original, editable slides with speaker notes: a phenomenon opener, learning targets, the chapter's concepts with diagrams, vocabulary in context, 3 checks for understanding, 2 discussion prompts, an application task, a misconception check, a synthesis and an exit ticket.
Worksheets 10 of 10

Ten different tasks, one per instructional blueprint. Each has a student PDF (low ink, US Letter), an editable DOCX, an HTML preview, and a separate teacher answer key with reasoning.

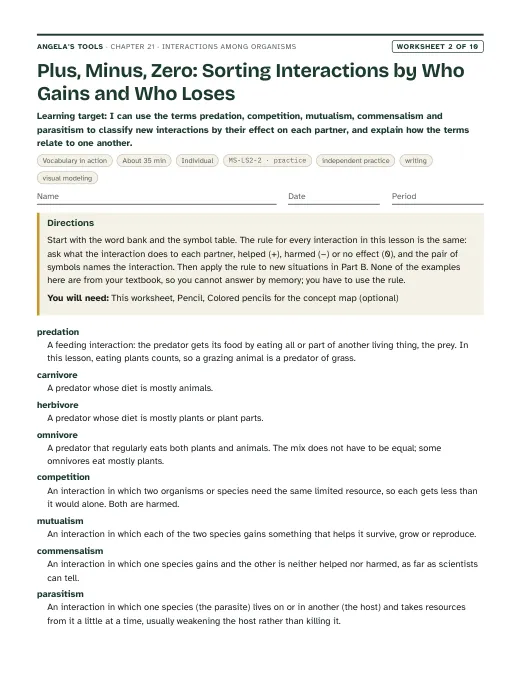
First page of Plus, Minus, Zero: Sorting Interactions by Who Gains and Who Loses
Worksheet 2 · Vocabulary in action

Plus, Minus, Zero: Sorting Interactions by Who Gains and Who Loses

I can use the terms predation, competition, mutualism, commensalism and parasitism to classify new interactions by their effect on each partner, and explain how the terms relate to one another.
35 minindividualBuilds understandingIndependent practiceWritingVisual modeling MS-LS2-2 · practice
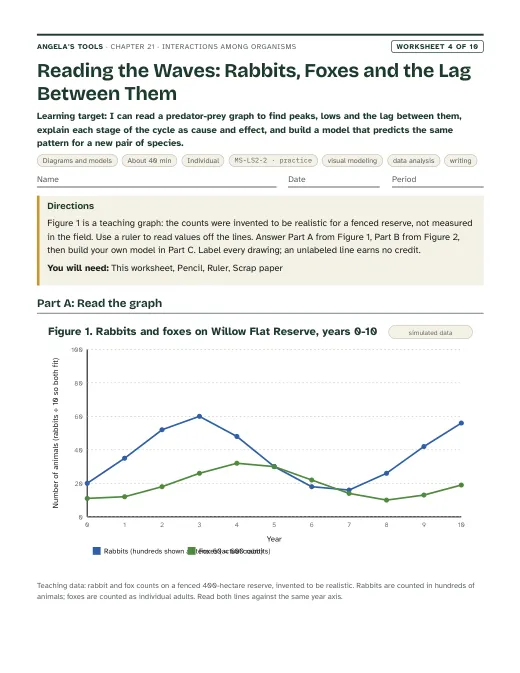
First page of Reading the Waves: Rabbits, Foxes and the Lag Between Them
Worksheet 4 · Diagrams and models

Reading the Waves: Rabbits, Foxes and the Lag Between Them

I can read a predator-prey graph to find peaks, lows and the lag between them, explain each stage of the cycle as cause and effect, and build a model that predicts the same pattern for a new pair of species.
40 minindividualBuilds understandingVisual modelingData analysisWriting MS-LS2-2 · practice
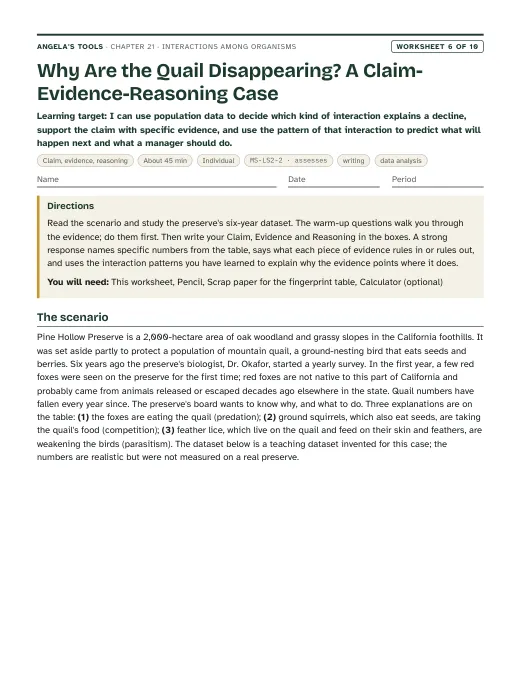
First page of Why Are the Quail Disappearing? A Claim-Evidence-Reasoning Case
Worksheet 6 · Claim, evidence, reasoning

Why Are the Quail Disappearing? A Claim-Evidence-Reasoning Case

I can use population data to decide which kind of interaction explains a decline, support the claim with specific evidence, and use the pattern of that interaction to predict what will happen next and what a manager should do.
45 minindividualAssessmentWritingData analysis MS-LS2-2 · assesses
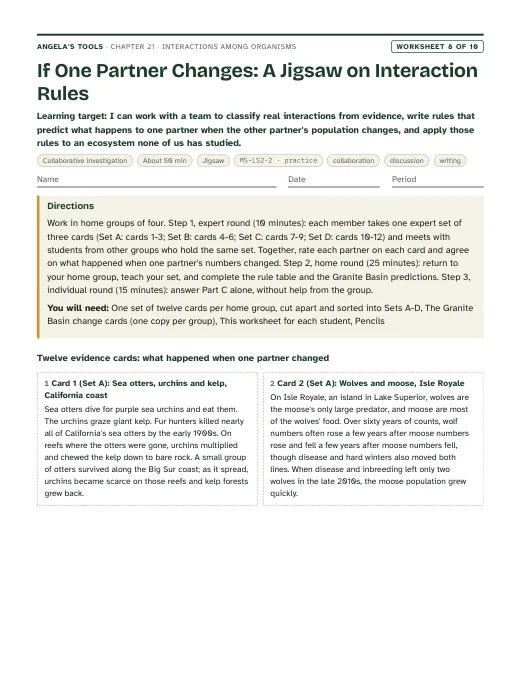
First page of If One Partner Changes: A Jigsaw on Interaction Rules
Worksheet 8 · Collaborative investigation

If One Partner Changes: A Jigsaw on Interaction Rules

I can work with a team to classify real interactions from evidence, write rules that predict what happens to one partner when the other partner's population changes, and apply those rules to an ecosystem none of us has studied.
50 minjigsawPracticeCollaborationDiscussionWriting MS-LS2-2 · practice
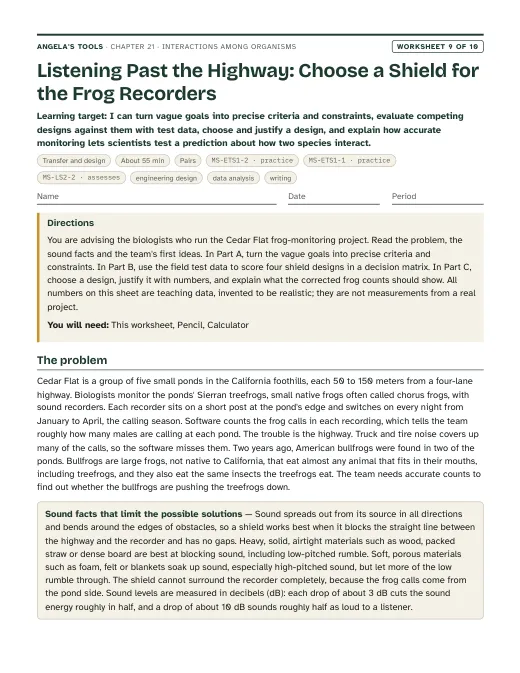
First page of Listening Past the Highway: Choose a Shield for the Frog Recorders
Worksheet 9 · Transfer and design

Listening Past the Highway: Choose a Shield for the Frog Recorders

I can turn vague goals into precise criteria and constraints, evaluate competing designs against them with test data, choose and justify a design, and explain how accurate monitoring lets scientists test a prediction about how two species interact.
55 minpairsExtensionEngineering designData analysisWriting MS-ETS1-2 · practiceMS-ETS1-1 · practiceMS-LS2-2 · assesses

Collaborative labs 3 of 3

Three different investigation approaches. Each has a teacher guide (purpose, materials with quantities, estimated cost, prep, safety, procedure, expected observations, debrief, answer key, assessment criteria, accessibility adaptations, low-cost alternative) and a student recording sheet.
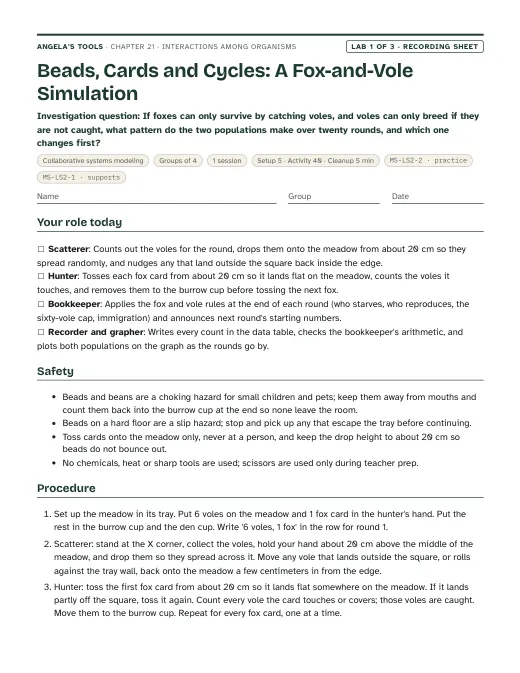
First page of the Beads, Cards and Cycles: A Fox-and-Vole Simulation recording sheet
Lab 1 · Collaborative systems modeling

Beads, Cards and Cycles: A Fox-and-Vole Simulation

If foxes can only survive by catching voles, and voles can only breed if they are not caught, what pattern do the two populations make over twenty rounds, and which one changes first?
Groups of 41 session40 min activityEst. 6 to 10 per classDried lima beans or pony beads (the voles)Cardstock squares 10 cm by 10 cm (the foxes)Meadow: a 30 cm by 30 cm square drawn on paper, taped inside a shallow tray or box lid MS-LS2-2 · practiceMS-LS2-1 · supports
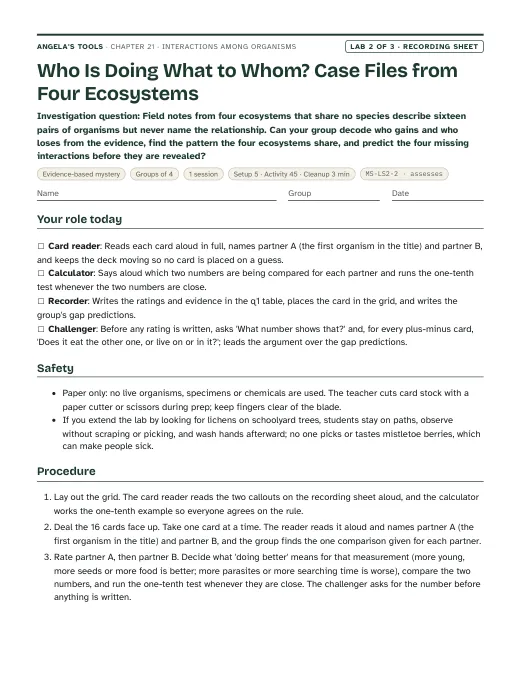
First page of the Who Is Doing What to Whom? Case Files from Four Ecosystems recording sheet
Lab 2 · Evidence-based mystery

Who Is Doing What to Whom? Case Files from Four Ecosystems

Field notes from four ecosystems that share no species describe sixteen pairs of organisms but never name the relationship. Can your group decode who gains and who loses from the evidence, find the pattern the four ecosystems share, and predict the four missing interactions before they are revealed?
Groups of 41 session45 min activityEst. 3 to 6 per classInteraction case-file cards (16), printed on card stock and cut apartSealed reveal envelope with cards K5, D5, C5 and R5Large sheet of paper (or a desk marked with masking tape) ruled as a 4 by 5 grid MS-LS2-2 · assesses
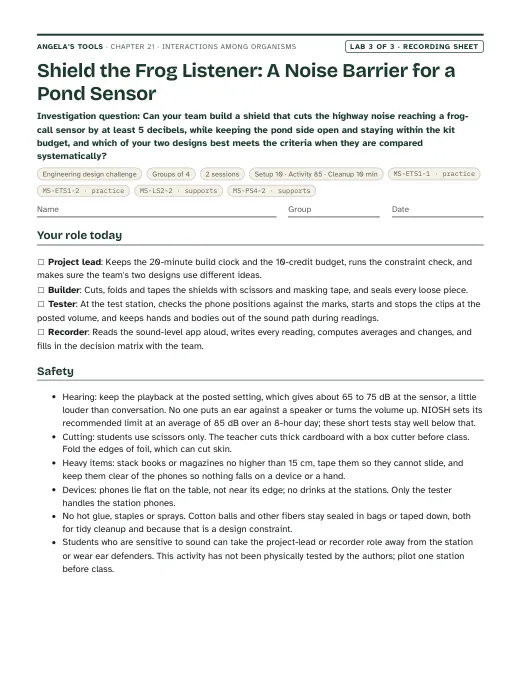
First page of the Shield the Frog Listener: A Noise Barrier for a Pond Sensor recording sheet
Lab 3 · Engineering design challenge

Shield the Frog Listener: A Noise Barrier for a Pond Sensor

Can your team build a shield that cuts the highway noise reaching a frog-call sensor by at least 5 decibels, while keeping the pond side open and staying within the kit budget, and which of your two designs best meets the criteria when they are compared systematically?

Groups of 42 sessions85 min activityEst. 10 to 20 per class, not counting phones or tabletsPhones or tablets for the test stations: one plays the highway and frog clips, one runs a free sound-level meter app as the sensorTest-station mat: poster board marked with H, S and P in a straight line 30 cm apart, a 30 cm by 30 cm square centered on S, and the pond line through S at right angles to the H-S-P lineCardboard sheets, about 30 cm by 30 cm, cut from boxes MS-ETS1-1 · practiceMS-ETS1-2 · practiceMS-LS2-2 · supportsMS-PS4-2 · supports

Teacher guidance

Suggested sequence (7 steps)
  1. Period 1: Presentation slides 1-7 (acacia phenomenon, targets, the five interactions preview, predation and the three predator types). W1 phenomenon worksheet as the opener; W2 vocabulary relationships as the closer.
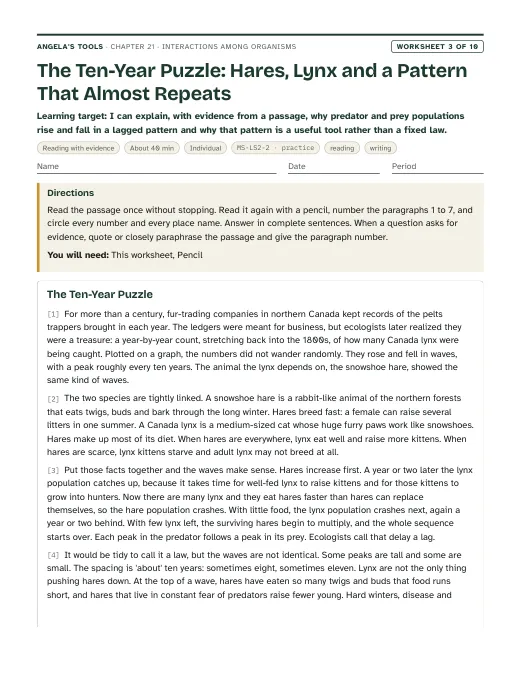
  2. Period 2: Slides 8-13 (simulated fox-vole graph, the four-step cycle, Isle Royale discussion, 'which comes first' check, the California kelp-forest connection). W4 diagram worksheet (reading a fox-rabbit graph for peaks and lag, completing the loop, predicting a lemming-owl graph) after slide 10; W3 reading passage in class or for homework.
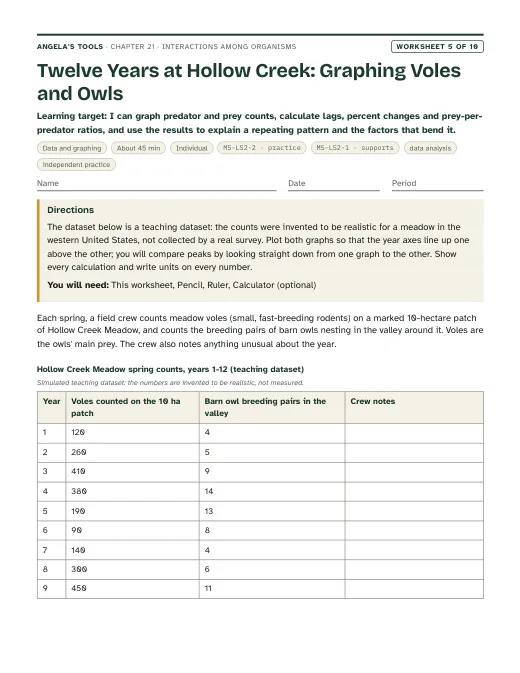
  3. Period 3: Lab 1, Beads, Cards and Cycles (one session). Students run twenty rounds, graph both populations and mark the peaks (the vole peak is the last round at the 60-vole cap). W5 data worksheet follows as independent practice with a cleaner simulated dataset.
  4. Period 4: Slides 14-20 (mutualism, commensalism, parasitism, the plus-minus-zero grid, the mistletoe check, the 'is zero really zero' discussion). Then Lab 2, Who Is Doing What to Whom? (one session): groups decode sixteen case-file cards from a kelp forest, the Mojave Desert, a city park and a rainforest, find one empty cell per ecosystem, predict it, and open sealed reveal cards; q8 to q12 can go home. W8 jigsaw then carries the classification one step further, from each code to what happens when one partner's numbers change.
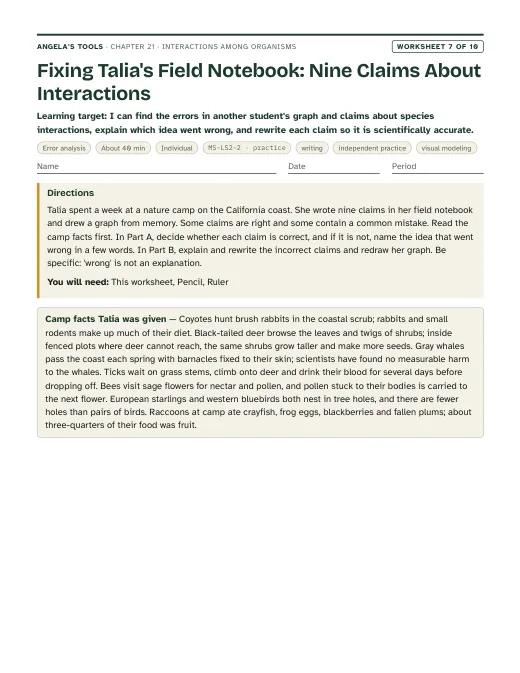
  5. Period 5: Slides 21-23 (patterns across ecosystems, the ripple-effect task, the 'remove the predators' misconception). W6 CER as the written assessment of MS-LS2-2 and W7 misconception repair.
  6. Period 6: Slides 24-25 (monitoring and the Yellowstone criteria-and-constraints story, the sound-shield design brief). Lab 3, Shield the Frog Listener, session 1: turn seven plain-language needs into measurable criteria and constraints, compare them with the class test rules, sketch and price two designs that use different ideas, and build both.
  7. Period 7: Lab 3 session 2: test both designs from the highway and pond positions at two or three shared stations, run the constraint check, choose with a weighted decision matrix, improve once if time allows, and post results on the class chart. Slides 26-28 (manager's toolkit, synthesis, exit). W9 transfer task can replace or extend the lab for students who were absent; W10 mastery as the quiz.

Materials overview: No chemicals, no flames, no live animals. Lab 1 uses dried lima beans or pony beads, 10 cm cardstock squares, a 30 cm square 'meadow' and graph paper. Lab 2 uses a printed and cut card set. Lab 3 uses two phones or tablets per test station, with two or three stations per class (one device plays a traffic-noise clip and a frog-pitch tone, the other runs a free sound-level app as the 'sensor'; a listener test replaces the app if none is available), plus per-group kits of cardboard, a shoebox, a towel, felt, an egg carton, foil, bubble wrap, bagged cotton balls, two old paperbacks, masking tape and scissors. Playback stays at a posted setting that reads about 65 to 75 dB at the sensor, a little louder than conversation.

Common misconceptions (6)
“Predators are bad for an ecosystem, so removing them helps the prey species thrive.”
Why it happens: Stories cast wolves, sharks and hawks as villains, and students see each kill as a loss for the ecosystem rather than as part of a pattern.
Correction: Prey that lose their predators usually grow until they strip their own food supply, as elk did in Yellowstone and sea urchins do in kelp forests without otters. A predator population keeps prey numbers inside the range the ecosystem can feed.
“Predator and prey populations rise and fall at exactly the same time, or the predator always drives the prey to extinction.”
Why it happens: Smooth textbook curves hide the delay, and students assume a hunter that is winning keeps winning.
Correction: Predators respond to prey after a delay, because it takes time to raise young or to starve. So predator peaks follow prey peaks, and when prey become scarce the predators decline, which lets the prey recover. Real data are bumpier than the model because weather, disease, parasites and food for the prey also change.
“Anything that lives on another organism is a parasite.”
Why it happens: Fleas, ticks and lice are the familiar examples, so 'lives on a host' and 'parasite' fuse into one idea.
Correction: The test is the effect, not the address. Barnacles ride on a whale without harming it (commensalism), cleaner fish live on a turtle's shell and help it (mutualism), and a tick drinks blood and weakens its host (parasitism).
“Mutualism means the two species are cooperating on purpose or being kind to each other.”
Why it happens: Everyday words such as partnership and helping suggest intent, and animal videos add a storyline.
Correction: Each partner is simply getting a resource for itself. The acacia does not decide to feed ants; trees that leaked more nectar lost fewer leaves to browsers, so over many generations that trait became common. A mutualism is a pattern of mutual benefit, not a friendship.
“Eating plants is not predation, so a deer or a cow has no effect on the plant population.”
Why it happens: In everyday language a predator hunts and kills animals, and a grazed grass plant usually survives.
Correction: In this lesson any organism that gets food by eating part or all of another living thing is a predator, so herbivores count. Grazers reduce plant growth and seed production even when they do not kill the plant, which is why fencing out deer or tortoises changes a plant community.
“A zero in commensalism means the partner is completely untouched.”
Why it happens: The symbol 0 looks absolute, and the examples are told as if nothing at all happens to the host.
Correction: Zero means scientists cannot measure a gain or a loss. A heavy load of barnacles may cost a whale a little swimming energy; if that cost were ever measured, the label would move toward parasitism. Classification follows the evidence.
Differentiation suggestions (5)
  • Multilingual learners: Pre-teach the five interaction names with a picture card for each and the plus-minus-zero symbols written on the card; let students label the Lab 2 grid in their home language first; pair during the card mystery so field notes are read aloud; provide the sentence frame 'Species A gets ___, so A is +; species B loses ___, so B is −.'
  • Students who need more support: Give the Lab 1 data table with rounds 1-3 filled in from a practice run, a cut-down card set of eight for Lab 2 (two per ecosystem), and a criteria word bank for Lab 3. Let them rate one partner at a time rather than both at once.
  • Students ready for extension: Ask them to change one rule in the bead simulation (foxes need only two voles) and predict the new graph before running it, to research why some acacia ants cheat their trees, or to find out how the Isle Royale wolf relocation of 2018-2019 changed the moose population.
  • Students who need movement or alternative output: Run the predator-prey cycle as a whole-class game on the floor with students as voles and foxes before the bead version; allow the Lab 2 grid to be built on the wall with taped cards; accept a recorded sixty-second explanation of the ripple-effect task instead of a written one.
  • Students with low vision or limited fine-motor control: Use large wooden beads or dried lima beans and a tray with raised edges in Lab 1; print Lab 2 cards in large type with the two partners in bold; in Lab 3 let the student direct the build and read the decibel app aloud while a partner handles scissors and tape.
Accuracy notes: where the textbook simplifies (13)
  • Omnivores (pp. 273, 275): the book says an omnivore eats plants and animals 'in similar amounts'. Omnivores regularly eat both, but the mix varies widely; black bears and most squirrels eat mostly plant food and are still omnivores. Teach 'regularly eats both' and never assess an equal split.
  • Herbivores as predators (pp. 274-275, 282): the lesson treats plant eating as predation so that every one-sided feeding relationship rates plus-minus. Many biology texts list herbivory as its own interaction beside predation. Keep the lesson's broad meaning, say 'in this lesson' when a grazer is called a predator, and say 'hunting predator' when the point is that the prey is killed.
  • Venus flytraps (p. 274): the book calls them carnivorous plants, which is the usual phrase, but a flytrap's energy comes from photosynthesis; the insects mainly supply nutrients such as nitrogen that its bog soil lacks. Do not describe a flytrap as 'mainly eating animals'.
  • Isle Royale (pp. 276-277): the book says the island lets scientists watch wolves and moose 'without the influence of other factors'. The moose there are also strongly affected by winter food supply, winter ticks and weather, and the wolves by disease (canine parvovirus) and inbreeding. The wolf count fell to two by 2016-2018, and nineteen wolves were relocated to the island in 2018-2019. Present the island as a clear example of the predator-prey link, not as a sealed experiment, and treat the book's counts as figures from the time it was written.
  • The predator-prey graph (p. 277): Figure 2 draws perfectly smooth, regular waves, and the text says the two populations 'grow and decline together'. Real data are irregular, the predator changes lag behind the prey by months to years, and predation is not the only driver. Teach the cycle as a common pattern, not a law, and always say that predator peaks follow prey peaks.
  • Yellowstone (pp. 278-279): wolves were reintroduced in 1995, not 'the late 1990s', and the park service describes wolves as one of several factors in elk numbers, alongside cougars, bears, weather and human hunting outside the park. The plant and bird recovery is real in some areas (willow, aspen) but uneven. Say 'wolves, along with other factors'.
  • Radio tracking (p. 279): the book presents collars tracked with handheld antennas as the chosen solution and GPS and aircraft as alternatives. The real Yellowstone wolf project uses VHF collars tracked from the ground and the air, GPS collars that report by satellite, and helicopter captures. Use the book's story as a simplified case of criteria and constraints, not as a statement of what was rejected.
  • Ticks (p. 281 caption): the book calls a tick an insect parasite. Ticks are arachnids, relatives of spiders and mites, with eight legs as nymphs and adults. Fleas and lice are insects.
  • Lichens (p. 280): the photosynthetic partner is a green alga or a cyanobacterium (or both), not always an alga, and many of those algae can live on their own. Say 'an alga or cyanobacterium and a fungus' and reserve 'cannot live apart' for the fungus in most lichens.
  • Commensalism (pp. 281-282): a zero effect is hard to demonstrate. Say 'no measurable effect, as far as scientists can tell', and note that heavy barnacle loads could cost a whale some swimming energy. The label follows the evidence and can change when better measurements arrive.
  • Mutualists' populations rising and falling together (p. 280): this holds for partners that depend on each other, such as yucca and yucca moth or fig and fig wasp. Many mutualisms are looser; a plant visited by several pollinators does not decline when one of them does. Say 'partners that depend on each other'.
  • The acacia phenomenon (p. 272 and the chapter's own version): the nectar does not feed the tree, but it is not 'wasted'; trees that fed ants lost fewer leaves and branches to browsers. Not every ant species on an acacia protects it; some take the nectar and do little, and a long-running Kenyan experiment found that when large browsers were fenced out, trees cut back on rewards and the protective ants were replaced by less helpful ones. Mutualisms hold only while both sides keep paying.
  • The plus, minus and zero symbols (pp. 282-283): they describe the effect of the interaction on each population's ability to survive and reproduce, not on an individual's feelings or on a single meal. Competition is rated minus-minus because each species gets fewer resources than it would alone, even if one of them 'wins'.

Review status: reviewed · 2026-10-19 · W4 is the predator-prey graph worksheet, not a classification grid: period 2 of the sequence now places W4 after slide 10, period 4 keeps W8 only, slides 3, 15 and 17 now point to W2 and W8 for the plus-minus-zero grid, and the sourceReferences slide numbers and worksheet lists were corrected (the grid is slide 17, mutualism slide 14, commensalism and parasitism slides 15, 16, 19 and 20). MS-ETS1-2 roles aligned: W9 changed from assesses to practice to match chapter.json and Lab 3, because the criteria, pass marks and cell-by-cell steps are supplied and only one design survives; the chapter note now says so. MS-PS4-2 (Grade 8) added to the chapter standards as supports, matching Lab 3. Lab 1 bead model re-run independently (4,000 spatial runs of the stated rules: 30 cm meadow, 10 cm cards that must land fully on it, beads 0.9 to 2.4 cm). The arithmetic keys (q3: 26 voles, 3 foxes; q9: 52 voles, 8 foxes) are correct, but the expected observations were optimistic: falls begin at about 7 to 9 foxes between rounds 8 and 14, lows of about 10 to 35, and about one group in five with small beads has no full cycle by round 20. Expected observations, the q1 key, debrief, low-cost note, model limitations and teacher notes were adjusted; lima beans are now listed first, and the scatter step drops beads over the middle (it said the X corner, contradicting likely difficulties). Decibel arithmetic checked: 3 dB per halving of sound energy (10 log10 2 = 3.01), 12 dB = 1/16 (about 6 percent), 6 dB = 1/4, 9 dB = 1/8, Design C passes 4 times Design A's energy; W9 matrix (A keep; B fails K2 at 75 kg; C fails all criteria; D fails K3) and Lab 3 q4 (71.0, 64.7, 6.3 dB) recomputed. Lab 3 q7 key now states the 3 dB net gain in signal over noise. Lab 2's sixteen cards and four reveal cards re-rated independently with the one-tenth rule; every rating, the one-gap-per-row grid (kelp parasitism, desert commensalism, park mutualism, rainforest competition) and the q5 tests (starlings 14 > 8.6, trees 0.5 < 1.25) match the key. Facts verified: bullhorn acacia nectaries, Beltian bodies and vine clearing, and the Kenyan fencing result (Palmer et al. 2008); yucca moths as sole pollinators whose larvae eat only yucca seeds, and unpollinated garden yuccas; Smyrna figs and the 1899 fig wasp; winter ticks as one-host ticks that kill many calves in bad years (slide 15 example changed from 'rarely kill outright'); oak and desert mistletoe as partial parasites; barred owl removal nearly halting spotted owl declines (reported 2021); Kluane food x3, predator exclusion x2, both x11. Softened two claims stated as findings: the gray whale barnacle card (W8 card 8 and its keys) now says no harm or benefit has been measured rather than citing a health comparison, and the starling-bluebird vocabulary sentence no longer claims both species raise fewer chicks. All numeric, multiple-choice, true/false, fill and table items in the ten worksheets and three labs were re-solved; no other key errors found. Six-word overlap with the lesson text: one quoted phrase inside an accuracy note, which is a citation of the book's claim. Text limits, diagram fields, caGrade values and pacing (132 minutes) check out.

Source references

Verified against the student edition of Bring Science Alive! 7th Grade Integrated (Student Edition). Printed page numbers appear in the book; PDF pages are the physical pages of the 524-page scan (printed + 36). The textbook is not reproduced on this site.

SectionPrinted pagesPDF pagesUsed for
Introduction: clown fish and anemone, the lesson question272, 273308, 309Lesson question, the vocabulary list and the publisher's standards box; the acacia phenomenon is the chapter's own version of the textbook's opening image.
1. Predators: carnivores, herbivores, omnivores, predators in ecosystems274, 275310, 311The broad meaning of predator, the three predator types, the claim that predator types occur in nearly every ecosystem; slides 5-7, W2, W10.
2. Interacting Populations Affect One Another: predators and prey, Isle Royale, Figure 2276, 277312, 313Predator-prey cause and effect, the lag and cycle pattern, the Isle Royale case; slides 8-12, Lab 1, W3, W4, W5, W7.
3. Using Predators to Manage Ecosystems: Yellowstone wolves, criteria, constraints, radio tracking278, 279314, 315The engineering story of monitoring a predator population; slides 24-25, Lab 3's criteria and constraints, W9.
4. Mutually Beneficial Interactions: sea turtles and cleaner fish, lichens280316Mutualism and linked population sizes; slides 14, 16 and 17, Lab 2 cards, accuracy note on lichens.
5. Other Kinds of Interactions: commensalism, parasitism281317Commensalism and parasitism definitions, parasite and host; slides 15, 16, 19 and 20 and the Lab 2 cards.
Key Science Concept: Interactions in Ecosystems (the plus-minus-zero spread)282318The rating system for interactions; the grid diagram on slide 17, Lab 2's classification table, W2 and W8.
6. Scientists Predict Interactions and the Lesson Summary283319Using patterns of interaction to manage a population; the ripple-effect task, W6, W9 and the synthesis slide.

External references used for accuracy checks

Related chapters