Chapter 06 · Unit 2: Energy and Matter in Ecosystems · Segment 1

Food Webs and Trophic Pyramids

How do matter and energy move through an ecosystem, and why does matter come back around while energy does not?

MS-LS2-3 · assessesMS-LS2-4 · practiceMS-ETS1-4 · practiceMS-LS2-1 · supports Textbook pp. 64–75 1 presentation · 10 worksheets · 3 labs

Overview

Students figure out how matter and energy travel from producers through consumers and decomposers, and why the two behave differently: atoms are passed around and reused without end, while energy arrives as sunlight, is handed up a food chain in ever smaller shares, and leaves living things as heat. They read and build food webs, predict the direct and indirect ripples that follow when one population changes, account for every kilogram an animal eats, and use a trophic pyramid to calculate how little of a producer's energy reaches a top predator. The chapter closes with an engineering case: how scientists used a food-web model to plan, test and modify a fix for a lake choked with algae. It prepares students for the global cycles of carbon and nitrogen in Lesson 7.

Estimated class time: presentation about 135 minutes · worksheets about 420 minutes in total · labs 5 sessions. Seven to eight 50-minute periods: one for the phenomenon and reading food webs; two for the food-web model lab and its disturbance test; one for decomposers and matter accounting; one for the energy-pyramid water model; one for pyramids, exceptions and the California kelp connection; two for the lake-restoration data lab, synthesis and mastery.

Phenomenon

Three and a half tonnes of hay, one steer

A student in a 4-H club keeps careful records on the steer she is raising. Over one year she weighs every bale: the animal eats roughly 3,600 kilograms of dry feed. On show day the steer has gained about 360 kilograms, a tenth of what it ate. The feed did not pile up in the barn and the steer did not get ten times heavier. Where did the other 3,200 kilograms go? (Typical rounded figures for a growing steer; your animal would differ.)

Notice and wonder prompts

  • What leaves a steer's body every day that you could, in principle, collect and weigh?
  • Is the missing mass really gone, or is it somewhere else now? Where?
  • If a cougar ate this steer, how much of the steer's mass would become cougar?
  • Would the same tenth-of-the-feed pattern show up for a grasshopper eating grass, or a hawk eating mice?

Learning targets

  • I can read a food web, explain what each arrow means, and identify producers, consumers, decomposers and food chains within it.
  • I can predict the direct and indirect effects on other populations when one population in a food web increases or decreases.
  • I can account for the matter an organism eats: new body tissue, carbon dioxide and water breathed out, and wastes and remains that go to decomposers.
  • I can use a trophic pyramid and the ten-percent rule of thumb to calculate the energy available at each level and explain why so little reaches the top.
  • I can build a model that shows matter cycling between the living and nonliving parts of an ecosystem while energy flows through and leaves as heat.
  • I can explain how scientists used a food-web model to design, test and modify a plan for restoring a damaged ecosystem.

What shows the learning happened

  • A food-web model (Lab 1 or W4) with correctly directed arrows, decomposers connected to every organism, nonliving pools for air and soil, sunlight as the energy input, and heat as the energy output, plus a written statement of what is inside the model's boundary.
  • A disturbance prediction table (Lab 1) naming at least two direct effects and two indirect effects of removing one population, each with the chain of reasoning written out.
  • A completed energy-accounting table and bar graph (Lab 2) showing 1,000 units shrinking to 100, 10 and 1 across four levels, with the heat and decomposer shares summing back to the starting amount.
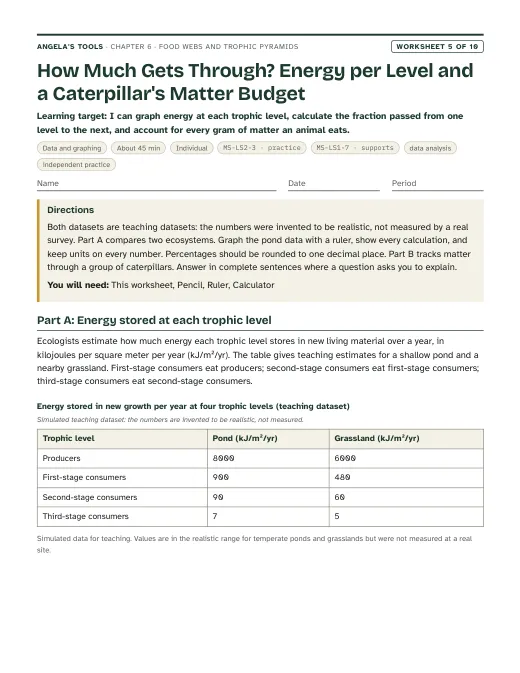
  • A numeric calculation (W5 or W10) of energy at a given trophic level using the ten-percent rule of thumb, with a sentence explaining that the ten percent is an average, not a law.
  • A written explanation (W1 q6 and the slide 13 revisit) accounting for a steer's missing 3,200 kilograms as breath and wastes, with heat named as where the energy went, without saying matter was destroyed or turned into energy.
  • A restoration decision (Lab 3 or W9) that compares at least two plans against stated criteria and a budget, cites the model output, and names one limit of the model.

Key vocabulary 12 terms

food webA model of the feeding connections among the populations in an ecosystem. Each arrow runs from a food source to the organism that eats it.The food web for the oak woodland has five arrows leaving the needlegrass node, because so many animals feed on it.
food chainOne single path through a food web, starting at a producer and following the arrows to an organism that nothing in the model eats.Grass to grasshopper to fence lizard to gopher snake to red-tailed hawk is one food chain inside the larger web.
producerAn organism that builds its own food from carbon dioxide and water using energy from sunlight. Plants, algae and phytoplankton are producers.Every food chain begins with a producer, because that is where energy from outside the ecosystem first enters living things.
consumerAn organism that gets its matter and energy by eating other organisms, their wastes or their remains.A mule deer is a consumer that eats producers; a coyote is a consumer that eats other consumers and sometimes fruit.
decomposerA consumer, such as a soil bacterium or a fungus, that feeds on wastes and dead remains and releases simple substances that producers can take up again.Decomposers in the leaf litter turned last autumn's oak leaves into carbon dioxide and nutrients by the following summer.
trophic levelA feeding step in a food chain. Producers are the first level, the organisms that eat producers are the second, and so on upward.A hawk that eats a snake that ate a lizard that ate a grasshopper is feeding at the fifth trophic level.
trophic pyramidA stacked model of a food chain's levels, producers at the bottom, in which the width of each layer shows how much energy (or biomass) that level receives.The trophic pyramid made it obvious why the preserve could support thousands of grasshoppers but only a few hawks.
biomassThe total mass of living matter in a group of organisms, such as all the producers in a meadow. Scientists usually measure it dry, with the water removed.The biomass of the grass in the field was far larger than the biomass of all the animals that fed on it.
ten-percent rule of thumbThe approximation that only about one tenth of the energy at one trophic level becomes stored energy at the next. Real values range widely around this average.Using the ten-percent rule of thumb, 5,000 units of energy in phytoplankton supports about 50 units in small fish two levels up.
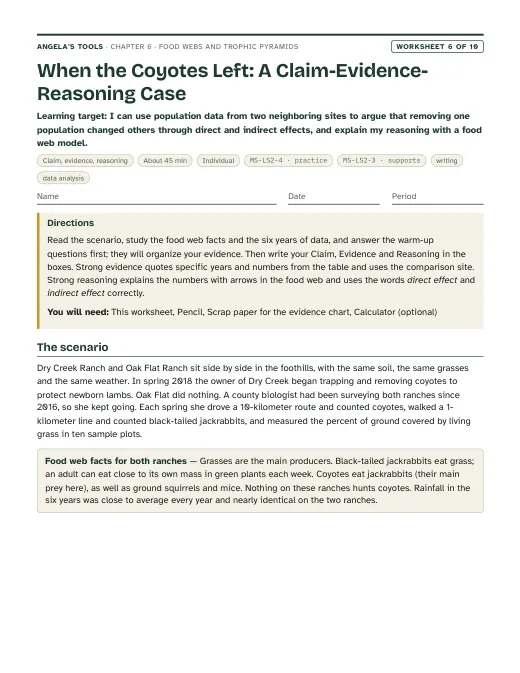
direct effectA change in one population caused by another population that eats it or is eaten by it, with no other population in between.When the coyote population grew, the jackrabbit population fell, a direct effect of more predators.
indirect effectA change in one population caused by another population acting through a third population that sits between them.Fewer jackrabbits meant more grass survived the summer, an indirect effect of the extra coyotes.
top predatorAn animal at the end of a food chain that no other animal in that model eats. Whether an animal counts as a top predator depends on which organisms the model includes.The mountain lion is the top predator in this woodland model, though a larger model of the region might add other species.


Standards alignment

California NGSS, Grade 7 Preferred Integrated Course Model. Each entry says whether this chapter's work assesses the performance expectation, gives practice toward it, or supports it as background; the resource lists below repeat this for every worksheet and lab.

MS-LS2-3Assesses: a model of matter cycling and energy flow that includes nonliving pools and a defined system boundaryCA Grade 7

Develop a model to describe the cycling of matter and flow of energy among living and nonliving parts of an ecosystem.

Lab 1 and W4 require students to build a food-web model that adds air, soil and sunlight as nonliving parts, shows matter returning through decomposers, and shows energy entering as light and leaving as heat. Lab 2 makes students account for every unit of energy at each transfer. Both produce direct evidence toward this PE without using chemical equations, which the assessment boundary excludes.

Assessment boundary: Assessment does not include the use of chemical reactions to describe the processes.

MS-LS2-4Practice toward: the argument-from-evidence practice about population change, using model predictions and simulated monitoring dataCA Grade 7

Construct an argument supported by empirical evidence that changes to physical or biological components of an ecosystem affect populations.

Students predict direct and indirect effects of removing or adding a population (Lab 1, W6, W9) and judge whether a lake intervention worked from monitoring data (Lab 3, slide 21). The evidence is model-based or simulated rather than empirical field data, so the role is practice toward constructing an evidence-based argument.

MS-ETS1-4Practice toward: using a model to generate data for iterative testing and modification of a proposed processCA Grade 6-8

Develop a model to generate data for iterative testing and modification of a proposed object, tool, or process such that an optimal design can be achieved.

The lesson's engineering spread describes scientists testing one lake intervention, measuring, and modifying it. In Lab 3 students run a simple rule-based lake model to generate year-by-year data for a proposed restoration plan, compare the output to criteria and a budget, and modify the plan. The model is supplied rather than developed by students, so this is practice rather than full evidence toward the PE.

MS-LS2-1Supports: energy as the resource that limits how many organisms each trophic level can supportCA Grade 7

Analyze and interpret data to provide evidence for the effects of resource availability on organisms and populations of organisms in an ecosystem.

The trophic pyramid explains why an ecosystem supports far fewer top predators than producers: the energy resource shrinks at every level. This gives background for the resource-availability reasoning of MS-LS2-1 without the data analysis that PE calls for.

Science and engineering practices

  • Developing and Using Models. Students build a card-and-string food web with nonliving pools (Lab 1), run a water-volume model of energy transfer (Lab 2), interpret and complete food-web and pyramid diagrams (W4), and use a rule-based lake model to generate data (Lab 3).
  • Using Mathematics and Computational Thinking. Students compute energy at each trophic level with the ten-percent rule of thumb, calculate transfer efficiencies from data (W5), and iterate a rule-based lake model by hand over a four-year plan plus a hold year (Lab 3).
  • Engaging in Argument from Evidence. Students argue, with evidence from model output and monitoring data, whether a restoration plan worked and what should be modified (Lab 3, W6, W9).
  • Constructing Explanations and Designing Solutions. Students explain where a goat's and a steer's missing feed went (W1, slide 13) and design a restoration plan that meets criteria within constraints (Lab 3, W9).

Disciplinary core ideas

  • LS2.B Cycle of Matter and Energy Transfer in Ecosystems. Food webs model how matter and energy pass among producers, consumers and decomposers; matter moves into and out of the nonliving environment at every level; decomposers return nutrients from remains to soil and water; energy enters as sunlight and leaves as heat.
  • LS2.C Ecosystem Dynamics, Functioning, and Resilience. A change in one population ripples through the web as direct and indirect effects; a lake pushed out of balance by nutrients can be nudged back by changing its food web.
  • ETS1.B Developing Possible Solutions. A solution is tested, the results are measured, and the solution is modified; models are a way to test a solution before applying it to a whole lake.

Crosscutting concepts

  • Energy and Matter. The core contrast of the chapter: matter is conserved and cycles between living and nonliving parts, while energy flows through, shrinking at every transfer as heat leaves.
  • Systems and System Models. Students decide what is inside the system boundary (which organisms, which nonliving pools), and see that adding decomposers and the air changes what the model can explain.
  • Cause and Effect. Direct and indirect effects let students trace a cause through two or three links of a web and predict the sign of the change at each step.
  • Stability and Change. The lake case shows a system knocked into a new murky state and the iterative work needed to return it toward clear water.

Presentation 26 slides

Food Webs and Trophic Pyramids: matter comes around, energy passes through. Original, editable slides with speaker notes: a phenomenon opener, learning targets, the chapter's concepts with diagrams, vocabulary in context, 3 checks for understanding, 2 discussion prompts, an application task, a misconception check, a synthesis and an exit ticket.

Worksheets 10 of 10

Ten different tasks, one per instructional blueprint. Each has a student PDF (low ink, US Letter), an editable DOCX, an HTML preview, and a separate teacher answer key with reasoning.

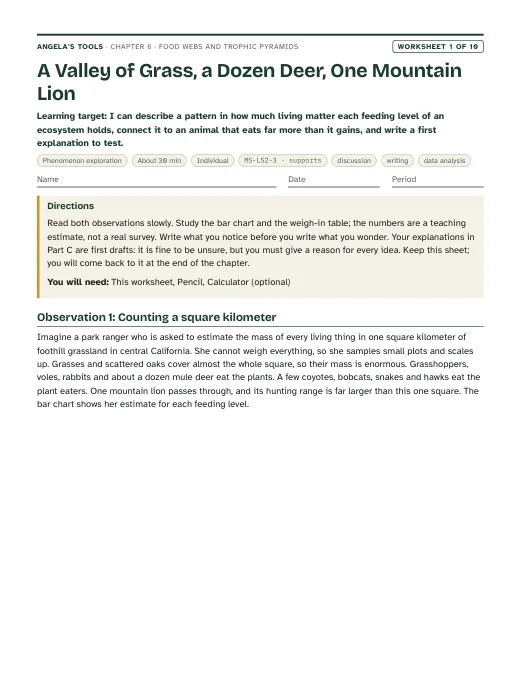
First page of A Valley of Grass, a Dozen Deer, One Mountain Lion
Worksheet 1 · Phenomenon exploration

A Valley of Grass, a Dozen Deer, One Mountain Lion

I can describe a pattern in how much living matter each feeding level of an ecosystem holds, connect it to an animal that eats far more than it gains, and write a first explanation to test.

30 minindividualActivates prior knowledgeDiscussionWritingData analysis MS-LS2-3 · supports
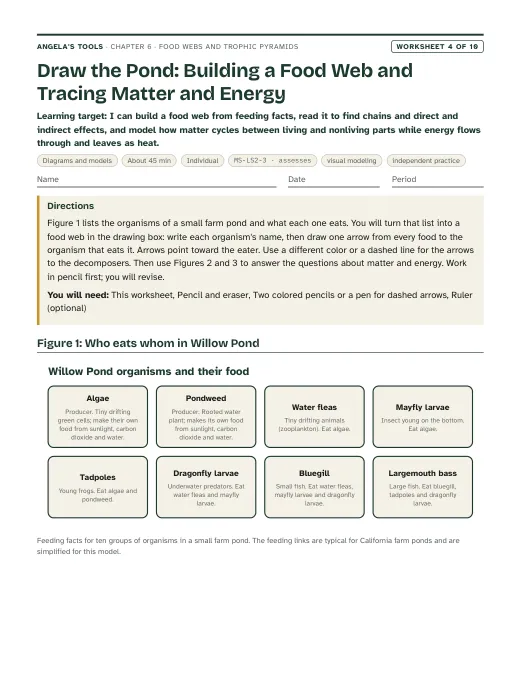
First page of Draw the Pond: Building a Food Web and Tracing Matter and Energy
Worksheet 4 · Diagrams and models

Draw the Pond: Building a Food Web and Tracing Matter and Energy

I can build a food web from feeding facts, read it to find chains and direct and indirect effects, and model how matter cycles between living and nonliving parts while energy flows through and leaves as heat.

45 minindividualPracticeVisual modelingIndependent practice MS-LS2-3 · assesses
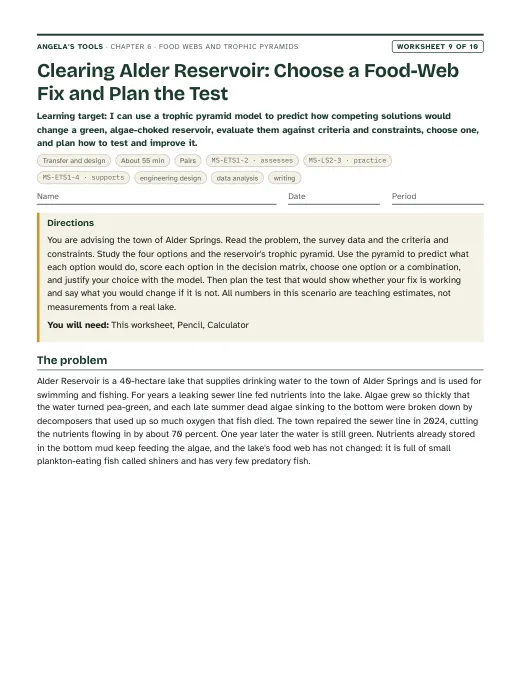
First page of Clearing Alder Reservoir: Choose a Food-Web Fix and Plan the Test
Worksheet 9 · Transfer and design

Clearing Alder Reservoir: Choose a Food-Web Fix and Plan the Test

I can use a trophic pyramid model to predict how competing solutions would change a green, algae-choked reservoir, evaluate them against criteria and constraints, choose one, and plan how to test and improve it.

55 minpairsExtensionEngineering designData analysisWriting MS-ETS1-2 · assessesMS-LS2-3 · practiceMS-ETS1-4 · supports

Collaborative labs 3 of 3

Three different investigation approaches. Each has a teacher guide (purpose, materials with quantities, estimated cost, prep, safety, procedure, expected observations, debrief, answer key, assessment criteria, accessibility adaptations, low-cost alternative) and a student recording sheet.

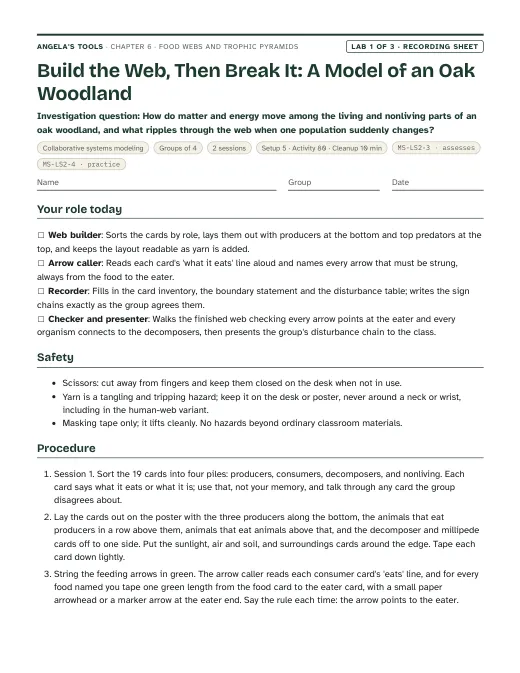
First page of the Build the Web, Then Break It: A Model of an Oak Woodland recording sheet
Lab 1 · Collaborative systems modeling

Build the Web, Then Break It: A Model of an Oak Woodland

How do matter and energy move among the living and nonliving parts of an oak woodland, and what ripples through the web when one population suddenly changes?

Groups of 42 sessions80 min activityEst. 8 to 12 per classWoodland card set (19 cards from the recording sheet) printed on cardstock and cut apartYarn in three colors (for example green for feeding arrows, brown for arrows to decomposers, yellow for matter and energy exchanges with the nonliving cards)Masking tape MS-LS2-3 · assessesMS-LS2-4 · practice
First page of the Pouring Energy Up the Pyramid: A Water Model of Trophic Levels recording sheet
Lab 2 · Physical model

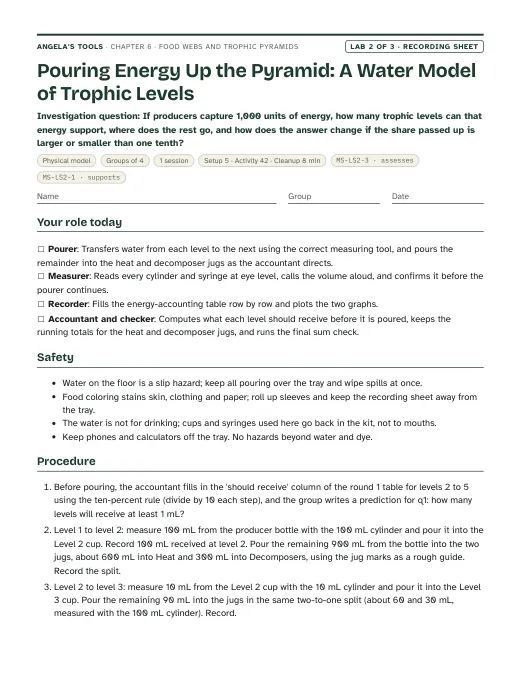
Pouring Energy Up the Pyramid: A Water Model of Trophic Levels

If producers capture 1,000 units of energy, how many trophic levels can that energy support, where does the rest go, and how does the answer change if the share passed up is larger or smaller than one tenth?

Groups of 41 session42 min activityEst. 8 to 14 per class1-liter bottle of tap water tinted with a few drops of food coloring, labeled 'Level 1: producers'Clear plastic cups labeled 'Level 2', 'Level 3', 'Level 4', 'Level 5'Large containers (about 1 L) labeled 'Heat to surroundings' and 'Wastes, remains and uneaten: to decomposers' MS-LS2-3 · assessesMS-LS2-1 · supports
First page of the Fixing Lake Vesipuro: Test a Restoration Plan on Paper recording sheet
Lab 3 · Data-driven decision

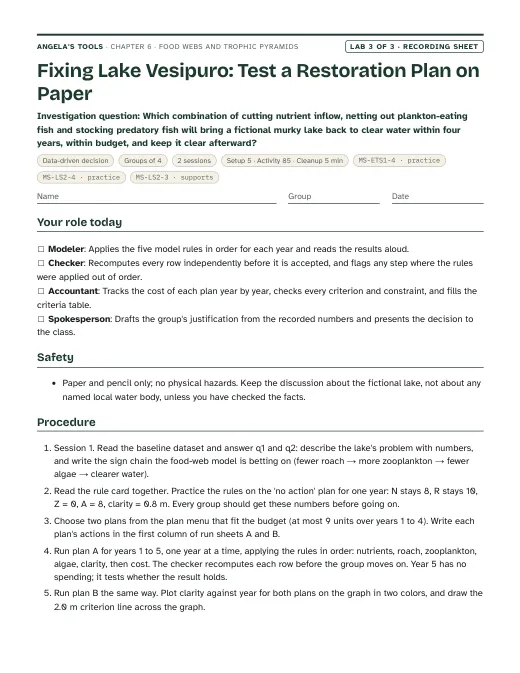
Fixing Lake Vesipuro: Test a Restoration Plan on Paper

Which combination of cutting nutrient inflow, netting out plankton-eating fish and stocking predatory fish will bring a fictional murky lake back to clear water within four years, within budget, and keep it clear afterward?

Groups of 42 sessions85 min activityEst. 2 to 4 per classRecording sheet with the baseline dataset, the model rule card, the plan menu and three run sheetsCalculatorPencils and an eraser (runs get revised) MS-ETS1-4 · practiceMS-LS2-4 · practiceMS-LS2-3 · supports

Teacher guidance

Suggested sequence (8 steps)
  1. Period 1: Presentation slides 1-8 (steer phenomenon, targets, reading arrows, a grassland food chain and web, direct and indirect effects, first check). W1 phenomenon worksheet as the opener; W2 vocabulary relationships to close.
  2. Period 2: Lab 1 session 1, Build the Web, Then Break It: groups lay out the oak-woodland organism cards, string the arrows, add decomposers, the air, the soil and the sun, and write the system boundary.
  3. Period 3: Lab 1 session 2: each group applies one disturbance, records direct and indirect effects, and presents one chain of reasoning. Slides 9-12 (decomposers, the matter cycle diagram, vocabulary, the no-decomposers discussion). W3 reading passage for homework.
  4. Period 4: Slides 13-16 (where the eaten matter goes, the energy pyramid, the ten-percent rule of thumb, energy check). Lab 2, Pouring Energy Up the Pyramid, one session. W4 diagram worksheet can follow or be assigned.
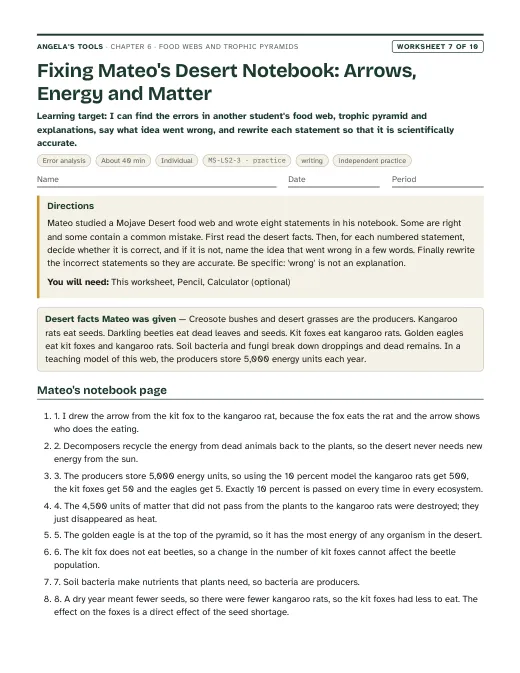
  5. Period 5: Slides 17-20 (matter cycles while energy flows, the sunlight discussion, pyramids that flip, the sea otter and kelp connection). W5 data worksheet and W7 misconception repair.
  6. Period 6: Slides 21-23 (lake data task, the engineering story and what the published history adds, evidence check). Lab 3 session 1, Fixing Lake Vesipuro: baseline data and the first two plans run through the model. W6 CER on the steer evidence.
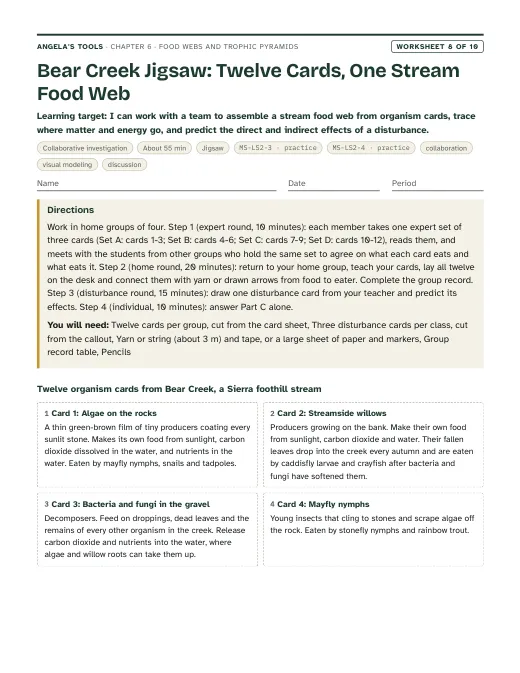
  7. Period 7: Lab 3 session 2: modify a plan, decide, justify. W8 collaborative jigsaw (the Bear Creek food web and a disturbance) consolidates the web reasoning; W9 transfer design challenge carries the restoration reasoning to a new reservoir.
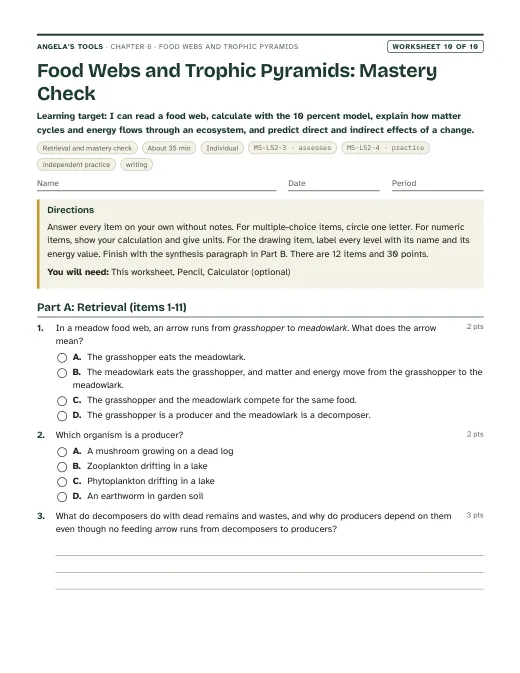
  8. Period 8: Slides 24-26 (misconception, synthesis, exit). W10 mastery as the quiz. Preview Lesson 7, where the carbon and nitrogen cycles extend the matter loop to the whole planet.

Materials overview: No chemicals, flames or live organisms. Lab 1 uses printed organism cards, yarn, tape and poster paper. Lab 2 uses water tinted with food coloring, a 1-liter bottle, graduated cylinders, 1 mL oral syringes or droppers, labeled cups and a tray. Lab 3 is paper only: printed data pages, the model rule card and a calculator. The steer phenomenon needs only the numbers on the slide; a bathroom scale and a bale of hay make a good prop if available.

Common misconceptions (6)
“Energy is recycled in an ecosystem the same way matter is.”
Why it happens: The textbook itself says energy 'cycles' and is 'recycled', and diagrams with arrows looping back to producers suggest a closed loop for everything.
Correction: Only matter cycles. Energy enters as sunlight, is passed up the food chain in shrinking shares, and leaves living things as heat that producers cannot use to make food. That is why an ecosystem needs sunlight every day but never needs new atoms.
“Matter is lost or used up as it moves up a food chain.”
Why it happens: The book's captions say matter is 'lost' between levels, and students see the steer gain only a tenth of what it ate.
Correction: No atom disappears. The matter that does not become new tissue leaves the animal as carbon dioxide and water from cellular respiration, as dung and urine, and as uneaten remains that decomposers take up. Every kilogram can be accounted for somewhere in the ecosystem.
“The arrow in a food web points to the thing that gets eaten.”
Why it happens: Students read arrows as 'eats' or 'attacks', the way a coach's diagram shows a player moving toward a target.
Correction: The arrow shows where the matter and energy go: from the food to the eater. A grass-to-grasshopper arrow means grass matter becomes grasshopper matter.
“Exactly ten percent of the energy passes to each next level, in every ecosystem.”
Why it happens: The book presents the ten-percent figure as a fixed value and uses it for every level of its worked example.
Correction: Ten percent is a rough average. Measured transfer efficiencies run from a few percent to over twenty percent depending on the organisms and the ecosystem. Use the rule of thumb for estimates and say so.
“There are always fewer organisms, and less biomass, at each higher level.”
Why it happens: Pyramid drawings are always shown narrowing upward, and the book says populations get smaller at each level.
Correction: The energy passed up to each level over a year always shrinks. Counts need not: one oak can feed thousands of caterpillars. A snapshot of biomass can also flip in open water, where fast-growing phytoplankton are eaten almost as quickly as they grow.
“Producers get their food from decomposers.”
Why it happens: Decomposers 'make nutrients available to plants', which sounds like feeding.
Correction: Producers make their own food from carbon dioxide, water and light. Decomposers release carbon dioxide and mineral nutrients into air, soil and water; producers absorb those raw materials from the environment, not from the decomposers' bodies. That is why food webs draw no arrow from decomposers to producers.
Differentiation suggestions (5)
  • Multilingual learners: Pre-teach producer, consumer, decomposer, arrow and level with picture cards and the gesture 'arrow points to the eater'. Let students label the Lab 1 cards in their home language on the back. Provide the direct/indirect sentence frames: 'More ___ means fewer ___ because ___ eats ___' and 'That means more ___, even though ___ never touches ___'.
  • Students who need more support: Give a partly strung food web (producers and two consumers already connected) in Lab 1; a pre-labeled energy table with the 1,000 and 100 rows filled in for Lab 2; and the year-1 row of each plan already computed in Lab 3. Provide a decade-of-ten chart (1,000, 100, 10, 1, 0.1) for the pyramid math.
  • Students ready for extension: Ask them to estimate how much grassland a single hawk needs using the pyramid and a plausible grass productivity, to research why open-ocean biomass pyramids can be inverted, or to read about the Lake Vesijärvi review and list two ways the real history differs from the textbook's version.
  • Students who need movement or alternative output: Run the food web as a human web: each student holds a card and a ball of yarn passes from food to eater across the room; then 'remove' one student and have everyone holding a slack string raise a hand. Accept a recorded spoken explanation for the disturbance reasoning and a labeled photo of the yarn web as the model.
  • Students with limited fine-motor control or low vision: Use large-print cards with raised tape on producer cards; let a partner tie yarn while the student directs and calls each arrow aloud; in Lab 2 assign the recorder or checker role and provide a wide-mouth cup instead of a cylinder for the 100 mL pour.
Accuracy notes: where the textbook simplifies (11)
  • Energy does not cycle: the Introduction (p. 65) says energy and matter are 'recycled' and the Key Science Concept (p. 72) says trophic pyramids show how energy 'cycles' through an ecosystem. Energy flows one way. It enters as sunlight, is stored in food, and leaves living things as heat at every transfer; producers cannot turn that heat back into food. Teach 'matter cycles, energy flows' and never say energy is recycled.
  • Matter is not 'lost': Figure 3 (p. 70) and the Key Science Concept (pp. 72-73) say matter is lost between levels. Matter is conserved. It leaves a food chain as carbon dioxide and water from cellular respiration, as wastes, and as uneaten remains taken up by decomposers, and all of it is recycled. Say 'leaves the chain' or 'goes to the air, soil, water or decomposers'.
  • Ten percent is an average, not a law: Section 4 and Figure 4 (p. 71) apply exactly ten percent at every level. Measured transfer efficiencies vary from a few percent to more than twenty percent. Every calculation in this chapter says 'using the ten-percent rule of thumb', and Lab 2 and W5 show other efficiencies.
  • Pyramids of numbers and biomass can be inverted: the Key Science Concept (p. 72) says populations get smaller at each level. That is true of the energy passed up per year, usually true of biomass on land, and not necessarily true of counts (one tree, thousands of insects) or of an open-ocean biomass snapshot, where quickly reproducing phytoplankton can weigh less at any moment than the zooplankton eating them. An energy pyramid never inverts.
  • Zooplankton are not single-celled: Section 3 (p. 70) calls zooplankton single-celled consumers. Many zooplankton are small multicellular animals such as copepods, krill and fish larvae; some are single-celled. Say 'tiny drifting consumers, many of them small animals'.
  • Figure 1A and the text disagree about the hawk: the text (p. 67) calls the red-tailed hawk a top predator and treats a hawk-to-rattlesnake link as indirect, but the figure draws arrows that contradict both. This chapter uses its own webs with every arrow stated; 'top predator' is defined as relative to the model.
  • Why oxygen ran low in the lake: Section 5 (p. 74) says the algae used up the oxygen. Living algae do respire, especially at night, but the main oxygen drain in a nutrient-polluted lake is decomposers breaking down the dead algae. Teach both parts.
  • The Lake Vesijärvi history is simplified: the published review by the scientists involved (Salonen et al., 2020) reports that sewage was diverted in the mid-1970s and that this diversion did much of the work; that over a million juvenile pikeperch (not pike) were stocked in 1984-1991, before and during a 1989-1993 mass removal of roach and other plankton-eating fish; and that the drop in phytoplankton was not clearly driven by extra zooplankton grazing, with the mechanism still debated. Teach the textbook's version as 'the food-web model's prediction' and as an example of test-measure-modify, and tell students the real story was messier. Lab 3 and the slide-21 task use a fictional lake with simulated data for this reason.
  • Detritivores versus decomposers: Section 2 (pp. 68-69) lists earthworms and dung beetles as decomposers. Many biologists call animals that eat dead material detritivores and reserve 'decomposer' for bacteria and fungi, which break matter down to simple substances outside their bodies. The chapter uses bacteria and fungi as decomposer examples and introduces 'detritivore' as an optional extra term. The book's claim that without decomposers matter would be locked away 'forever' is an overstatement; fire and slow chemical weathering also release nutrients.
  • The steer phenomenon numbers are typical rounded values (a growing steer eats roughly two to three percent of its body mass in dry feed per day and gains roughly a kilogram per day). They are not a measured dataset and should not be assessed as facts. The 'tenth' matches the biomass rule of thumb only approximately.
  • The sea otter, urchin and kelp story on slide 20 is well documented but not simple: urchin outbreaks in northern California after 2013-2014 followed a disease that killed sea stars and a marine heat wave, in a region where sea otters are absent. Present otters as one control on urchins, not the only one.

Review status: reviewed · 2026-10-18 · Re-solved every numeric and multiple-choice item in W1-W10 and Labs 1-3, including all six Lab 3 reference runs year by year; keys agree. Fixed stale cross-references: W8 is a stream food-web jigsaw, not lake or kelp evidence cards (chapter sequence, source reference, slides 12, 18, 20, 22). Softened slide 13 so heat is 'a large share' of the feed's energy, not 'most' (dung carries a comparable share for a grazer); evidence-of-learning item on the steer now separates matter exits from the energy exit. Lab 1 cards made self-consistent (coyote added to the oak's eaters, millipede-lizard link stated on both cards); Lab 2 q3 ideal sum check corrected (cups hold about 0.1 mL, not 1.1 mL). W8 q5 replaced (it duplicated W4 q5) with an omnivore trophic-level item; W8 retitled so it no longer mirrors Lab 1's title. W5 extension counts given a sensible area; W3 passage trimmed to 700 words and otter timeline reworded; slide 21 notes and Lab 3 debrief wording corrected; two phrases reworded for originality. Authoring notes retained: science checked against the prior reviewed notes (L06 reviewFlags RF1-RF9), OpenStax Biology 2e and Salonen et al. 2020; labs not physically tested; all lake data simulated.

Source references

Verified against the student edition of Bring Science Alive! 7th Grade Integrated (Student Edition). Printed page numbers appear in the book; PDF pages are the physical pages of the 524-page scan (printed + 36). The textbook is not reproduced on this site.

SectionPrinted pagesPDF pagesUsed for
Introduction: the grazing bison and the lesson question64, 65100, 101Lesson question, vocabulary list, the standards the publisher lists, and the biomass puzzle that inspired the steer phenomenon.
1. Food Webs: arrows, food chains, direct and indirect effects66, 67102, 103Arrow convention, food chains inside webs, top predators, direct and indirect effects (slides 4-8, Lab 1, W4, W7).
2. Decomposers: nature's recyclers and how they fit a food web68, 69104, 105Decomposers as consumers, why no arrow runs from decomposers to producers, the matter cycle diagram (slides 9-12, Lab 1 nonliving pools, W3).
3. Biomass in Food Webs: the tuna sandwich and the shrinking squares70106Where eaten matter goes (slide 13, W1, W6), biomass as a term, the phytoplankton chain used in W5.
4. Energy in Food Webs: the trophic pyramid and the ten-percent figure71107Trophic pyramid model, the ten-percent rule of thumb and its limits (slides 14-16, Lab 2, W5, W10).
Key Science Concept: Biomass and Energy in Food Webs72, 73108, 109The 'energy cycles' and 'matter is lost' wording corrected in accuracy notes and on the misconception slide; the matter-versus-energy compare diagram (slide 17).
5. Using Trophic Pyramids to Restore an Ecosystem (Engineering Design)72, 73, 74108, 109, 110The test-measure-modify story of the Finnish lake, counting algae in drops of water, the engineering standard (slides 21-23, Lab 3, W9).
Lesson Summary75111Check that every summary idea is covered by a target and a slide.

External references used for accuracy checks

Related chapters