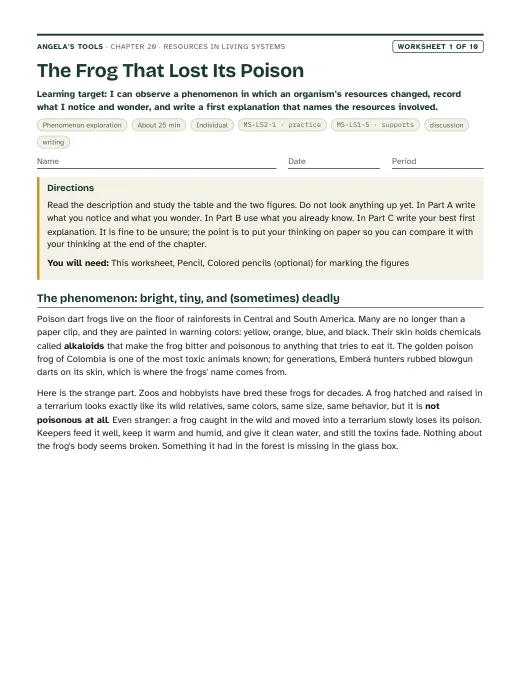
Worksheet 1 · Phenomenon exploration
The Frog That Lost Its Poison
I can observe a phenomenon in which an organism's resources changed, record what I notice and wonder, and write a first explanation that names the resources involved.
Teacher only
 Angela's Wand
Chapter 20 · Unit 7: Resources in Ecosystems · Segment 3
What do living things need from their surroundings, and what happens to organisms and populations when a needed resource runs short?
Students figure out that every living thing draws what it needs from its surroundings, that some of those needs are other living things (food) and some are nonliving (water, light, oxygen, nutrients, space), and that whichever needed resource runs short first puts a ceiling on how large a population can grow. They watch a carrying capacity appear in a bead-and-card deer simulation, grow real duckweed under different light and nutrient supplies, and work through case-study data to tell a pattern from a cause and to decide what a wildlife manager should do before the next drought. Along the way they learn why poison dart frogs raised in captivity are harmless: the poison is built from chemicals in their wild diet. The chapter prepares students for the predator, parasite and partner interactions of Lesson 21 and the changing ecosystems of Lesson 22.
Estimated class time: presentation about 134 minutes · worksheets about 395 minutes in total · labs 5 sessions. Seven 50-minute core periods for the presentation and the three labs, spread over about three weeks because the duckweed investigation (Lab 2) needs two weeks of growth. Set up Lab 2 in period 2 so that its final count lands in period 7. The ten worksheets add about 395 minutes (roughly eight more periods), so the sequence places each one, but most must go home, into extra periods or stations, or be chosen from.
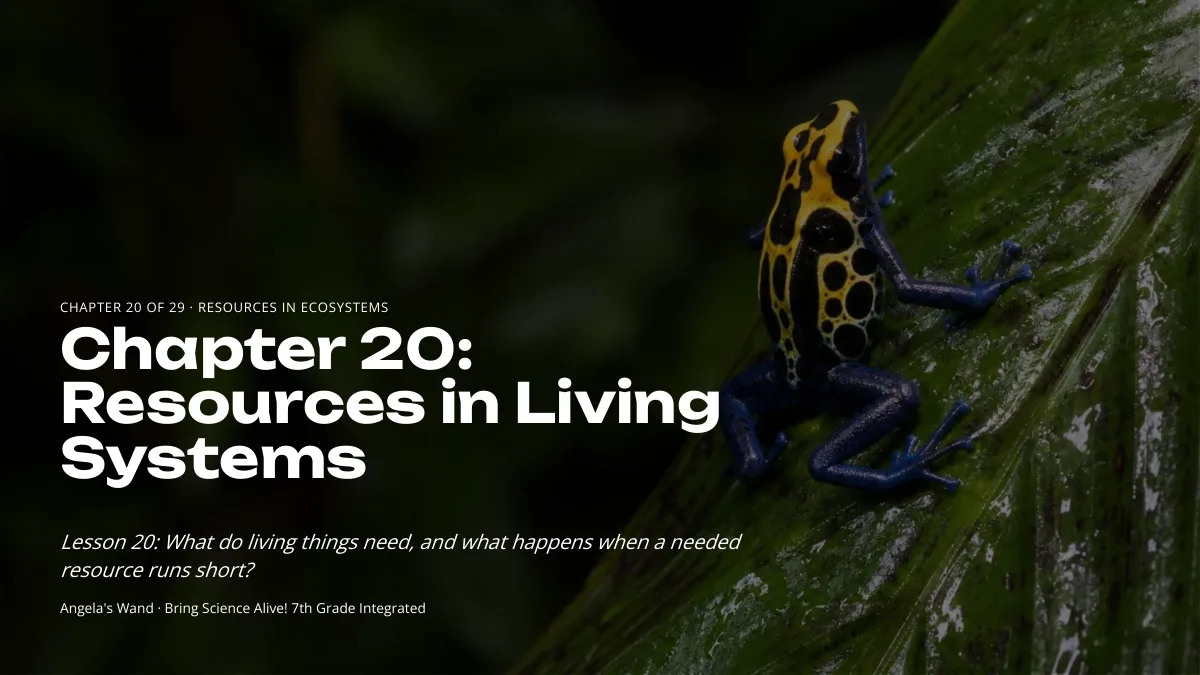
Some small, brilliantly colored frogs of Central and South American rainforests carry enough poison in their skin that hunters once wiped blowgun darts across their backs. Yet frogs of the same species hatched and raised in a zoo or a home terrarium can be handled safely, and wild-caught frogs kept in captivity slowly lose their poison over months and years. The captive frogs look the same, breathe the same air, and live at about the same temperature as wild frogs. Something a wild frog gets from its surroundings, and a captive frog does not, is missing.
Notice and wonder prompts
California NGSS, Grade 7 Preferred Integrated Course Model. Each entry says whether this chapter's work assesses the performance expectation, gives practice toward it, or supports it as background; the resource lists below repeat this for every worksheet and lab.
Analyze and interpret data to provide evidence for the effects of resource availability on organisms and populations of organisms in an ecosystem.
Lab 2 produces real duckweed counts and frond condition under different light, nutrient and crowding conditions, Lab 3 has students analyze a simulated twelve-year record of rainfall, forage, deer counts and fawn mass, and W5 a simulated record of rain, grass and pronghorn. Each asks students to use the data as evidence for how resource availability affects organisms and populations, which is the PE as written. Lab 1 builds the same analysis with model-generated data from abundant and scarce bead meadows.
Construct an explanation that predicts patterns of interactions among organisms across multiple ecosystems.
Students see competition within a species (horses for grass), between species (yaks and horses; cattle and deer in Lab 3) and in a cup of duckweed, and they predict the same pattern in a new ecosystem. Predator and mutualist interactions are Lesson 21, so this chapter builds toward the PE rather than assessing it.
Construct an argument supported by empirical evidence that changes to physical or biological components of an ecosystem affect populations.
In Lab 3 students argue from simulated data that adding cattle to a range changed the deer population, and must separate the cattle effect from rainfall, recovery lag, water, predators and counting error. This is practice for the evidence-based argument the PE requires; Lesson 22 assesses it with real ecosystem changes.
Construct a scientific explanation based on evidence for how environmental and genetic factors influence the growth of organisms.
Fawn mass in the Lab 3 case file and frond growth in Lab 2 show that resource supply affects how large individuals grow, not only how many there are. In the California integrated sequence this PE belongs to Grade 6, so it appears here as background that students should already have met, not as a target.
Assessment boundary: Assessment does not include genetic mechanisms, gene regulation, or biochemical processes.
Evaluate competing design solutions using a systematic process to determine how well they meet the criteria and constraints of the problem.
The lesson has no engineering spread; this code comes in through W9, where pairs test four drought options for a fenced elk herd against criteria, constraints and a budget in a check table and defend a plan, and through the Lab 3 plan check, where groups test plans A to E against two criteria and two constraints. The options, criteria and checking steps are supplied in both, so this is practice rather than assessment.
Resources in Living Systems: what living things need and what happens when it runs short. Original, editable slides with speaker notes: a phenomenon opener, learning targets, the chapter's concepts with diagrams, vocabulary in context, 3 checks for understanding, 2 discussion prompts, an application task, a misconception check, a synthesis and an exit ticket.
Ten different tasks, one per instructional blueprint. Each has a student PDF (low ink, US Letter), an editable DOCX, an HTML preview, and a separate teacher answer key with reasoning.
I can observe a phenomenon in which an organism's resources changed, record what I notice and wonder, and write a first explanation that names the resources involved.
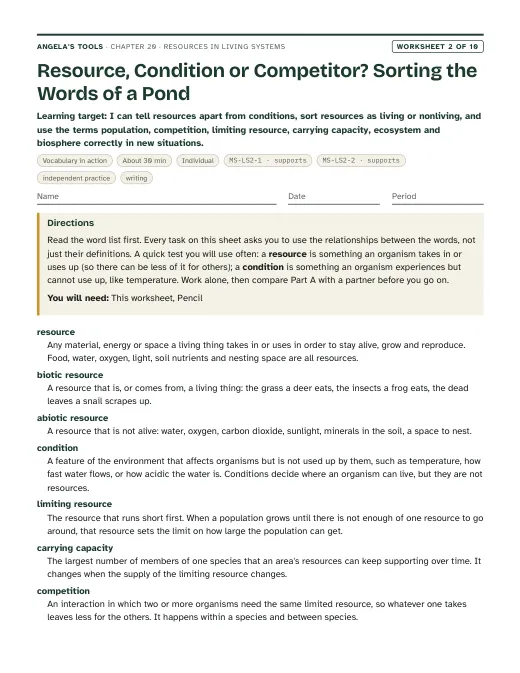
I can tell resources apart from conditions, sort resources as living or nonliving, and use the terms population, competition, limiting resource, carrying capacity, ecosystem and biosphere correctly in new situations.
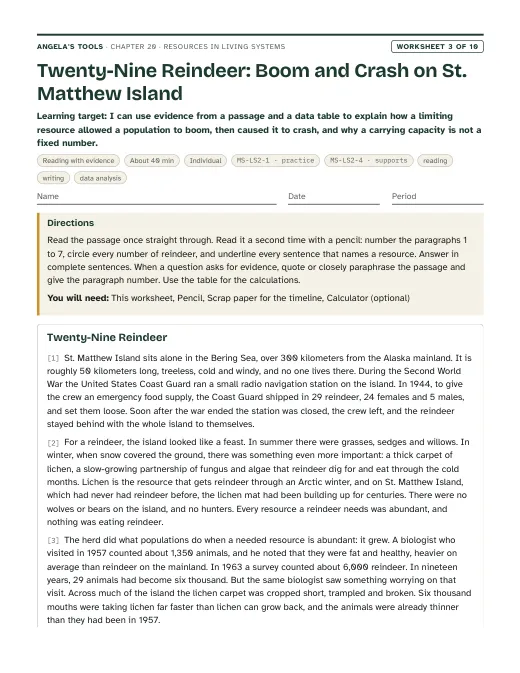
I can use evidence from a passage and a data table to explain how a limiting resource allowed a population to boom, then caused it to crash, and why a carrying capacity is not a fixed number.
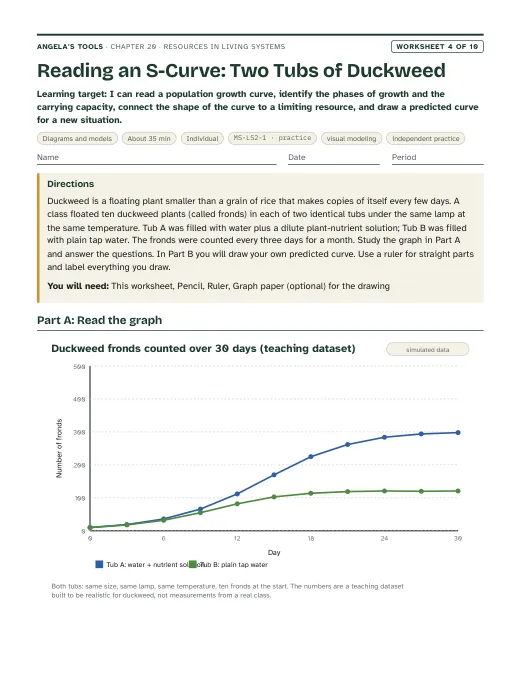
I can read a population growth curve, identify the phases of growth and the carrying capacity, connect the shape of the curve to a limiting resource, and draw a predicted curve for a new situation.
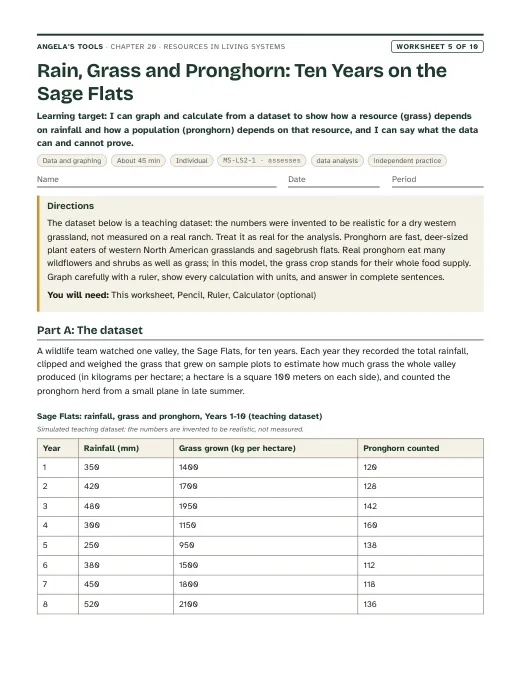
I can graph and calculate from a dataset to show how a resource (grass) depends on rainfall and how a population (pronghorn) depends on that resource, and I can say what the data can and cannot prove.
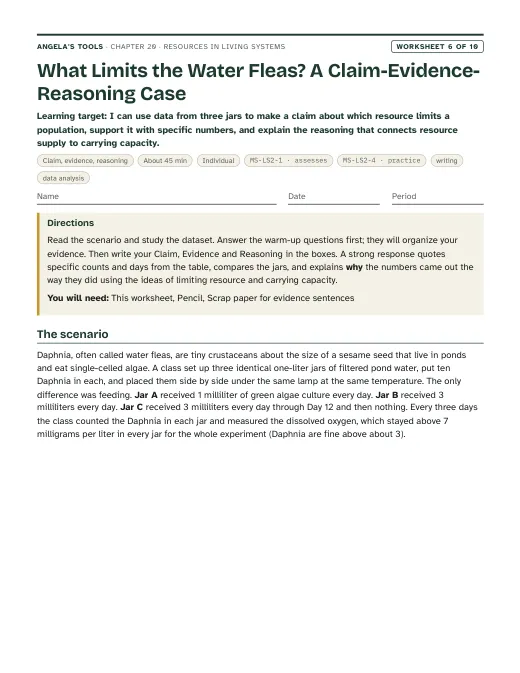
I can use data from three jars to make a claim about which resource limits a population, support it with specific numbers, and explain the reasoning that connects resource supply to carrying capacity.
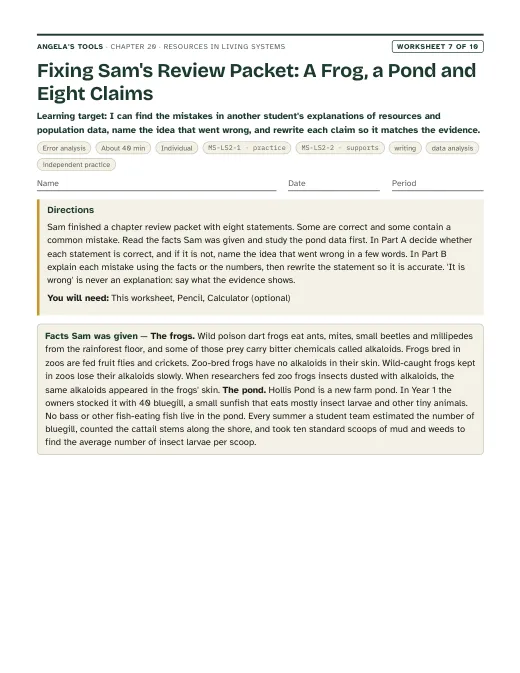
I can find the mistakes in another student's explanations of resources and population data, name the idea that went wrong, and rewrite each claim so it matches the evidence.
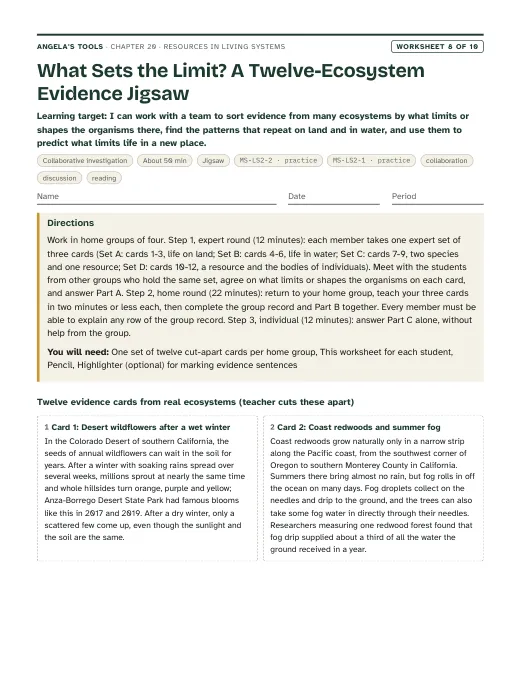
I can work with a team to sort evidence from many ecosystems by what limits or shapes the organisms there, find the patterns that repeat on land and in water, and use them to predict what limits life in a new place.
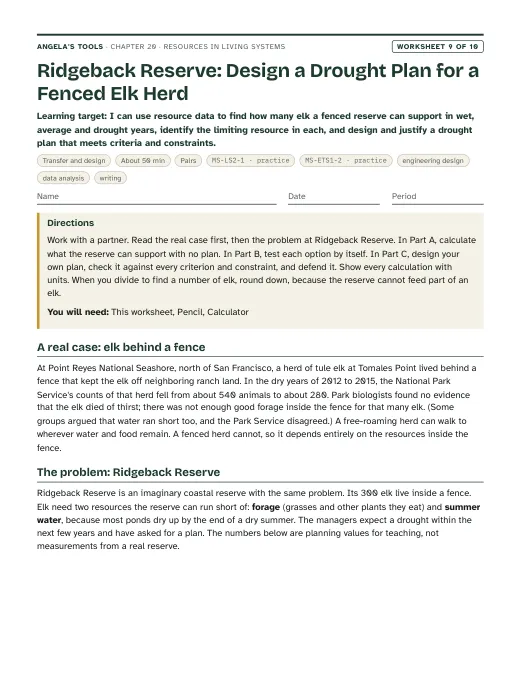
I can use resource data to find how many elk a fenced reserve can support in wet, average and drought years, identify the limiting resource in each, and design and justify a drought plan that meets criteria and constraints.
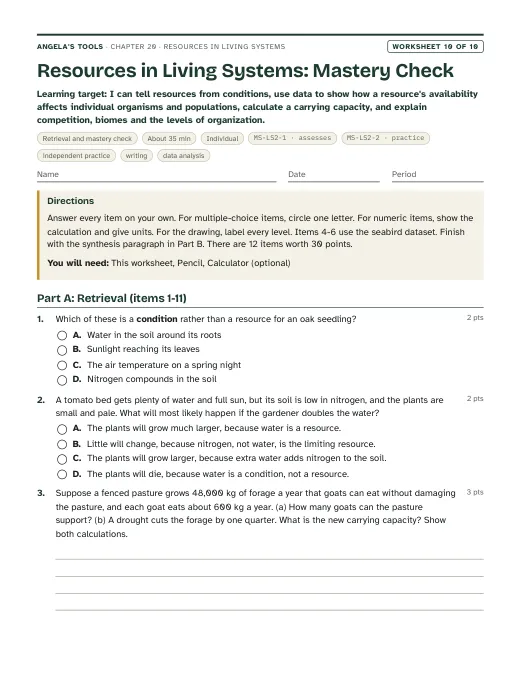
I can tell resources from conditions, use data to show how a resource's availability affects individual organisms and populations, calculate a carrying capacity, and explain competition, biomes and the levels of organization.
Three different investigation approaches. Each has a teacher guide (purpose, materials with quantities, estimated cost, prep, safety, procedure, expected observations, debrief, answer key, assessment criteria, accessibility adaptations, low-cost alternative) and a student recording sheet.
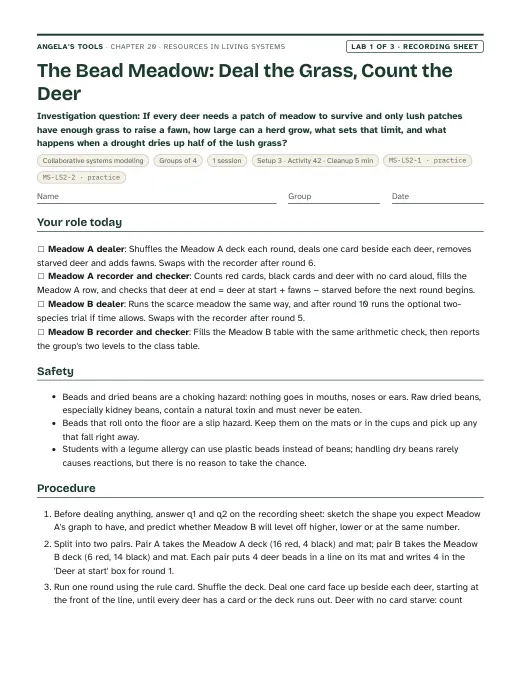
If every deer needs a patch of meadow to survive and only lush patches have enough grass to raise a fawn, how large can a herd grow, what sets that limit, and what happens when a drought dries up half of the lush grass?
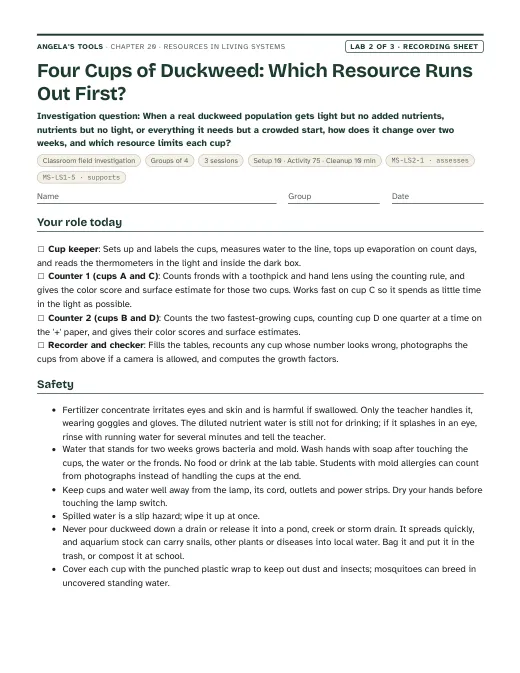
When a real duckweed population gets light but no added nutrients, nutrients but no light, or everything it needs but a crowded start, how does it change over two weeks, and which resource limits each cup?
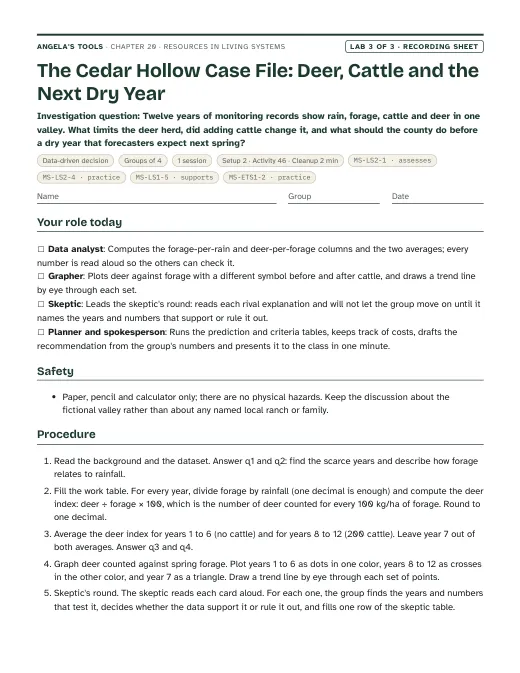
Twelve years of monitoring records show rain, forage, cattle and deer in one valley. What limits the deer herd, did adding cattle change it, and what should the county do before a dry year that forecasters expect next spring?
Materials overview: No chemicals beyond diluted liquid houseplant fertilizer, which the teacher dilutes. Lab 1 needs about 70 beads or dried beans (plus 15 of a second color for the two-species trial) and one deck of playing cards per group. Lab 2 needs four clear cups per group, common duckweed (an aquarium shop or online supplier; about 70 fronds per group), aged tap water, the diluted fertilizer, a box for the dark cup and a bright window or a grow light. Lab 3 needs only the printed case file, graph paper and calculators. The frog phenomenon is described, not demonstrated; no live animals are used.
Review status: reviewed · 2026-10-19 · Re-solved every numeric, multiple-choice, true/false, fill and table item in W1-W10 and Labs 1-3, including the Lab 3 index and planning tables (averages 35.0 and 27.0; 230/196, 201/174 and 172/151 deer; plan E with 50 cattle 216/185 deer at $9,000; feasible plan E keeps about 34 to 71 cattle), the W9 capacities (600, 360, 120; corridor 303; plans at $57,000 and $37,400) and the W3, W4, W5, W6, W7 and W10 arithmetic; all keys agree. Lab 1 re-simulated (100,000 runs): the levels 36, 26 and 20 are exact; Meadow A first reaches 36 in round 4 (89 percent) or 5; Meadow B misses 26 by round 10 in about 1 run in 60, not 1 in 25 (corrected); the two-species deer median is 18. Lab 1 cost floor raised to $12, since eight decks of cards alone are about $10. Tule elk: the Park Service attributes the Tomales Point decline (about 540 to about 280, 2012-2015) to too many elk for poor dry-year forage, reports that water was available and found no evidence of death by thirst; the drafts said it linked the deaths to scarce water. Corrected in the accuracy notes, slide 18 (body, notes, links), W9 (case text, q2 key, teacher notes) and Lab 3 q8 (prompt and key now ask how the water question was settled); the fence is described in the past tense with the December 2024 removal decision and lawsuit flagged; the NPS FAQ page was added to externalReferences. Other science fixes: slide 24 no longer gives bees and rattlesnakes (venomous) as animals that make their own poison, and its bullet now says captive-bred; slides 19-20 no longer say water removes light within a few meters everywhere; exit item 1 asks about a horse because a grass plant has no clean biotic resource; slide 13 says less grass, not fewer grass plants (biomass); W1 frogs soak up water through the skin instead of drinking; W3 puts St. Matthew over 300 km from the mainland and drops an unsupported 'few thousand' carrying-capacity figure; W5 extension uses six pronghorn per cow (about 10 kg of forage a day, in line with Lab 3's six mule deer), so the key is now 24 percent; W8 card 7 uses Connell's 'crushing' and card 9 no longer says Gause's winning species 'kept growing'; W4 duckweed is smaller than a grain of rice. Ambiguity: the slide 9 year-3 count is now 37 instead of 38 so slide 11's 'grew the most' has one answer (years 3 to 4, a gain of 15). Vocabulary trimmed from 13 to 12 by removing biosphere, which L10 defines; the term is still taught on slide 22 and in W2 and W10. The population example sentence no longer states an untested Lab 2 result as fact. Standards: MS-ETS1-2 added to chapter.json and Lab 3 as practice, matching W9 (the drought plan) and the Lab 3 plan check, where the options, criteria and checking steps are supplied, as in L21; W9's note now agrees with its practice role. caGrade checked everywhere (7 for the LS2 codes, 6 for MS-LS1-5 with the Grade 6 note, 6-8 for ETS1). Consistency: the sequence's slides 15-16 (pattern versus cause), W7 (Sam's packet, statements 3 and 5) and W8 (the twelve-card jigsaw) match the files as written, and period 6 now names what W7 covers. Pacing now says the seven periods cover the deck and the labs while the ten worksheets (about 395 minutes) need homework or extra periods. The W6 evidence-of-learning item describes the Daphnia CER. Four slide links corrected (slides 9 and 11 point to W4, slide 12 to W8 cards 7-9, slide 20 to W8 card 4 and W10 q11). Checked and kept: the dart-frog explanation (alkaloids sequestered from ants, mites, beetles and millipedes; captive-bred frogs not toxic; feeding experiments; accuracy note now adds that some species modify alkaloids but none is known to build them), the St. Matthew facts (Klein 1968: 29 released in 1944, about 1,350 in 1957, about 6,000 in 1963, 42 with 41 females in 1966, gone by the 1980s) and the W8 card facts. Originality: no 6-word runs shared with the lesson text. Flagged, not changed: W9 and the Lab 3 decision both choose a plan against criteria and a budget, and W5 and Lab 3 both compute forage per millimeter of rain; they differ in data and purpose but repeat a move. The labs have not been physically tested.
Verified against the student edition of Bring Science Alive! 7th Grade Integrated (Student Edition). Printed page numbers appear in the book; PDF pages are the physical pages of the 524-page scan (printed + 36). The textbook is not reproduced on this site.
| Section | Printed pages | PDF pages | Used for |
|---|---|---|---|
| Introduction: grazers on the Mongolian steppe; lesson vocabulary; publisher's standards box | 262, 263 | 298, 299 | Lesson question, the idea that nonliving conditions limit where organisms live, the vocabulary list that the chapter redefines. |
| 1. Living Things Need Resources | 264 | 300 | Definition of resource, living and nonliving resources, the different resource lists of a horse and a grass plant, organism and species. |
| 2. Competition for Resources Affects Populations | 265 | 301 | Competition within a species, population defined, abundant versus sparse grass and population size, the cause-and-effect framing the chapter refines. |
| 3. Competition for Resources Affects Ecosystems | 266 | 302 | Competition between species (yaks and horses), reduced competition when species use a resource differently, the ecosystem definition, rainfall to grass to grazers. |
| Key Science Concept: Limited Resources Affect Populations (graph page) | 267 | 303 | The rainfall-grass and rainfall-zebra relationships that the pattern-versus-cause slides and Lab 3 build on with original simulated data. |
| 4. Biomes are Shaped by Limited Resources; terrestrial and aquatic biomes | 268, 269 | 304, 305 | Biome definition, grassland types, water and temperature on land, light and nutrients in water, the lake-light layers diagram. |
| 5. Organization of Earth's Biosphere; humans in the biosphere; Lesson Summary | 270, 271 | 306, 307 | Levels of organization, the biosphere's extent, human use of resources and its effect on other populations and on ecosystems. |