Chapter 27 · Unit 10: Humans and Changing Ecosystems · Segment 4

Biodiversity

Why does biodiversity matter to how ecosystems work and to people, and how can we judge which plan best protects it?

MS-LS2-5 · assessesMS-LS2-4 · practiceMS-ETS1-3 · practiceMS-ETS1-2 · practice Textbook pp. 358–373 1 presentation · 10 worksheets · 3 labs

Overview

Students figure out what biodiversity is, how to measure it in a sample, and why the full set of species an ecosystem naturally holds is a sign of its health. They compare a fragile Arctic tundra web, a kelp forest held together by a keystone predator, and a rainforest crowded with specialists, and trace how the loss of one population can spread to many others and to the people who rely on living things for medicines, food, materials and other ecosystem services. The chapter ends where the standard does: students evaluate competing plans for protecting biodiversity against agreed criteria and scientific, economic and social constraints, then combine the strongest parts of several plans, the way engineers paired a gecko-like texture with a mussel-like glue.

Estimated class time: presentation about 137 minutes · worksheets about 435 minutes in total · labs 5 sessions. Eight 50-minute periods: about three periods of presentation, discussion and worksheets spread across the week, two for Lab 1 (sampling outdoors, then calculating), one for Lab 2, and two for Lab 3. Several worksheets work as homework or as station work between labs; W8 and W9 each need close to a full period, so plan a ninth period if you use both in class.

Phenomenon

Fifty-one parrots and a handful of islands

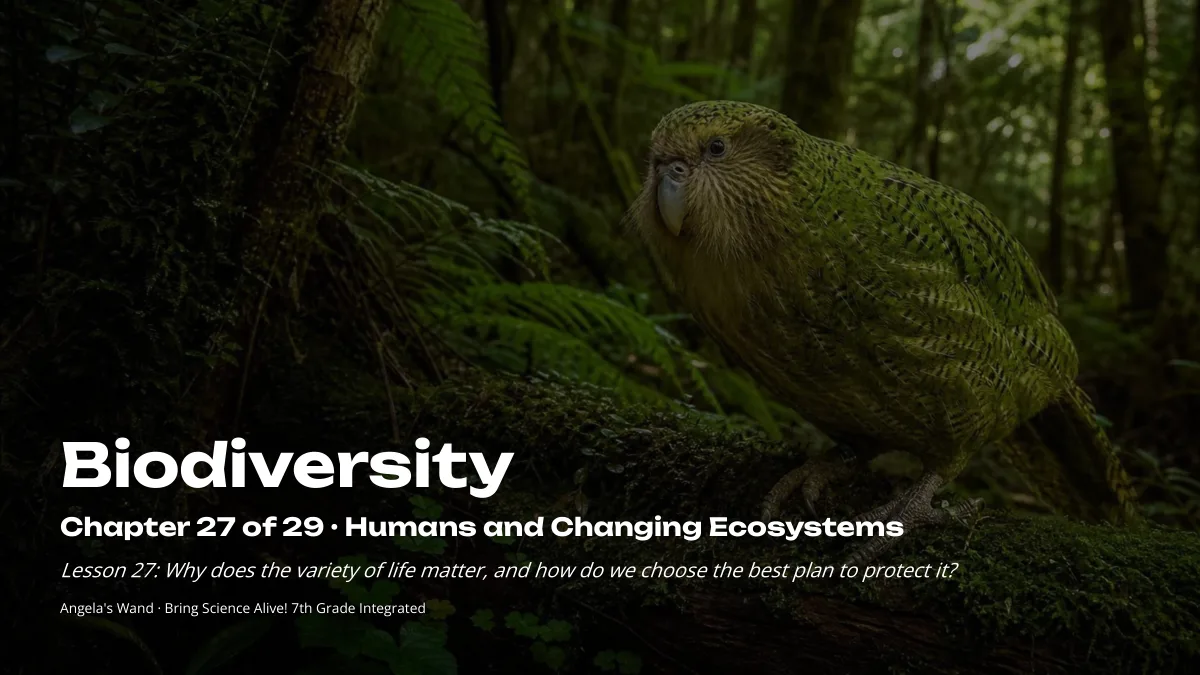
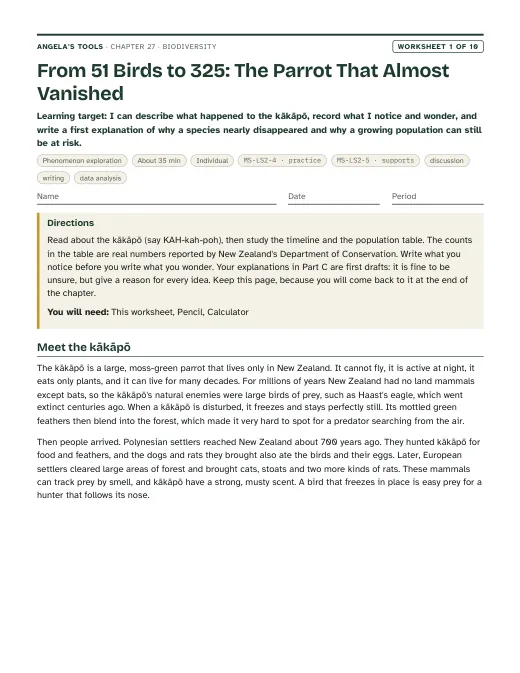
The kākāpō is a heavy, flightless parrot that feeds at night and lives only in New Zealand. Hunting, forest clearing, and the cats, rats and stoats that people brought to New Zealand nearly wiped it out: in 1995 only 51 birds were known to be alive. Rangers moved every known bird to offshore islands, cleared those islands of predators, watched over each nest and gave breeding females extra food. On 1 September 2026 New Zealand's Department of Conservation announced an official count of 325, after a record 90 chicks survived from a single breeding season.

Notice and wonder prompts

  • What was different for the kākāpō on the islands compared with the mainland?
  • Why could a flightless parrot thrive in New Zealand before people arrived, yet struggle once cats and rats came?
  • If the kākāpō disappeared, which other living things, and which people, might notice?
  • With 325 birds on only a few safe islands, what should happen next, and who should decide?

Learning targets

  • I can describe biodiversity at the level of genes, species and ecosystems, and measure it in a sample using species richness and a simple diversity index.
  • I can explain why each ecosystem has its own natural level of biodiversity and why a low-biodiversity ecosystem such as the Arctic tundra tends to be fragile.
  • I can use evidence to explain how the loss of a keystone species or another population changes many other populations, and tell extirpation from extinction.
  • I can explain how specialized niches let many species share a rainforest, and give examples of how people depend on biodiversity for medicines, materials, food and other ecosystem services.
  • I can evaluate competing plans for protecting biodiversity and ecosystem services against criteria and scientific, economic and social constraints, and combine the strongest features of several plans into a better one.

What shows the learning happened

  • A Lab 1 data table and calculation giving species richness and Simpson's index for two schoolyard patches, a species-accumulation graph, and a sentence judging whether enough quadrats were sampled.
  • A Lab 2 causal-chain diagram and suspect table explaining, with numbers from both coves, why one kelp forest collapsed, ruling out at least one competing explanation with timing or comparison evidence.
  • A Lab 3 criteria-and-constraints table for three single plans, a hybrid plan built from named features of at least two of them, and a written justification that cites the projection data, the budget and community support and names one uncertainty; the kākāpō habitat task (slide 23) applies the same pass-or-fail comparison to three options and states the trade-off accepted.
  • A W9 salt-pond plan for a San Francisco Bay shoreline that opens ponds meeting all four limits (build cost, yearly upkeep, waterbirds kept and acres of tidal marsh, each calculated), with a recommendation that compares it with Designs A and B, names the marsh animals, waterbirds and ecosystem services it maintains, states the trade-off accepted and says what to monitor before opening more ponds.
  • A written explanation (slide 11 follow-up or exit ticket) of why a low-biodiversity ecosystem such as the Arctic tundra tends to be fragile, using a specific feeding link.
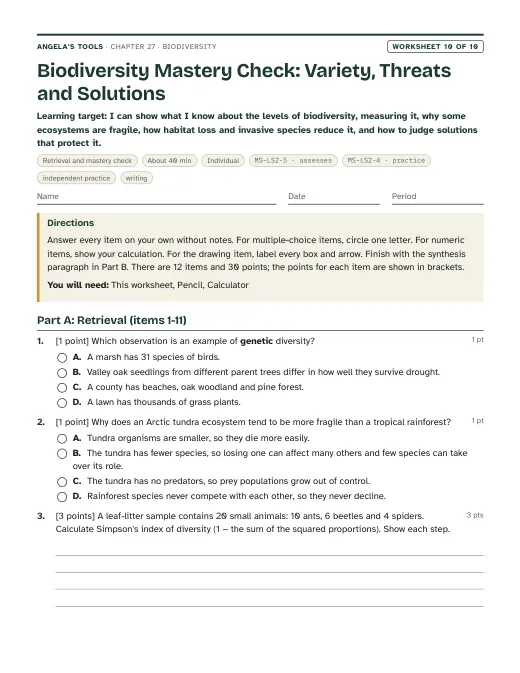
  • A W10 mastery quiz completed alone (12 items, 30 points): a Simpson's index calculation, extirpation, extinction and keystone items with new cases (practiced earlier on the slide 15 check and in W2), a model of the Argentine ant's indirect effect on horned lizards, and a synthesis paragraph that explains a threat's effect at two levels of biodiversity and judges two competing solutions with a named criterion, constraint and trade-off.

Key vocabulary 12 terms

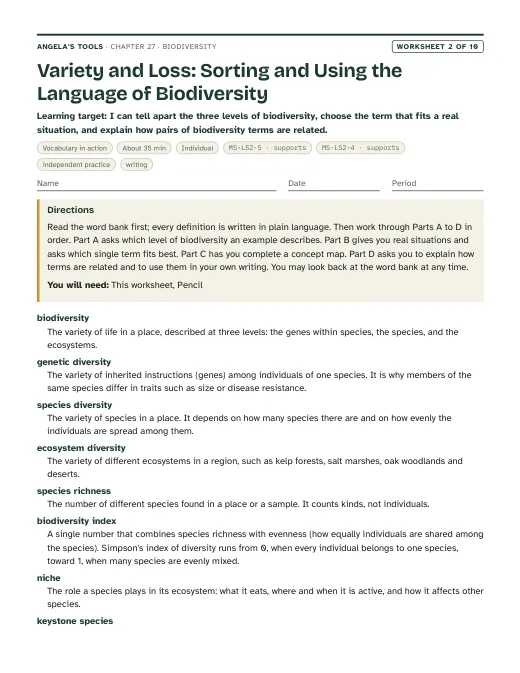
biodiversityThe variety of life in a place, counted at three levels: the genetic differences within a species, the number and mix of species, and the variety of ecosystems. Most comparisons in this chapter are at the species level.Every kākāpō alive today descends from a few dozen founding birds, so the species has little genetic biodiversity even though its numbers are growing.
species richnessThe number of different species (or, in a quick survey, different recognizable kinds) found in a place or a sample, no matter how many individuals of each there are.Our three quadrats in the unmowed strip had a species richness of seven plant kinds; the mowed lawn had three.
biodiversity indexA single number that combines richness with evenness, which is how equally the individuals are shared among the species. Simpson's index of diversity runs from 0, when every individual belongs to one species, toward 1, when many species are evenly mixed.Both patches held four kinds of plants, but the patch where one grass made up nearly every point had a far lower biodiversity index.
proportionThe size of a part compared with the whole it belongs to, written as a fraction, a decimal or a percentage.Insects make up a proportion of roughly one half of all named species, so about 1 million of the 2 million or so species scientists have described.
nicheThe role a species plays in its ecosystem: what it eats, where and when it finds food and shelter, and how it affects the other species around it.The lesser anteater's niche, tearing open ant and termite nests and lapping up the insects, barely overlaps with the niche of a fruit-eating monkey in the same trees.
keystone speciesA species whose effect on its ecosystem is far larger than its numbers would suggest, so that removing it changes many other populations.Sea otters act as a keystone species: a fairly small number of otters can keep urchins scarce enough for a whole kelp forest to stand.
extirpationThe loss of every member of a species from one area while the species survives somewhere else; a local extinction that can sometimes be reversed if the species returns.Fur hunting caused the extirpation of sea otters from the Oregon and Washington coasts, but otters survived in Alaska and in a small group near Big Sur.
extinctionThe death of the last member of a species anywhere on Earth. An extinct species is gone for good.The extinction of the gastric brooding frogs, last seen in the 1980s, took with it everything their way of raising young inside the stomach could have taught us.
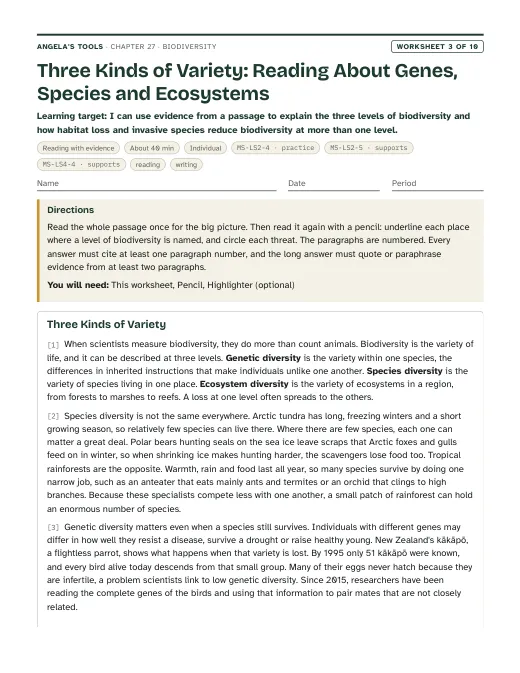
invasive speciesA species that people carried to a place outside its native range, where it spreads and harms native species, ecosystems or people.Stoats are an invasive species in New Zealand, where they hunt native birds that evolved with no ground-hunting mammals around.
ecosystem servicesThe benefits people get from ecosystems, such as clean water, pollinated crops, fish and shellfish to harvest, soil held in place, and places to enjoy.A healthy kelp forest provides ecosystem services: shelter for young fish that people later catch, food for abalone, and dive sites that bring visitors to the coast.
biomimicrySolving a design problem by copying a structure or process that evolved in a living thing.Copying the microscopic pillars on a gecko's toe pads to make a reusable adhesive is an example of biomimicry.
criteria and constraintsCriteria are what a design must achieve to count as a success. Constraints are the limits it has to work within, such as cost, time, laws and what the community will accept.The kelp plan met the criterion of 25 percent kelp cover by year 5, but it broke the budget constraint by one point.

Standards alignment

California NGSS, Grade 7 Preferred Integrated Course Model. Each entry says whether this chapter's work assesses the performance expectation, gives practice toward it, or supports it as background; the resource lists below repeat this for every worksheet and lab.

MS-LS2-5Assesses: evaluating competing design solutions against criteria that include biodiversity and ecosystem services, under scientific, economic and social constraintsCA Grade 7

Evaluate competing design solutions for maintaining biodiversity and ecosystem services.

In Lab 3 students judge three plans for a damaged kelp coast, and their own combinations, against criteria for kelp cover and fish species and constraints of budget and community support, weighing the abalone fishery as an ecosystem service; the presentation task does the same for kākāpō habitat. W8 (five real island fox solutions), W9 (a salt-pond shoreline plan judged on marsh species, waterbirds and ecosystem services) and W10 items 10 and 12 also ask students to evaluate competing solutions. All produce direct evidence toward this Grade 7 PE.

MS-LS2-4Practice toward: constructing an argument from evidence that a change to a physical or biological component affects populationsCA Grade 7

Construct an argument supported by empirical evidence that changes to physical or biological components of an ecosystem affect populations.

Students argue from their own quadrat data that mowing changes which plants grow (Lab 1) and from survey data that losing urchin predators changed many populations in one kelp cove (Lab 2). Lab 1's evidence is empirical but small and confounded, and Lab 2's is simulated, so the chapter builds this Grade 7 practice rather than assessing the full PE.

MS-ETS1-3Practice toward: analyzing test data from several solutions to combine their best characteristicsCA Grade 6-8

Analyze data from tests to determine similarities and differences among several design solutions to identify the best characteristics of each that can be combined into a new solution to better meet the criteria for success.

The lesson's engineering spread combines a gecko-inspired texture with a mussel-inspired glue after testing each one. Students analyze that test story (slide 21) and, in Lab 3, use pilot data to pick the best characteristic of each single plan and combine them into a hybrid, then check it against the criteria; W9 q4 asks how a half-marsh, half-pond design borrows the best feature of two designs that each fail.

MS-ETS1-2Practice toward: using a systematic criteria-and-constraints table to evaluate competing solutionsCA Grade 6-8

Evaluate competing design solutions using a systematic process to determine how well they meet the criteria and constraints of the problem.

Lab 3, W9 and the presentation task use a pass-or-fail table for every criterion and constraint so that plans are compared the same way. The evaluation method is supplied rather than built by students, so this is practice toward the PE.

Science and engineering practices

  • Planning and Carrying Out Investigations. In Lab 1 students place quadrats by dice roll rather than by choice, record the first plant touched at 25 fixed points, and use a species-accumulation graph to decide whether they sampled enough.
  • Analyzing and Interpreting Data. Students compute species richness and Simpson's index (Lab 1), compare two coves' species and population data across six years (Lab 2), and read projected pilot data for competing plans (Lab 3).
  • Using Mathematics and Computational Thinking. Proportions (what share of named species are insects), Simpson's index as one minus the sum of squared proportions, percent change in richness, and plan budgets.
  • Engaging in Argument from Evidence. Students rule competing explanations in or out for a kelp collapse (Lab 2) and defend a conservation plan against agreed criteria and constraints, naming the trade-off they accept (Lab 3, presentation task and discussions).

Disciplinary core ideas

  • LS2.C Ecosystem Dynamics, Functioning, and Resilience. Biodiversity describes the variety of species on land and in the ocean, and how complete an ecosystem's natural set of species remains is used as a gauge of how healthy it is. A small change in one part, such as losing sea ice or sea otters, can cause large changes in other parts, especially where biodiversity is low.
  • LS4.D Biodiversity and Humans. Changes in biodiversity affect the resources people use, from medicines such as vincristine to food such as abalone, and the ecosystem services that kelp forests and other ecosystems provide.
  • ETS1.B Developing Possible Solutions. Plans for protecting biodiversity are evaluated systematically against criteria and constraints, using pilot or test results (Lab 3, slides 20 and 23).
  • ETS1.C Optimizing the Design Solution. No single kelp plan or adhesive meets every criterion; the characteristics that performed best in each test are combined into a better solution (slide 21, Lab 3).

Crosscutting concepts

  • Stability and Change. A minor change in one piece of a system, such as earlier sea-ice breakup or the loss of an urchin predator, can cause large changes elsewhere; low-biodiversity systems are easier to destabilize.
  • Cause and Effect. Students trace multi-step causal chains (otters, urchins, kelp, kelp-dwelling species) and separate a real cause from a coincidence by comparing two sites.
  • Patterns. Biodiversity rises toward warm, wet tropics on land and warm, sunlit shallows in the sea; a species-accumulation curve levels off as a sample captures most of a patch's kinds.
  • Influence of Science, Engineering, and Technology on Society and the Natural World. Biomimicry turns traits of geckos and mussels into an adhesive, and conservation choices show that science can describe the trade-offs while communities decide what to accept.

Presentation 27 slides

Biodiversity: why the variety of life matters, and how to choose a plan that protects it. Original, editable slides with speaker notes: a phenomenon opener, learning targets, the chapter's concepts with diagrams, vocabulary in context, 3 checks for understanding, 2 discussion prompts, an application task, a misconception check, a synthesis and an exit ticket.

Worksheets 10 of 10

Ten different tasks, one per instructional blueprint. Each has a student PDF (low ink, US Letter), an editable DOCX, an HTML preview, and a separate teacher answer key with reasoning.

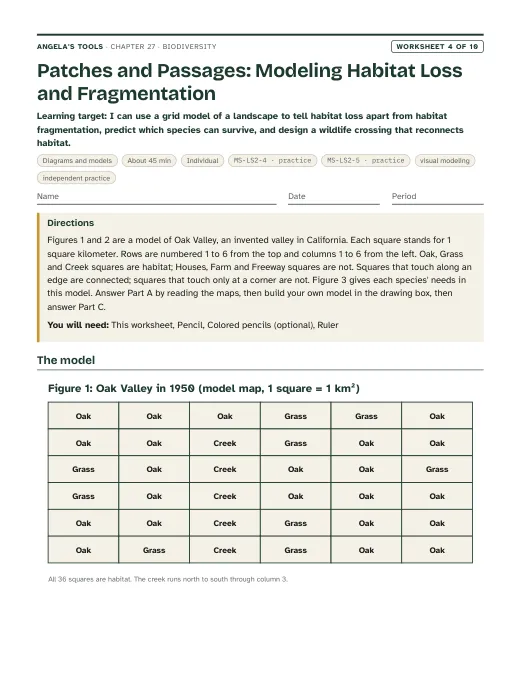
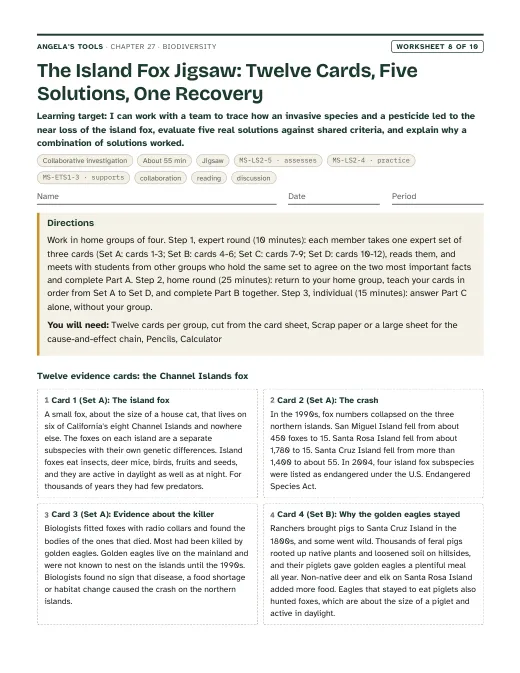
First page of The Island Fox Jigsaw: Twelve Cards, Five Solutions, One Recovery
Worksheet 8 · Collaborative investigation

The Island Fox Jigsaw: Twelve Cards, Five Solutions, One Recovery

I can work with a team to trace how an invasive species and a pesticide led to the near loss of the island fox, evaluate five real solutions against shared criteria, and explain why a combination of solutions worked.

55 minjigsawPracticeCollaborationReadingDiscussion MS-LS2-5 · assessesMS-LS2-4 · practiceMS-ETS1-3 · supports
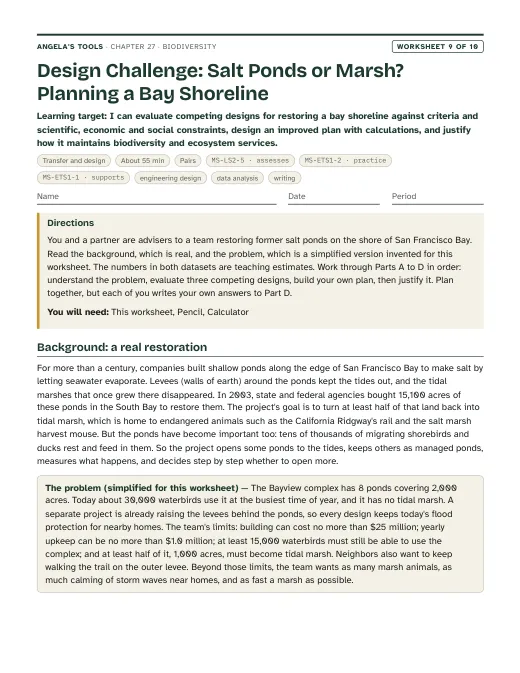
First page of Design Challenge: Salt Ponds or Marsh? Planning a Bay Shoreline
Worksheet 9 · Transfer and design

Design Challenge: Salt Ponds or Marsh? Planning a Bay Shoreline

I can evaluate competing designs for restoring a bay shoreline against criteria and scientific, economic and social constraints, design an improved plan with calculations, and justify how it maintains biodiversity and ecosystem services.

55 minpairsExtensionEngineering designData analysisWriting MS-LS2-5 · assessesMS-ETS1-2 · practiceMS-ETS1-1 · supports

Collaborative labs 3 of 3

Three different investigation approaches. Each has a teacher guide (purpose, materials with quantities, estimated cost, prep, safety, procedure, expected observations, debrief, answer key, assessment criteria, accessibility adaptations, low-cost alternative) and a student recording sheet.

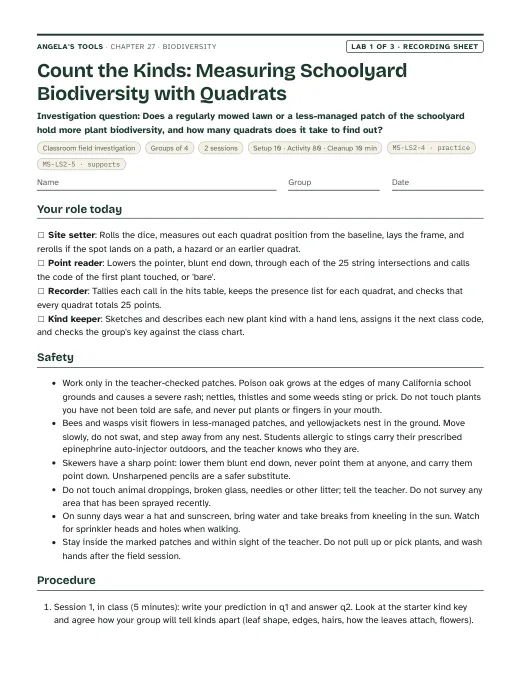
First page of the Count the Kinds: Measuring Schoolyard Biodiversity with Quadrats recording sheet
Lab 1 · Classroom field investigation

Count the Kinds: Measuring Schoolyard Biodiversity with Quadrats

Does a regularly mowed lawn or a less-managed patch of the schoolyard hold more plant biodiversity, and how many quadrats does it take to find out?

Groups of 42 sessions80 min activityEst. 5 to 50 per classQuadrat frame, 50 cm by 50 cm inside: four 50 cm lengths of half-inch PVC pipe with four elbow joints, or a frame cut from a cardboard boxCotton string or yarn for the 5 by 5 gridWooden barbecue skewers (blunt end used as the pointer) or unsharpened pencils MS-LS2-4 · practiceMS-LS2-5 · supports
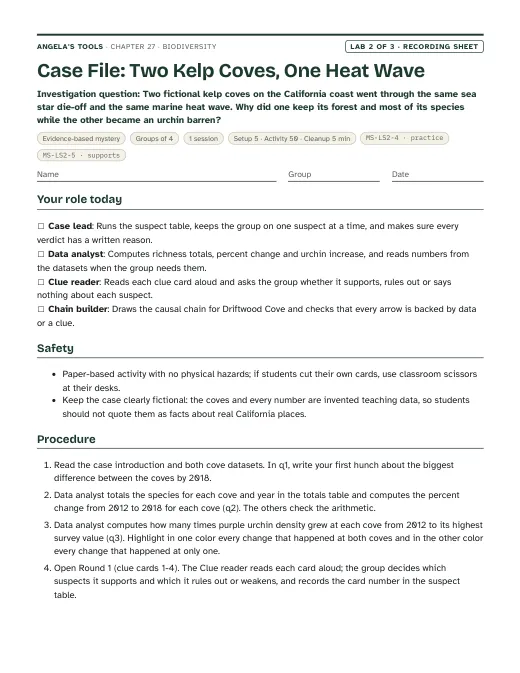
First page of the Case File: Two Kelp Coves, One Heat Wave recording sheet
Lab 2 · Evidence-based mystery

Case File: Two Kelp Coves, One Heat Wave

Two fictional kelp coves on the California coast went through the same sea star die-off and the same marine heat wave. Why did one keep its forest and most of its species while the other became an urchin barren?

Groups of 41 session50 min activityEst. 2 to 5 per classCase file (the recording sheet with both coves' datasets and the suspect table)Clue cards 1 to 8, printed and cut, in two envelopes (Round 1: cards 1-4; Round 2: cards 5-8)Highlighters in two colors MS-LS2-4 · practiceMS-LS2-5 · supports
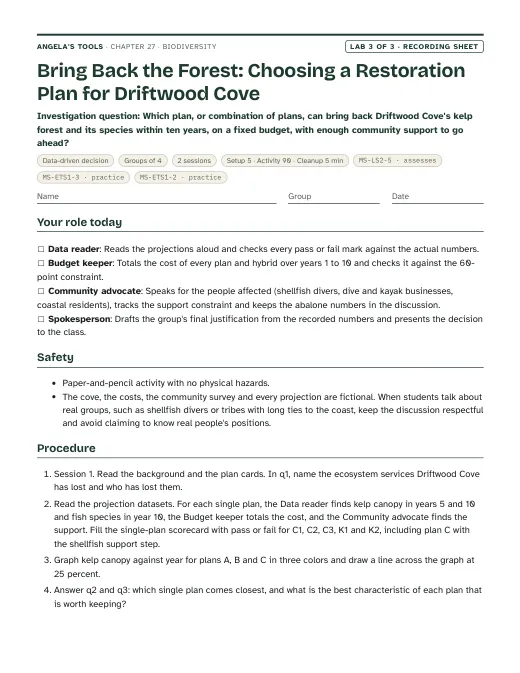
First page of the Bring Back the Forest: Choosing a Restoration Plan for Driftwood Cove recording sheet
Lab 3 · Data-driven decision

Bring Back the Forest: Choosing a Restoration Plan for Driftwood Cove

Which plan, or combination of plans, can bring back Driftwood Cove's kelp forest and its species within ten years, on a fixed budget, with enough community support to go ahead?

Groups of 42 sessions90 min activityEst. 2 to 4 per classRecording sheet with the background, plan cards, projection datasets and scorecardsHybrid results card, printed separately and handed out after each group commits to a designCalculator MS-LS2-5 · assessesMS-ETS1-3 · practiceMS-ETS1-2 · practice

Teacher guidance

Suggested sequence (8 steps)
  1. Period 1: Presentation slides 1-9 (the kākāpō phenomenon, targets, what biodiversity means, the named-species bar graph, richness and evenness, natural levels, the tundra-rainforest comparison, first check). W1 phenomenon worksheet as the opener.
  2. Period 2: Lab 1 session 1, Count the Kinds: groups mark out quadrats by dice roll in a mowed lawn and a less-managed patch, build a kind key and record 25 point-intercept hits per quadrat.
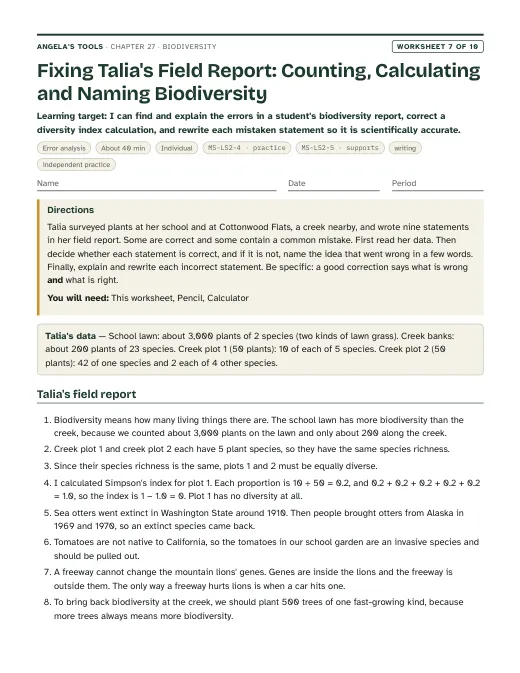
  3. Period 3: Lab 1 session 2: pool class data, calculate richness and Simpson's index, graph the species-accumulation curve and answer the analysis questions. W7 misconception (fixing a field report) pairs with the calculations. Slides 10-11 (fragile tundra and the sea-ice chain). W2 vocabulary for homework.
  4. Period 4: Slides 12-18 (the sea otter keystone, its causal chain, vocabulary, the extirpation-or-extinction check, rainforest niches, the 'is more always healthier?' discussion, people depend on biodiversity). W3 reading on the three levels of biodiversity, habitat loss and invasive species.
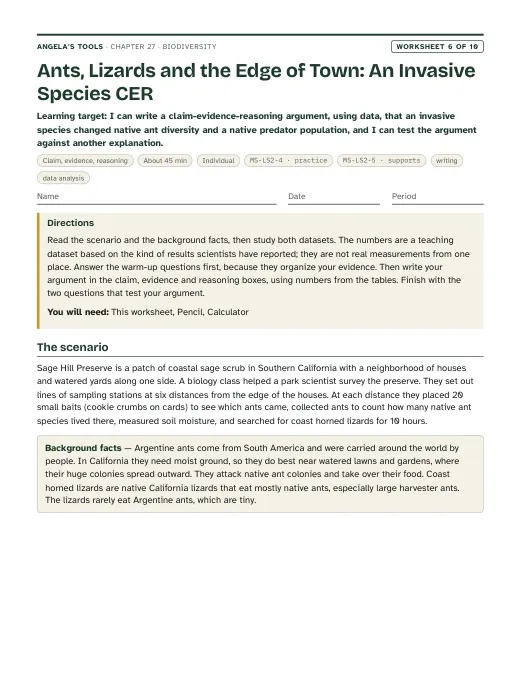
  5. Period 5: Lab 2, Case File: Two Kelp Coves: groups compare two coves' survey data, test five suspects against clue cards and draw the causal chain. W6 CER (an invasive species and native ants) can follow as homework.
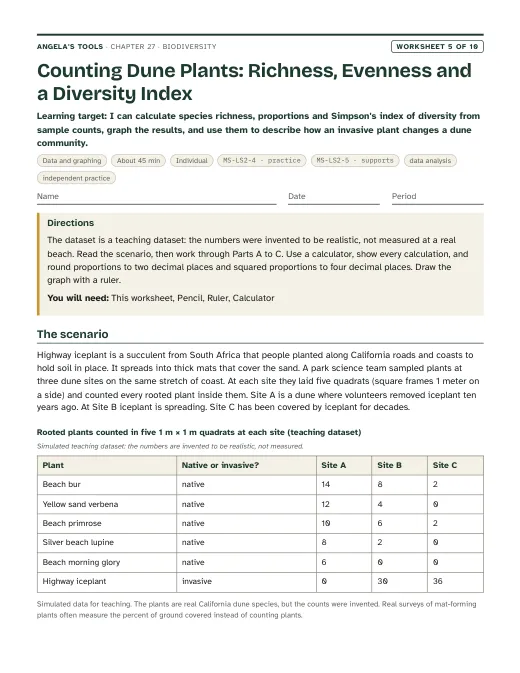
  6. Period 6: Slides 19-21 (California condors, otters and abalone; judging a plan; the gecko-and-mussel adhesive). W4 diagram (habitat loss and fragmentation) and W5 data (richness, evenness and a diversity index), in class or as homework.
  7. Period 7: Slides 22-24 (the otter return discussion, the kākāpō habitat task, combining plans check). Lab 3 session 1, Bring Back the Forest: score the single plans and design a hybrid.
  8. Period 8: Lab 3 session 2: read the hybrid results card, decide and justify. Slides 25-27 (misconception, synthesis, exit). W8 collaborative (the island fox jigsaw: twelve evidence cards, a cause-and-effect chain and five real solutions scored against shared criteria) and W9 transfer (the salt-pond design challenge: check three San Francisco Bay shoreline designs against cost, upkeep, waterbird and marsh limits, then build and justify a pond-by-pond plan) each need about 55 minutes; run them in an added period after Lab 3, or use W9 as pair work in place of one presentation period. W10 mastery (12 items, 30 points, ending in a synthesis paragraph that judges two solutions to one threat) is the individual quiz in the next class. Preview Lesson 28, where ecosystem services are given a price.

Materials overview: Lab 1 needs quadrat frames (cardboard or PVC, 50 cm square), string for a 5 by 5 grid, a blunt skewer or pencil for point readings, dice, clipboards, hand lenses and a site the teacher has checked for hazards. Labs 2 and 3 are paper only: printed case files, clue cards, data tables, a calculator and colored pencils. The presentation needs only the slides; a photo of a kākāpō and of an urchin barren help.

Common misconceptions (7)
“More species always means a healthier ecosystem.”
Why it happens: Students hear that biodiversity is good and that rainforests are rich, so they treat a bigger species count as a better score everywhere.
Correction: An ecosystem is judged against its own natural set of species. A healthy tundra has few species; a roadside strip can gain species by filling with invasive weeds while losing natives. What matters is whether the species that belong there, and their roles, are still present.
“Biodiversity just means the number of species.”
Why it happens: The lesson and most news stories count species, and richness is the easiest number to collect.
Correction: Biodiversity also includes how evenly individuals are spread among species, the genetic variety within each species and the variety of ecosystems. Two patches with the same four plants can differ greatly in diversity if one plant covers almost everything; the kākāpō's low genetic diversity is a problem even as its numbers rise.
“A keystone species is the most common, biggest or most important-looking species in an ecosystem.”
Why it happens: 'Key' sounds like 'main', and students picture the dominant tree or the largest animal.
Correction: A keystone species has an effect out of proportion to its abundance. Sea otters are far less abundant than urchins or kelp, yet removing them changes the whole forest. A very abundant species, like the kelp itself, is better described as a foundation species.
“Extirpation and extinction are the same thing.”
Why it happens: Both describe a species disappearing, and 'gone from here' feels like 'gone'.
Correction: Extirpation is loss from one area while the species lives elsewhere, and it can be reversed: sea otters taken from Alaska were released in Washington in 1969 and 1970, decades after the state's last native otter was killed. Extinction is the loss of the last individual anywhere and cannot be undone.
“Once an endangered species' numbers are rising, the problem is solved and protection can stop.”
Why it happens: Comeback stories end with a big number, and growth looks self-sustaining.
Correction: Many recoveries depend on continuing work. Lead poisoning is still the leading known cause of death for wild California condors, and kākāpō survive only where cats, rats and stoats are kept out. Recovery means the population can persist when the threats are under control, not just that the count went up.
“Polar bears hibernate through the Arctic winter.”
Why it happens: Many bears hibernate, and the textbook itself says polar bears do.
Correction: Most polar bears stay active all winter and hunt seals from the sea ice, which is why ice loss matters so much. Only pregnant females den for the winter, to give birth.
“There is one correct conservation plan, and science can tell us which it is.”
Why it happens: Science class usually has right answers, and students expect the data to pick the winner.
Correction: Science shows what each plan is likely to do and how sure we are. Choosing among plans also involves cost, fairness and what people value, so two well-reasoned groups can choose differently. The best plans are often combinations, revised as monitoring data come in.
Differentiation suggestions (5)
  • Multilingual learners: Pre-teach richness, evenness, keystone, extirpation and extinction with picture cards (an arch with its keystone, an empty map region versus an empty world). Give sentence frames: 'This plan meets ___ because ___, but it misses ___ by ___.' and 'Without ___, the ___ population ___, so ___.' Let students keep their Lab 1 kind key in their home language.
  • Students who need more support: In Lab 1, supply a kind key with the three most common lawn plants already drawn and a Simpson's table with p and p² columns set up. In Lab 2, release clue cards two at a time with a 'supports / rules out / no effect' prompt on each. In Lab 3, give the single-plan scorecard with plan A already completed as a model.
  • Students ready for extension: Have them compare Simpson's index with species richness for the class data and explain when the two rank patches differently; read about why sunflower sea stars are being raised in captivity and list what would need testing before release; or redesign the Lab 3 hybrid to treat only part of the cove and estimate the savings.
  • Students who need movement or alternative output: Lab 1 is outdoors; give these students the Site setter role (pacing out the dice-roll positions). Act out the tundra chain as a human web in which the 'sea ice' student steps away. Accept an annotated photo of a quadrat as the kind key and a recorded spoken justification for the Lab 3 decision.
  • Students with mobility, allergy or sensory needs: Choose quadrat sites on flat ground next to a path; let students who cannot kneel do the point readings from a stool or record while a partner reads. Students with grass or pollen allergies can do the kind key from photos and the calculations indoors. Offer large-print case files in Lab 2.
Accuracy notes: where the textbook simplifies (17)
  • Kākāpō numbers: the textbook's phenomenon says only 18 kākāpō were alive in the 1970s and about 160 now. In the 1970s searchers found 18 birds in Fiordland, all of them males; in 1977 a larger group, estimated at roughly 100 to 200 birds, was found on Rakiura/Stewart Island, where females were confirmed in 1980 and feral cats were killing many birds. Between 1980 and 1997 all known birds were moved to offshore island sanctuaries, from which cats and rats were then removed. The lowest count was 51 birds in 1995. DOC reported 242 birds on 30 June 2025 and an official count of 325 on 1 September 2026, after a record 90 chicks from the 2026 season. Teach the 1995 low and the 2026 count, and say the textbook's numbers are out of date.
  • Biodiversity has three levels: the textbook defines it as the variety of organisms (pp. 359-360). The usual scientific definition, used in the Convention on Biological Diversity, includes variety within species (genetic), between species and among ecosystems. This chapter says which level is being compared, usually species.
  • Health is judged against the natural set: the lesson's standard box says the completeness or integrity of biodiversity indicates health (p. 359). This means having the species that belong there, not simply the most species. A higher count can come from invasive species, so the chapter never treats richness alone as a health score.
  • Species counts are dated: about 1.9 million identified species (p. 361) reflects older catalogs; the Catalogue of Life now lists well over 2 million. Figure 1 labels insects 50 percent while the text says 52 percent; with 52 the wedges sum to 100, so slide 5 uses 52 percent and calls all the shares approximate.
  • Polar bears do not hibernate: Section 2 (p. 362) lists them with hibernating animals. Only pregnant females den; other polar bears hunt seals on the sea ice through the winter.
  • Scavengers and seals: the textbook says the foxes and gulls that eat polar bear leftovers cannot hunt seals themselves and that no other species fills the polar bear's niche (p. 363). Arctic foxes do tunnel into ringed seal birth lairs and kill pups. The chapter calls polar bears the chief hunters of grown seals on the sea ice.
  • Fragility is a tendency, not a law: low biodiversity tends to make an ecosystem easier to disrupt (p. 363), but high biodiversity is no guarantee. Coral reefs, among the richest ecosystems, are badly damaged by marine heat waves that cause bleaching.
  • Sea otters live in more than kelp forests: Section 3 (p. 364) calls the sea otter a species found only in kelp forests. Sea otters also live in estuaries such as Elkhorn Slough, seagrass beds and soft-bottomed coastal waters.
  • California's otters were not fully extirpated: the fur trade wiped sea otters out along most of the Pacific coast, and the textbook says many kelp forests lost all their otters (p. 365). In California a remnant colony of about 50 survived on the Big Sur coast, and today's southern sea otters descend from it. Washington's otters come from 59 animals moved from Alaska in 1969 and 1970.
  • Kelp recovery is not automatic: the textbook says the forest will die without otters (p. 364) and that kelp recovered where otters returned (p. 365). Other predators, especially sunflower sea stars, also eat urchins, and how strongly otters affect kelp depends on how many there are, how long they stay and local conditions. North of San Francisco, where there are no otters, a sea star wasting disease from 2013 and a marine heat wave from 2014 to 2016 were followed by an urchin explosion and the loss of more than 90 percent of bull kelp canopy along more than 350 km of coast (Rogers-Bennett and Catton 2019).
  • Keystone species definition: the textbook defines a keystone species simply by its effect on a whole ecosystem's diversity (pp. 359, 365). The defining feature is an effect far larger than the species' abundance would suggest; the chapter teaches that version and uses the arch only as an analogy.
  • Medicines: Section 5 (p. 370) says the chemical in willow bark is what makes aspirin work and that foxglove prevents heart failure. Willow bark contains salicin, which led chemists to aspirin (acetylsalicylic acid), a lab-made compound. Purple foxglove is the source of digitoxin and its relative woolly foxglove of digoxin; these drugs treat some heart rhythm problems and ease heart-failure symptoms rather than prevent heart failure. Madagascar periwinkle comes from eastern and southern Madagascar, mainly seasonally dry habitats rather than rainforest; its alkaloids vinblastine and vincristine are used against several cancers, including childhood leukemia.
  • Gastric brooding frogs: the textbook dates the discovery to the 1970s (p. 371). The southern gastric brooding frog was found in Queensland in the early 1970s and had vanished from the wild by the early 1980s; a second, northern species found in 1984 disappeared within about a year. The cause is uncertain. The chapter says only that they disappeared within about a decade of being discovered.
  • The bandage was a lab prototype: Section 6 (pp. 372-373) presents the gecko-and-mussel bandage as a finished design that meets all criteria. The research it describes (Lee, Lee and Messersmith, 2007) produced a lab adhesive, an array of tiny pillars coated with a mussel-like polymer, that held and released reliably in wet and dry tests. Using it on patients would need further testing.
  • Rainforest numbers are not used: Section 4 (p. 366) gives figures such as nearly 1,000 beetle species on one tree and 650 kinds of trees in a small patch. These are rounded or hard to verify, so the chapter says only that a small patch can hold hundreds of tree species.
  • Coral reefs and nutrients: the Key Science Concept (p. 369) credits high marine biodiversity to abundant nutrients and light, naming coral reefs. Reef-building corals grow best in clear, nutrient-poor water; their richness comes from warm, sunlit shallows. The chapter credits reefs to warmth and light only.
  • California facts used in the chapter: condors fell to 22 birds in 1982, and the last wild bird was captured in 1987, leaving 27 in captivity; releases began in 1992 and the U.S. Fish and Wildlife Service counted 607 condors at the end of 2025, 392 of them flying free. The last published range-wide southern sea otter index (2019) was 2,962; the species has been listed as threatened since 1977. White abalone have declined about 99 percent since the 1970s, became in 2001 the first marine invertebrate listed as endangered under the federal Endangered Species Act, and have been released from captive breeding since 2019. The north coast recreational red abalone fishery closed in 2018 after the kelp collapse, and in December 2025 the Fish and Game Commission extended the closure to 1 April 2036.

Review status: reviewed · 2026-10-19 · Re-solved every numeric, multiple-choice, true/false, fill and table item in W1-W10 and Labs 1-3 by hand and by script: W5 Simpson's indexes 0.784, 0.592, 0.185 and native-only 0.70 (extension 0.224 and 0.380); W7 0.80 and 0.288; Lab 1 q5 0.66 and 0.14; W10 q3 0.62 and q8 537 percent; W4 patches 6, 3 and 9, only row 3 column 3 joins two patches (15 squares, 19 with the restored farms); W9 has 19 feasible pond plans, all opening exactly 4 ponds; Lab 2 totals and percent changes; every Lab 3 cost and pass-or-fail mark. All keys agreed. Verified against sources on 2026-10-19: kākāpō 51 birds (20 female) in 1995, 242 on 30 June 2025, 325 on 1 September 2026 with 90 chicks counted at 150 days (DOC); condors 607 and 392 free-flying at the end of 2025 (USFWS); southern sea otter 2019 index 2,962, the last published range-wide index found; white abalone 99 percent decline, 2001 listing, first outplant November 2019 (NOAA); red abalone closure extended on 18 December 2025 to 1 April 2036 (CDFW); island fox lows (450 to 15, 1,780 to 15, more than 1,400 to 55), 226 released, 2015 counts and the 2016 delisting (Interior); 2022 sea otter feasibility report took no position but recommended stakeholder engagement and small trials (USFWS). Liberty Canyon crossing: student text says it is scheduled to open in late 2026 (the announced date is 2 December 2026); W3, W4 and W10 teacher notes now tell teachers to check whether it has opened rather than asserting it has, and W10 q7's alternative was reworded to match. W4 Figure 3: the grasshopper sparrow rule now says the 4 Grass squares must lie in one connected habitat patch but need not touch, which is the reading the key uses (in 1950 the 9 Grass squares are scattered within the single 36-square patch). W1 count caption: the 90 chicks are the ones DOC added once the youngest surviving chick reached 150 days, so q4's inference that about 7 existing birds died holds. W8 q8 key no longer dates the fox low to 1999, which Card 2 does not say. Lab 3 results card: H6 support changed from 50 to 55 percent to match the plan card's rule that the support step raises an otter plan to 55 percent; no pass-or-fail mark changes. Cross-references corrected: slides 8, 11, 13, 16, 18, 19, 20, 21, 22, 23 and 25 now name what W1, W3, W4, W6, W8, W9 and W10 actually contain (W4 habitat fragmentation, W6 Argentine ants, W8 island fox, W9 salt-pond design); chapter.json sequence and evidenceOfLearning now describe W9 and W10 as written, and the MS-LS2-5, MS-ETS1-2 and MS-ETS1-3 notes name W8, W9 and W10 where they apply. Originality: no 6-word run shared with the lesson text in any file (scripted check); standards codes and caGrade checked in all 15 files; MS-LS4-4 on W3 stays supports with its Grade 8 note. Authoring notes retained: textbook corrections follow L27 reviewFlags RF1-RF15; labs not physically tested; W4-W6, W9, Lab 2 and Lab 3 data simulated and labeled.

Source references

Verified against the student edition of Bring Science Alive! 7th Grade Integrated (Student Edition). Printed page numbers appear in the book; PDF pages are the physical pages of the 524-page scan (printed + 36). The textbook is not reproduced on this site.

SectionPrinted pagesPDF pagesUsed for
Introduction: lesson question, vocabulary and the standards box358, 359394, 395Lesson question, vocabulary list (biodiversity, proportion, niche, extirpation, keystone species, extinction) and the listed standards, including the integrity-of-biodiversity idea.
1. The Importance of Biodiversity360, 361396, 397Natural levels of biodiversity, named-species counts, the proportion worked example and the circle graph of species groups (slides 4-6, accuracy notes on dated counts).
2. Fragile Tundra Ecosystems362, 363398, 399Polar bears, seals and scavengers; sea-ice loss; fragility of low-biodiversity ecosystems (slides 8, 10, 11; hibernation and scavenger corrections).
3. Keystone Species in the Kelp Forest364, 365400, 401Sea otters, urchins and kelp; extirpation; keystone species and the arch analogy (slides 12-15, Lab 2, Lab 3).
4. Many Niches in Tropical Rainforests366, 367402, 403Year-round resources, specialized niches, the lesser anteater and canopy orchids (slides 8 and 16).
Key Science Concept: Biodiversity in Earth's Ecosystems368, 369404, 405Global patterns on land and in the sea, from Arctic tundra to coral reefs (slide 7).
5. Humans Benefit from Biodiversity370, 371406, 407Medicines, materials, oil-eating bacteria, the gastric brooding frogs and the meaning of extinction (slides 14, 15 and 18).
6. Engineering a Super Bandage (Engineering Design)372, 373408, 409Testing a gecko-inspired and a mussel-inspired adhesive against criteria and combining them (slides 20-21, the combining step in Lab 3).
Lesson Summary373409Check that every summary idea is covered by a learning target and a slide.

External references used for accuracy checks

Related chapters