Chapter 28 · Unit 10: Humans and Changing Ecosystems · Segment 4

The Importance of Healthy Ecosystems

What do healthy ecosystems do for people, and how should a community decide whether to protect an ecosystem or pay to replace the services it provides?

Overview

Students figure out that the clean water, fertile soil, crops and flood protection a community counts on come from the everyday work of living things: pollinators carrying pollen, decomposers rebuilding soil, forest soils filtering rain, dune plants holding sand, scavengers clearing carcasses, and wild populations storing a variety of traits. They model almond pollination with cotton swabs to see why California orchards rent honey bees, trace how a cattle drug that killed India's vultures spread to human health, build and improve a water filter and compare it with a forested watershed, and then sit as a town council deciding whether to protect an ecosystem or pay to replace what it does. The chapter turns Lesson 27's biodiversity ideas into decisions and sets up Lesson 29's engineering solutions.

Estimated class time: presentation about 137 minutes · worksheets about 435 minutes in total · labs 5 sessions. Eight 50- to 55-minute periods (nine with the optional W8 jigsaw): one for the phenomenon and the idea of ecosystem services; one for the pollination lab; one for pollination and almonds; one for bananas, vultures and coastlines; two for the New York City case and the filter design challenge; and two for the council decision lab, the closing task, synthesis and assessment.

Phenomenon

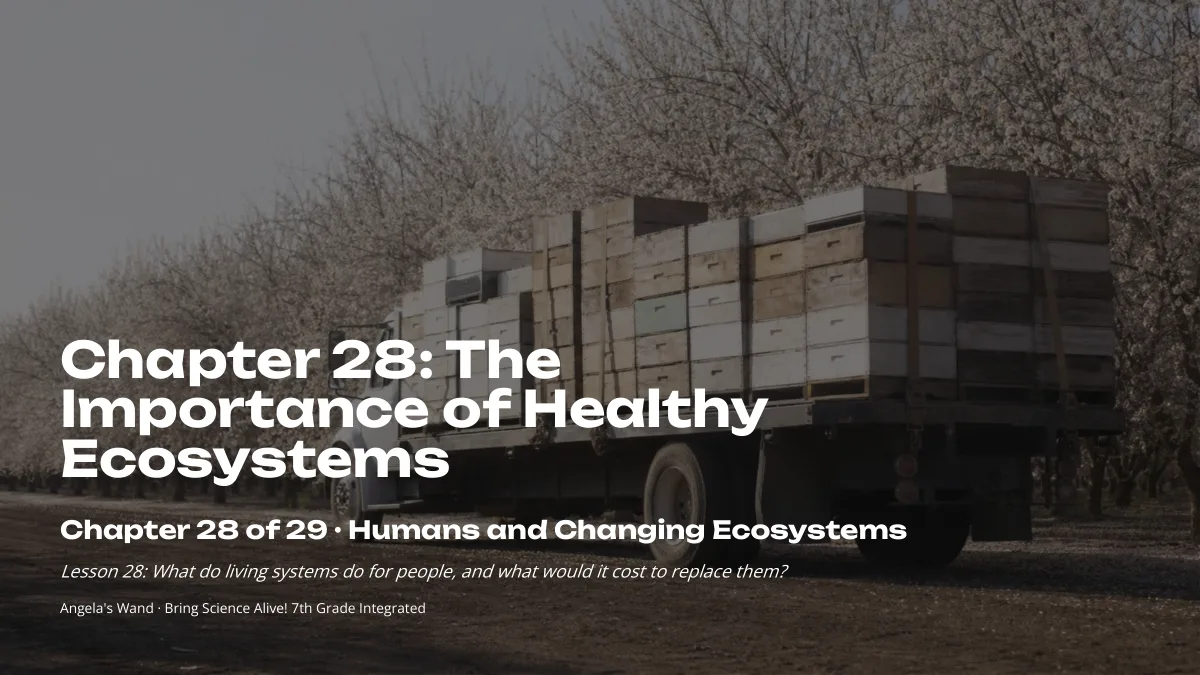
The bee trucks of February

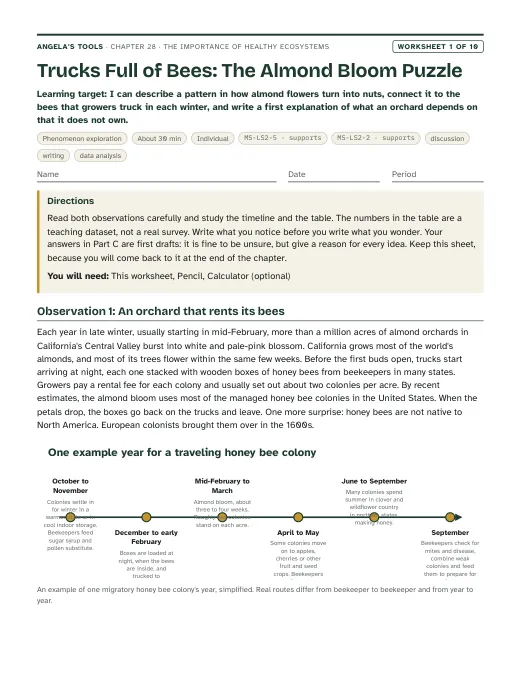
Every winter, flatbed trucks stacked with beehives roll into California's Central Valley from states as far away as Florida, Texas and North Dakota. When the almond trees bloom, usually starting in mid-February, growers rent millions of honey bee colonies; one 2025 estimate put the 2024 demand at about 2.7 million colonies, close to every managed colony counted in the United States that January. Growers pay rent for every hive, and a few weeks later the trucks drive away again. Honey bees are not even native to North America. Why would farmers pay to haul in tens of billions of insects, and what did the land do for free before orchards covered it?

Notice and wonder prompts

  • What does a bee do inside an almond blossom that the tree cannot do for itself?
  • Why might an orchard that covers thousands of acres have too few wild insects to pollinate it?
  • What would happen to the almond harvest, and to the beekeepers, in a year when many colonies died over the winter?
  • What other jobs might the land around a town be doing for people without anyone sending a bill?

Learning targets

  • I can define an ecosystem service, sort examples into kinds of services, and name the organisms and processes that produce each one.
  • I can use data from a model to explain why most almond varieties need bees to carry pollen from a different variety, and how orchard layout and the number of bee visits change the harvest.
  • I can trace how a small change in one part of an ecosystem, such as a drug that killed vultures, spread to people's health, and say what evidence would show cause rather than only a pattern.
  • I can design, test and improve a water filter against criteria and constraints, and compare it with the filtering a forested watershed does.
  • I can evaluate competing solutions for keeping an ecosystem service using scientific, economic and social criteria, including cost calculations, and defend a recommendation with evidence.

What shows the learning happened

  • Lab 1 group and class data tables and a class graph of nut set for three orchard layouts and two levels of bee visits, with a written explanation of why own-variety pollen does not count and why the layouts differ.
  • A written evaluation (Lab 1 q9 or the slide 25 task) of at least three ways an almond grower could keep pollination reliable, judged against a named criterion and constraint.
  • A labeled filter design, two rounds of test data (clarity rating, volume, cost) and a redesign justified with class data (Lab 2), plus an explanation of why clear water is not necessarily safe.
  • A cause-and-effect chain and paragraph explaining how the loss of India's vultures affected people, naming the evidence that would show cause rather than only a pattern (slides 16-18, W3).
  • A council recommendation (Lab 3) with correct 30-year cost calculations, a completed weighted decision matrix, a response to at least one stakeholder concern, and one value a replacement cost leaves out.
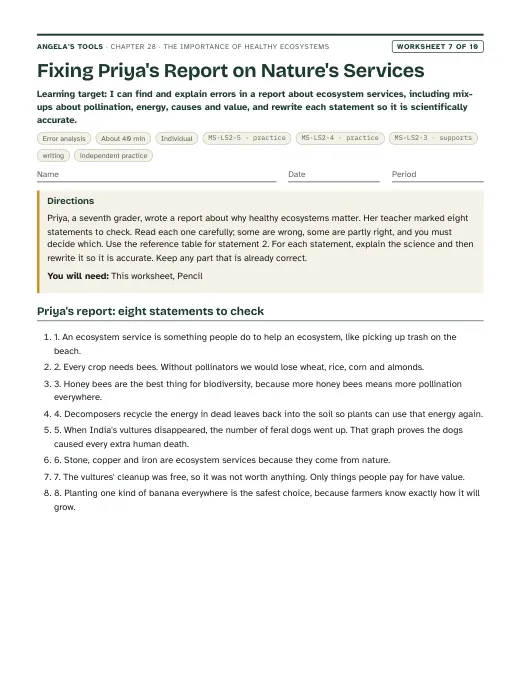
  • Slide 8 check, exit ticket and W10 responses that separate ecosystem services from human actions (slide 8, W10 q1) and from geological resources (slide 8, W2 q9, W7 statement 6), and that compute a multi-year cost correctly (exit item 3, W10 q5).

Key vocabulary 12 terms

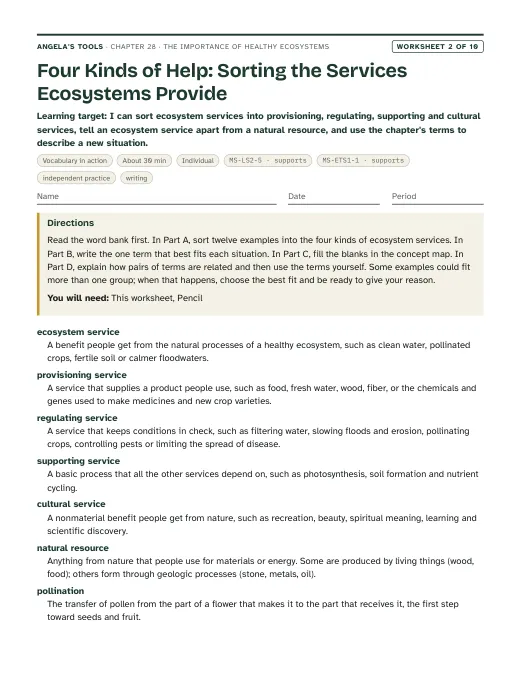
ecosystem serviceA benefit people get from the normal work of an ecosystem's living and nonliving parts, such as bees pollinating crops, soil filtering rainwater, or marsh plants slowing storm waves.The oak woodland beside the orchard provides an ecosystem service: native bees nest there and visit the almond blossoms in February.
natural resourceA material or energy source from nature that people use, such as water, wood, food or minerals. Some are grown by living ecosystems; stone and metals form through geological processes in Earth's crust.Lumber is a natural resource grown by a forest, while the copper in a wire is a natural resource that formed in rock.
pollinationMoving pollen from the anthers of a flower to a stigma, the first step toward making seeds and fruit. Wind carries pollen for some plants; for many others an animal pollinator, such as a bee, fly, moth, bird or bat, carries it while feeding.Pollination was poor during the cold, rainy week of bloom because the bees stayed inside their hives.
cross-pollinationPollination with pollen from a different plant. Most almond varieties can make seeds only with pollen from a different, compatible variety, because their own variety's pollen cannot fertilize them.Growers plant a pollinizer variety in every other row so bees can carry out cross-pollination between the rows.
biodiversityThe variety of life in a place: how many kinds of organisms live there and how much the individuals of each kind differ in their traits.Wild banana relatives in Southeast Asian forests hold far more biodiversity than a plantation of genetically identical Cavendish plants.
disease resistanceInherited traits that make an organism less likely to be infected by a particular disease, or less likely to be badly harmed if it is infected.Breeders are screening wild bananas for disease resistance to Tropical Race 4, the strain of Fusarium wilt that kills Cavendish plants.
scavengerAn animal that feeds mostly on animals that are already dead instead of hunting live prey.Vultures are scavengers: a large flock can strip a cow carcass in under an hour and leave little for flies, rats and dogs.
watershedAll the land that drains rain and melted snow into the same stream, river, lake or reservoir.Because New York City's main reservoirs sit in mostly forested watersheds, the water that reaches them carries little mud.
turbidityHow cloudy a liquid is because of particles floating in it, such as silt, clay or bits of plants. Higher turbidity means murkier water.After the storm, the creek's turbidity rose so much that a white disk disappeared only a few centimeters below the surface.
criteriaThe things a design must achieve to count as a success, stated precisely enough to test. One of them is called a criterion.One criterion for the class filter was a clarity rating of at least 3 on the reference-cup scale.
constraintA limit a design must stay within, such as a budget, the materials available, time, laws, or the effects on people and the environment.The ten-dollar budget was a constraint, so the team could not simply buy more sand.
replacement costAn estimate of what an ecosystem service is worth, found by adding up what people would have to pay for a human-made substitute that does the same job.The council used the replacement cost of a filtration plant to argue that the forest above the reservoir was worth protecting.

Standards alignment

California NGSS, Grade 7 Preferred Integrated Course Model. Each entry says whether this chapter's work assesses the performance expectation, gives practice toward it, or supports it as background; the resource lists below repeat this for every worksheet and lab.

MS-LS2-5Assesses: evaluating competing solutions for maintaining an ecosystem service and biodiversity against scientific, economic and social constraintsCA Grade 7

Evaluate competing design solutions for maintaining biodiversity and ecosystem services.

In Lab 3 students compare protect-or-replace options for three ecosystem services in a fictional town, calculate 30-year costs, weigh effects on biodiversity and on stakeholders, and defend a recommendation, which is direct evidence toward this PE; the slide 25 task does the same for an orchard. Lab 1 (pollination solutions) and Lab 2 (filter versus watershed) give practice with the same reasoning.

MS-ETS1-1Practice toward: stating criteria and constraints preciselyCA Grade 6-8

Define the criteria and constraints of a design problem with sufficient precision to ensure a successful solution, taking into account relevant scientific principles and potential impacts on people and the natural environment that may limit possible solutions.

The lesson's New York City case shows how precise criteria and constraints shaped a water-supply solution. Students sort criteria from constraints (slide 24), work to stated criteria in Lab 2, and choose criterion weights in Lab 3. The criteria are mostly supplied, so this is practice.

MS-ETS1-2Assesses: the systematic weighted decision matrix in Lab 3CA Grade 6-8

Evaluate competing design solutions using a systematic process to determine how well they meet the criteria and constraints of the problem.

Lab 3 requires students to score seven competing options on weighted criteria and a budget and to use the totals in their recommendation; Lab 2 compares filter designs on a criteria table as practice.

MS-ETS1-3Practice toward: analyzing class test data to combine the best features of several designsCA Grade 6-8

Analyze data from tests to determine similarities and differences among several design solutions to identify the best characteristics of each that can be combined into a new solution to better meet the criteria for success.

In Lab 2 every team posts its filter design and test results, then uses the class table to identify features that gave the clearest and fastest water and combines them in a second round. Only one redesign cycle is run, so the chapter treats this as practice.

MS-ESS3-3Supports: monitoring and reducing a human impact on waterCA Grade 6

Apply scientific principles to design a method for monitoring and minimizing a human impact on the environment.

MS-ESS3-3 is a Grade 6 performance expectation in the California integrated sequence, so here it is background, not assessed. Lab 2 q11 and the Lab 3 monitoring question ask students to propose how a town could monitor and reduce mud from construction or loss of a watershed, revisiting the Grade 6 idea.

Science and engineering practices

  • Engaging in Argument from Evidence. Students evaluate competing solutions (renting hives, hedgerows and self-fertile varieties in Lab 1; filtration plant versus watershed protection, seawall versus dune restoration in Lab 3) and defend a choice with data, costs and stated criteria.
  • Developing and Using Models. Students run a cotton-swab orchard model to generate pollination data (Lab 1) and treat a bottle filter as a small model of the straining done by soil in a watershed (Lab 2), naming what each model leaves out.
  • Constructing Explanations and Designing Solutions. Students design, test and modify a filter (Lab 2) and explain cause-and-effect chains such as cattle drug, fewer vultures, more feral dogs, more rabies exposures (slides 16-18).
  • Using Mathematics and Computational Thinking. Students calculate nut-set percentages and percent change (Lab 1), the share of cloudiness removed and cost per liter (Lab 2), and 30-year totals, cost per home and weighted scores (Lab 3, slide 25).

Disciplinary core ideas

  • LS2.C Ecosystem Dynamics, Functioning, and Resilience. Services depend on a functioning ecosystem, and the integrity of its biodiversity is a measure of its health; losing one population (vultures) or habitat (dunes, woodland, forest) changes the services people receive.
  • LS4.D Biodiversity and Humans. Changes in biodiversity affect resources (disease-resistance traits in wild bananas, wild bees for crops) and services such as water purification and flood protection.
  • ETS1.A Defining and Delimiting Engineering Problems. The more precisely criteria and constraints are defined (New York City's water, the filter challenge, the council budget), the more likely a solution is to succeed.
  • ETS1.B Developing Possible Solutions. Solutions are compared systematically against criteria and constraints, and test results show which features to combine (Lab 2 class table, Lab 3 decision matrix).

Crosscutting concepts

  • Stability and Change. Small changes in one part of a system cause large changes in another: a livestock painkiller and India's vultures, a parking lot on a dune and flood damage behind it.
  • Cause and Effect. Students separate a pattern (vultures fell while dogs rose) from evidence of cause, such as comparisons between places that did and did not lose their vultures.
  • Systems and System Models. An orchard, a watershed and a coastline are systems whose living and nonliving parts together produce a service; each lab model keeps some parts and leaves others out.
  • Influence of Science, Engineering, and Technology on Society and the Natural World. Technology can substitute for some services (hives on trucks, filtration plants, seawalls), but choosing among substitutes and protection weighs cost, reliability, biodiversity and the needs of different people.

Presentation 28 slides

The Importance of Healthy Ecosystems: what nature does for us, and what it would cost to replace. Original, editable slides with speaker notes: a phenomenon opener, learning targets, the chapter's concepts with diagrams, vocabulary in context, 4 checks for understanding, 2 discussion prompts, an application task, a misconception check, a synthesis and an exit ticket.

Worksheets 10 of 10

Ten different tasks, one per instructional blueprint. Each has a student PDF (low ink, US Letter), an editable DOCX, an HTML preview, and a separate teacher answer key with reasoning.

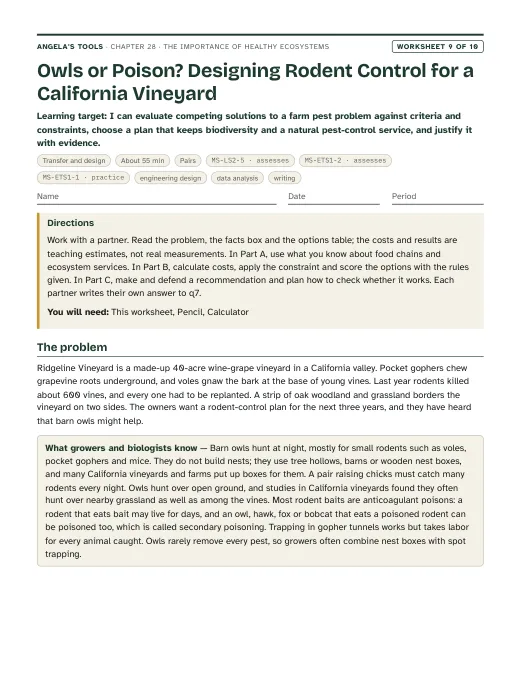
First page of Owls or Poison? Designing Rodent Control for a California Vineyard
Worksheet 9 · Transfer and design

Owls or Poison? Designing Rodent Control for a California Vineyard

I can evaluate competing solutions to a farm pest problem against criteria and constraints, choose a plan that keeps biodiversity and a natural pest-control service, and justify it with evidence.

55 minpairsExtensionEngineering designData analysisWriting MS-LS2-5 · assessesMS-ETS1-2 · assessesMS-ETS1-1 · practice
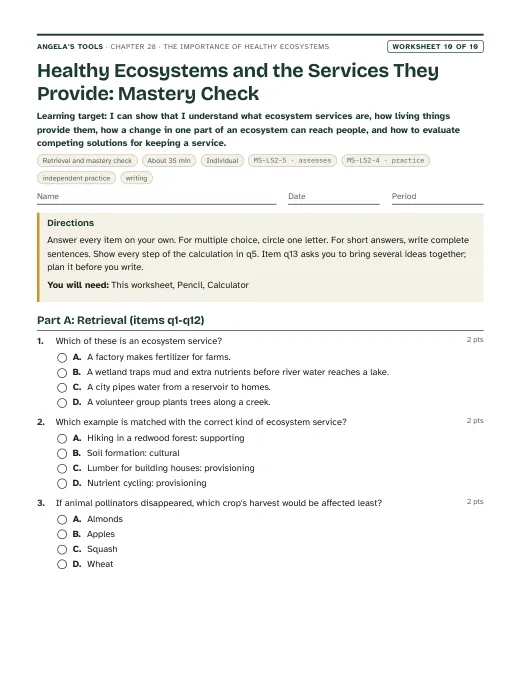
First page of Healthy Ecosystems and the Services They Provide: Mastery Check
Worksheet 10 · Retrieval and mastery check

Healthy Ecosystems and the Services They Provide: Mastery Check

I can show that I understand what ecosystem services are, how living things provide them, how a change in one part of an ecosystem can reach people, and how to evaluate competing solutions for keeping a service.

35 minindividualAssessmentIndependent practiceWriting MS-LS2-5 · assessesMS-LS2-4 · practice

Collaborative labs 3 of 3

Three different investigation approaches. Each has a teacher guide (purpose, materials with quantities, estimated cost, prep, safety, procedure, expected observations, debrief, answer key, assessment criteria, accessibility adaptations, low-cost alternative) and a student recording sheet.

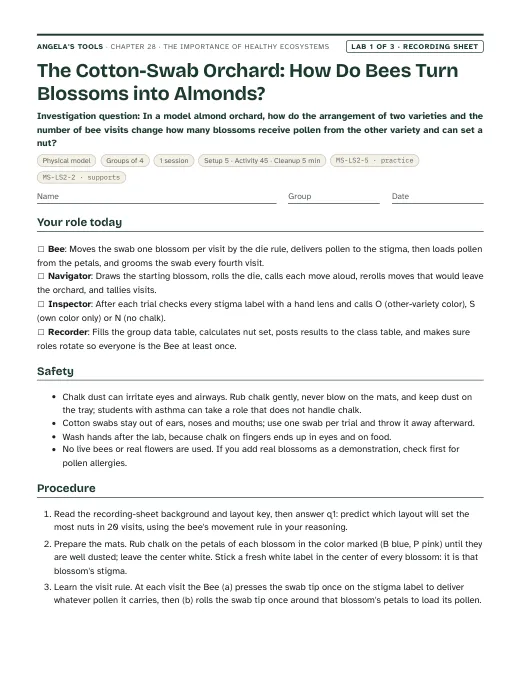
First page of the The Cotton-Swab Orchard: How Do Bees Turn Blossoms into Almonds? recording sheet
Lab 1 · Physical model

The Cotton-Swab Orchard: How Do Bees Turn Blossoms into Almonds?

In a model almond orchard, how do the arrangement of two varieties and the number of bee visits change how many blossoms receive pollen from the other variety and can set a nut?

Groups of 41 session45 min activityEst. 6 to 12 per class (estimate)Orchard mat: a printed sheet with 20 blossom outlines (about 4 cm across) in 4 rows of 5, numbered 1-20Sidewalk chalk, one blue stick and one pink stick (any two strongly contrasting colors)Cotton swabs MS-LS2-5 · practiceMS-LS2-2 · supports
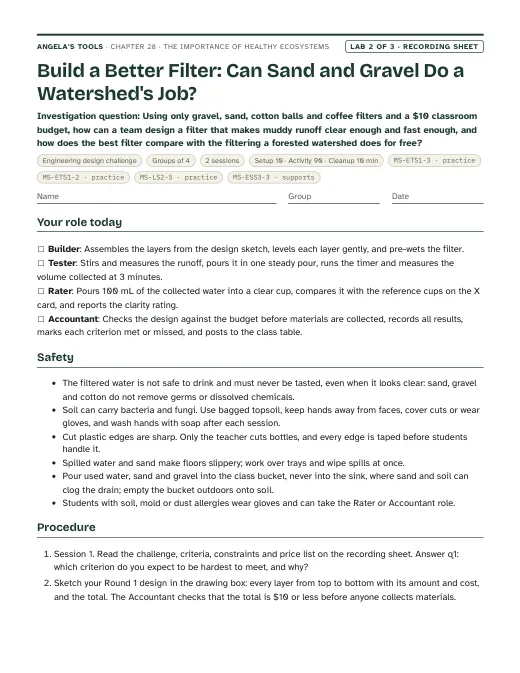
First page of the Build a Better Filter: Can Sand and Gravel Do a Watershed's Job? recording sheet
Lab 2 · Engineering design challenge

Build a Better Filter: Can Sand and Gravel Do a Watershed's Job?

Using only gravel, sand, cotton balls and coffee filters and a $10 classroom budget, how can a team design a filter that makes muddy runoff clear enough and fast enough, and how does the best filter compare with the filtering a forested watershed does for free?

Groups of 42 sessions90 min activityEst. 15 to 30 per class (estimate)Clear 2-liter plastic bottle, cut in half by the teacher, cut edges covered with tape, cap removed; the top half sits upside down in the bottom half as a funnelPea gravel or aquarium gravel, rinsedWashed play sand MS-ETS1-3 · practiceMS-ETS1-2 · practiceMS-LS2-5 · practiceMS-ESS3-3 · supports
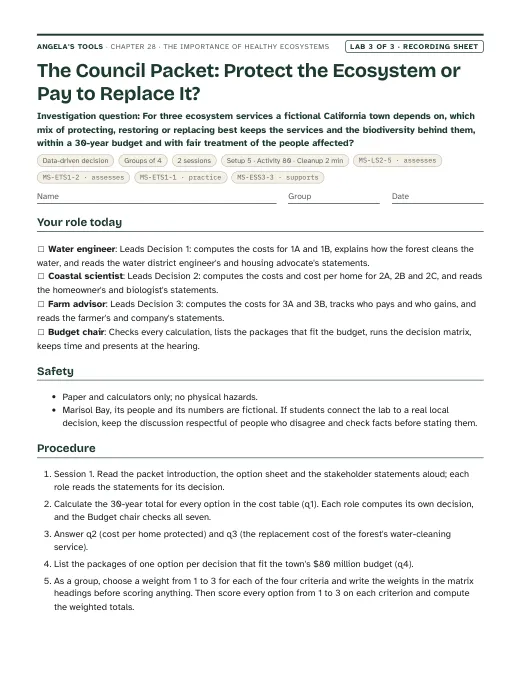
First page of the The Council Packet: Protect the Ecosystem or Pay to Replace It? recording sheet
Lab 3 · Data-driven decision

The Council Packet: Protect the Ecosystem or Pay to Replace It?

For three ecosystem services a fictional California town depends on, which mix of protecting, restoring or replacing best keeps the services and the biodiversity behind them, within a 30-year budget and with fair treatment of the people affected?

Groups of 42 sessions80 min activityEst. 2 to 4 per class (estimate)Council packet (this recording sheet) with the option sheet, stakeholder statements and matrixCalculatorSticky notes in three colors for the hearing vote MS-LS2-5 · assessesMS-ETS1-2 · assessesMS-ETS1-1 · practiceMS-ESS3-3 · supports

Teacher guidance

Suggested sequence (8 steps)
  1. Period 1: Presentation slides 1-8 (the bee-truck phenomenon, targets, what counts as an ecosystem service, four kinds of services, vocabulary, the meadow's soil work, and the service-resource-neither check). Use the W1 phenomenon worksheet alongside slide 2; W2 vocabulary sort for homework.
  2. Period 2: Lab 1, The Cotton-Swab Orchard (one session): three orchard layouts and a half-the-bees trial, with results posted to the class table before the bell.
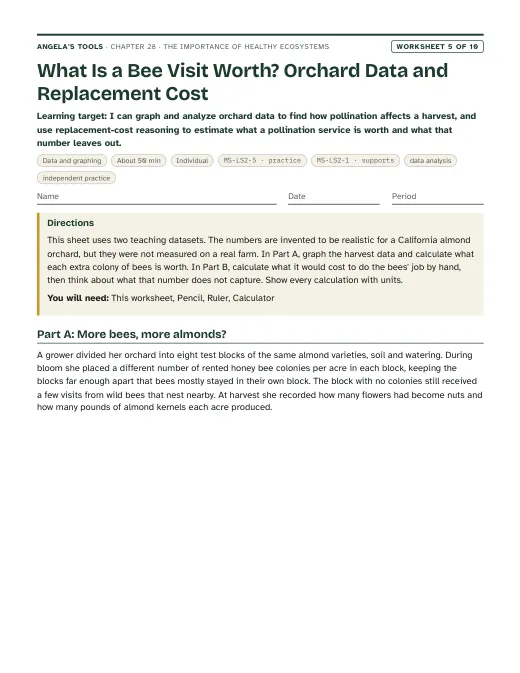
  3. Period 3: Slides 9-14 (pollination, blossom to almond, vocabulary, the California almond connection, the rent-the-bees discussion, the cross-pollination check). Groups finish the Lab 1 analysis questions; W5 data worksheet on orchard data and replacement cost for homework.
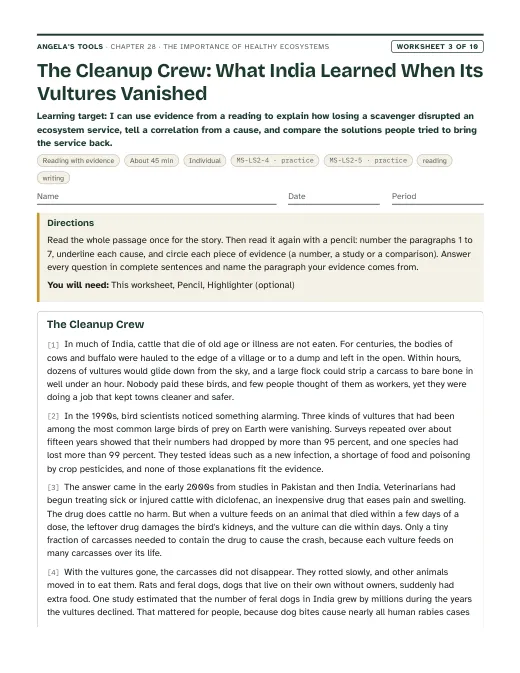
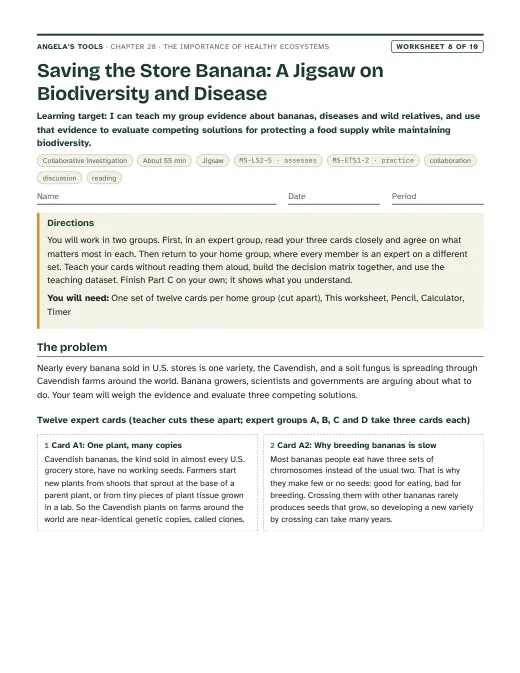
  4. Period 4: Slides 15-21 (bananas and biodiversity, the vulture chain, the pattern-or-cause discussion, the small-change check, dunes and marshes, the San Francisco Bay connection, seawall versus dunes). W3 reading on India's vultures for homework and W7 misconception worksheet as review. Optional ninth period: the W8 jigsaw on bananas, biodiversity and disease after slide 15.
  5. Period 5: Slides 22-24 (New York City's water, vocabulary, the criterion-or-constraint check), then Lab 2, Build a Better Filter, session 1: plan, build and run round 1.
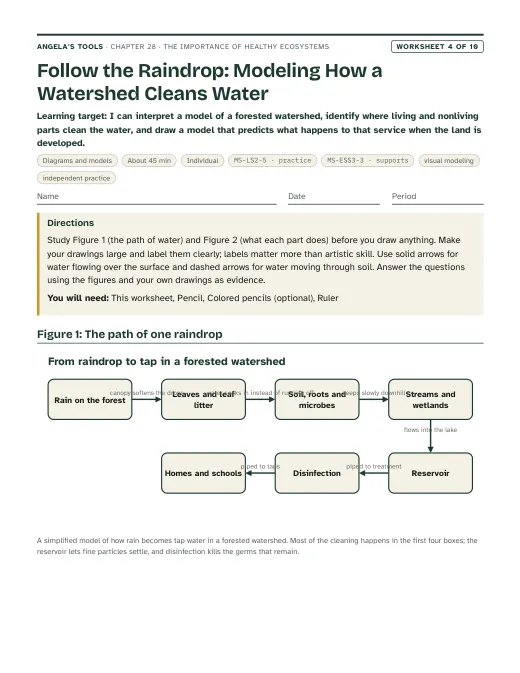
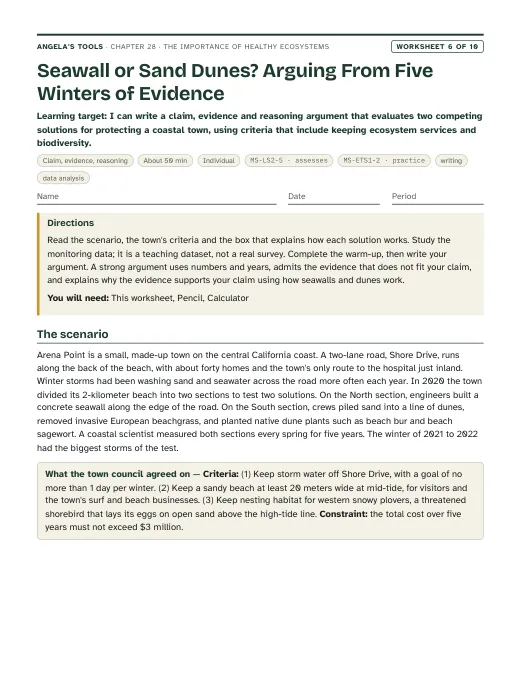
  6. Period 6: Lab 2 session 2: study the class table, redesign, retest and run the clog test. W4 diagram worksheet on how a watershed cleans water for homework; W6 CER on seawall or dunes as the next opener or homework.
  7. Period 7: Lab 3, The Council Packet, session 1: cost calculations, budget packages, the weighted decision matrix and the group recommendation.
  8. Period 8: Lab 3 session 2 (the council hearing and individual analysis), then slides 25-28 (the orchard pollination task, the clear-water misconception, synthesis, exit ticket). W9 transfer design challenge in pairs (finish for homework) and W10 mastery as the quiz at the start of the next lesson; preview Lesson 29.

Materials overview: Lab 1 uses printed orchard mats, blue and pink sidewalk chalk, cotton swabs, small round white labels as stigmas, a die and numbered slips per group. Lab 2 uses recycled 2-liter bottles cut by the teacher, play sand, pea gravel, cotton balls, coffee filters, bagged topsoil and dry leaves for simulated runoff, identical clear cups for teacher-made reference cups, measuring cups, timers and trays. Lab 3 is paper only: the council packet and a calculator. No flames, no heating, and no chemicals beyond soil and chalk; the filtered water in Lab 2 is never to be tasted.

Common misconceptions (6)
“Ecosystem services are jobs people do to help nature, like picking up litter or planting trees.”
Why it happens: The word 'service' sounds like community service, and students hear far more about protecting nature than about what nature does for them.
Correction: The benefit flows from the ecosystem to people: pollination, soil building, water filtering and flood buffering are work the ecosystem does. People can protect or restore an ecosystem so that it keeps providing those services, but the restoring is not itself the service.
“Without bees, people would have almost nothing to eat.”
Why it happens: News stories about bee declines often say most food depends on bees, and the textbook says farmers could not grow grains without pollinators.
Correction: Wheat, rice and corn are pollinated by wind or by their own pollen. About three quarters of the world's leading food crops benefit from animal pollinators, but those crops make up only about a third of world crop production by volume. Losing pollinators would make many fruits, nuts and vegetables scarce and costly, and diets poorer, without emptying every plate.
“Saving the bees means saving honey bees, the country's native pollinator.”
Why it happens: Honey bees are the bees students see in pictures, products and news stories, and the almond story is all about them.
Correction: Honey bees were brought from Europe by colonists and are managed like livestock. The United States has about 4,000 species of native bees, most of which live alone and nest in soil or hollow stems; they need year-round flowers and nesting places that a single-crop landscape does not provide.
“Water that looks clear is clean and safe to drink.”
Why it happens: Muddy water is obviously dirty, so students assume removing the mud removes the danger. Lab 2 rewards clarity.
Correction: Clarity only measures particles big enough to scatter light. Bacteria, viruses and dissolved substances such as salts, nitrate and some pesticides can pass through sand and stay invisible. That is why even New York City's naturally filtered water is still disinfected and tested.
“A small change to an ecosystem can only cause a small effect.”
Why it happens: Everyday experience suggests causes and effects are about the same size, and a painkiller given to cows seems unrelated to people.
Correction: Effects can travel along chains of interactions and grow. A cattle drug that killed most of India's vultures left carcasses for feral dogs and rats, and researchers have linked the vulture collapse to more human deaths in the districts that lost their vultures.
“If a machine can replace an ecosystem service more cheaply, the ecosystem has no value; or the opposite, protecting nature is always the cheapest choice.”
Why it happens: Students hear only the success stories, like New York City, or only the price tags.
Correction: Replacement cost is one estimate of value, and it can point either way. An ecosystem usually provides several services at once, plus habitat, recreation and things not yet discovered, while a substitute does one job. Good decisions compare the full costs and benefits honestly, including who pays and who gains.
Differentiation suggestions (6)
  • Multilingual learners: Pre-teach service, pollen, stigma, filter, cost and protect with picture cards and the gesture 'nature works, people benefit'. Provide sentence frames such as 'The ___ provides ___ because ___' and 'Option ___ costs more, but it ___'. Let groups write council recommendations in a home language first, then translate key sentences.
  • Students who need more support: Give a Lab 1 mat with the B and P letters printed inside every blossom and a nut-set conversion strip (each blossom = 5 percent). In Lab 3, supply the cost table with the yearly-cost multiplication already set up (yearly cost × 30 = ___) and a matrix with scores filled in for two options as a model.
  • Students ready for extension: Have students change the Lab 1 die rule so bees cross rows as often as they move along them and predict, then test, whether the layout ranking changes. Or have them read the New York City Filtration Avoidance Determination summary and list the watershed programs it requires, or compare the 1990s cost estimates for the filtration plant with the cost of the watershed program.
  • Students who need movement or alternative output: Run Lab 1 as a floor orchard: twenty students hold blue or pink cards in a 4-by-5 grid and a 'bee' walks by the die rule carrying a sticky note that records the last variety visited. Accept a recorded spoken recommendation or a labeled poster for the Lab 3 council report.
  • Students with limited fine-motor control or low vision: Use foam makeup swabs or a partner who moves the swab while the student directs and calls the die rolls; print mats in large format with tape texture on pink blossoms. In Lab 2, offer the Rater or Accountant role and a viewing card with five black lines of different thickness so clarity can be judged by counting visible lines.
  • Students with asthma, allergies or skin sensitivity: In Lab 1 they can take the Navigator or Recorder role away from chalk dust; in Lab 2 provide gloves and the Rater or Accountant role, since bagged soil can carry mold spores and microbes.
Accuracy notes: where the textbook simplifies (15)
  • Almond timing and numbers: the textbook's phenomenon says bees are trucked in each spring. Almond bloom usually begins in mid-February and lasts about three to four weeks, so colonies arrive in winter, many of them in holding yards from December. The numbers change every year and differ by source: California has about 1.4 million acres of bearing almond orchards (about 1.40 million in 2025, per a January 2026 UC Davis and UC ANR market report citing Land IQ and USDA) and grows roughly 80 percent of the world's almonds; growers commonly stock about two colonies per acre for varieties that need cross-pollination and about one for self-fertile varieties; a 2025 farmdoc daily analysis estimated 2024 demand at about 2.7 million colonies, roughly 99 percent of the U.S. colonies counted on January 1, 2024, at an average fee of over $200 per colony. Always say 'about' or 'estimated' and give the year. The 'billions of bees' in the textbook is reasonable: a rented colony holds many thousands of bees, so the total runs into the tens of billions.
  • Almond biology: most established almond varieties, including Nonpareil, the most widely planted, are self-incompatible; pollen from the same variety cannot fertilize them, so growers plant compatible pollinizer varieties that bloom at the same time, usually in alternating solid rows. Mixing varieties within a row has not proven consistently better in yield and is more costly to harvest. Self-fertile varieties such as Independence can set nuts with their own pollen and are usually stocked with fewer hives, though bees still raise their yields. The almond we eat is a seed; the fruit is a drupe related to peaches, with a leathery hull in place of juicy flesh.
  • Honey bees and wild bees: honey bees (Apis mellifera) were brought from Europe by colonists and are a managed, introduced species; the United States has about 4,000 native bee species. A study of 23 California almond orchards (Klein et al., 2012) found wild bees visiting almond flowers only where orchards had adjacent semi-natural habitat or a strip of semi-natural vegetation, and a strip helped mainly at orchard edges. Lab 1's information card and q9 key follow this.
  • Pollinator dependence (prior review RF1): Section 1 (p. 377) says that without pollinators farmers could not produce grains. Wheat, rice and corn are wind- or self-pollinated. About 87 of the 115 leading world food crops benefit from animal pollination, but those crops make up only about 35 percent of world crop production by volume (Klein et al., 2007). Green beans are self-pollinating, and navel and Valencia oranges can set fruit without pollination, so this chapter does not use them as pollinator-dependent examples.
  • Bananas (RF2): Section 2 (p. 379) says Cavendish bananas are safe from Panama disease and are killed by yellow Sigatoka leaf spot. Cavendish resisted Race 1 of Panama disease (Fusarium wilt), which ended Gros Michel's export dominance, but it is susceptible to Tropical Race 4, the wilt now spreading through Cavendish plantations; yellow Sigatoka is a leaf-spot disease that lowers yield and has largely been displaced by black leaf streak. Gros Michel is not extinct; small farmers still grow it. Banana plants are giant herbs, not trees. Slide 15 teaches the corrected version.
  • Vultures (RF3): Figure 3 (p. 381) plots vultures and feral dogs only; it shows no rabies data, and its numbers are estimates. Three Gyps vulture species in India fell by about 97 to 99.9 percent between 1992 and 2007 after the veterinary painkiller diclofenac came into wide use; India banned veterinary diclofenac in 2006. Later research (Frank and Sudarshan, American Economic Review, 2024) compared districts that had been good vulture habitat with districts that had few vultures and found human death rates rose by more than 4 percent where vultures vanished, through a broad sanitation shock in which more dogs and rabies are one likely pathway. Slides 16-17 present the dog-and-rabies chain as a supported explanation and use the district comparison to teach cause versus pattern.
  • Rabies (RF4): the textbook calls rabies fatal without qualification. Once symptoms appear it is virtually always fatal, but it is preventable with prompt care after a bite; dogs cause about 99 percent of human cases (WHO). Teachers should not give medical advice beyond 'see a doctor after any animal bite'.
  • Flooding (RF5): Section 4 (p. 383) says floods now cause more U.S. disaster deaths and property damage than any other natural hazard. FEMA supports 'most common and most costly'; the National Weather Service ranks heat as the leading weather-related killer. This chapter claims only the FEMA statement.
  • Coastal buffers (RF8): the textbook says marshes and dunes absorb floodwater. They mainly act as barriers that take energy out of waves, slow water and hold sediment; NOAA notes that about 15 feet of marsh can absorb roughly half of incoming wave energy. Slides 19-21 use this wording.
  • New York City (RF6): the textbook frames the problem as overloaded treatment plants and implies the water needs little treatment. In fact the Catskill/Delaware supply was unfiltered; federal rules adopted in 1989 required filtration unless a supplier met strict filtration-avoidance criteria, which the city has met since 1993 through watershed protection, including a 1997 agreement with upstate communities. The water is still disinfected and tested, and the smaller Croton system is filtered. The watershed is mostly forest, with farms, streams, wetlands and reservoirs, not mainly wetlands as the p. 384 caption says. In the 1990s the city estimated a Catskill/Delaware filtration plant could cost up to about $6 billion to build and more than $300 million a year to run, though an EPA-appointed expert panel argued filtration might cost as little as half that; the watershed strategy was budgeted at about $1.5 billion over ten years (National Research Council, 2000). Population and gallon figures are as of the textbook's writing; NYC DEP now says more than a billion gallons a day reach about nine million people.
  • Decomposers and energy (RF7): Section 1 (p. 377) says decomposers use energy and matter and release nitrogen and carbon molecules into the soil. Matter is recycled into soil and air; the energy in dead matter is used by decomposers and leaves as heat. Much of the carbon returns to the air as carbon dioxide. Slide 7 says this plainly.
  • Resources versus services (RF11): Section 1 (p. 377) says stone, minerals and metals come from Earth's ecosystems. They are natural resources formed by geology, not products of living ecosystems, and ecosystem-service frameworks do not count them. The p. 377 caption also implies a meadow's soil supplies a farm; a farm's fertility depends on decomposers in its own soil. Slides 4 and 7 and the vocabulary definitions separate these ideas.
  • Service categories: slide 5, W2, W3 q9, W8 q6, W9 q1 and W10 q2 use the four groups of the Millennium Ecosystem Assessment (2005): provisioning (food, fiber, fresh water, genetic resources, biochemicals), regulating (water purification, erosion and flood regulation, pest and disease regulation, pollination, climate regulation), cultural (recreation, aesthetic, spiritual and educational value) and supporting (soil formation, nutrient cycling, primary production by photosynthesis). The assessment lists pollination as regulating; many school texts call it supporting, and later frameworks (TEEB, CICES) drop the supporting group to avoid counting the same process twice. Accept a different placement when the student gives a sound reason.
  • Replacement cost is an economic method with limits: it estimates the value of a service by the price of a substitute, which can overstate value when nobody would actually build the substitute and understate it because a substitute does one job while an ecosystem provides many. All Lab 3 and slide 25 numbers are invented teaching values and are labeled simulated.
  • OCR gaps (RF9): p. 374 is a full-page photo, the p. 375 title is cut off, the p. 378 service wheel labels and parts of the p. 381 graph are missing from the text file. The slide 5 concept map sorts the wheel's services into the four groups described in the next note, not the publisher's layout.

Review status: reviewed · 2026-10-19 · Re-solved every numeric, multiple-choice, true/false, fill and table item in W1-W10, the three labs, the slide 25 task and the exit ticket (W1 1.3%/32.0%; W5 500%, net +$400/+$50/-$150, $5,650, 14.1x, 184 workers, extension 3.1 years; W6 -57%/+3%, 6 vs 4 flood days; W8 94%/16%/64%; W9 totals $22,500/$42,000/$27,000/$31,200/$54,000, matrix 18/22/24/14 and both extension weightings; W10 $120M/$30M/$90M; Lab 1 300 colonies, $60,000, $75,000; Lab 2 87.5%/93.75%, $18/L, $180M; Lab 3 135/36/40/25.5/54/9/3.9, per-home $114,286/$72,857/$154,286, all six budget packages and the sample matrix 17/22/19/22/11/16/22). All keys were correct. Lab 1 expected percentages checked by simulating the stated die, deliver-then-load and grooming rules (20,000 runs per condition): with moderate chalk carryover, blocks about 16 percent, alternating rows about 35 percent, mixed rows about 47 percent and alternating with 10 visits about 19 percent, matching the expected observations; about one move in three is vertical, as the q6 key says. Verified against sources: farmdoc daily (Feb 2025) for about 2.7 million colonies in 2024, 99 percent of U.S. colonies on January 1, 2024, two colonies per acre (one for self-fertile), over $200 per colony, mid-February bloom of 3-4 weeks; CalAg January 2026 report for 1.40 million bearing acres in 2025 and over 80 percent of world almonds; NRC (2000) for the city's up-to-$6 billion and over-$300-million-a-year filtration estimates, the EPA-appointed panel's as-little-as-half dispute and about $1.5 billion over ten years for the 1997 agreement; Klein et al. (2012) abstract for wild bees only near semi-natural habitat or vegetation strips, with strip benefits at orchard edges; the Millennium Ecosystem Assessment's placement of pollination and disease regulation as regulating services. Slide 5: the concept map put pollination under 'Keeps the system running' while the notes said the grouping was the 2005 assessment's, which lists pollination as regulating and conflicts with W2; pollination moved to 'Regulates and protects', photosynthesis added to the supporting group, caption and notes now name the Millennium Ecosystem Assessment and accept other placements with reasons. Added an accuracy note on the four categories. Klein et al. 2012 describes strips of semi-natural vegetation, not planted strips: wording corrected in the Lab 1 information card, slide 12 bullet and notes, and the accuracy note. New York City cost framing: Lab 2 debrief and Lab 3 q10 key quoted the city's $6 billion estimate without the EPA-appointed panel's dispute; both now say the panel argued filtration could cost as little as half. Lab 3: the budget rule said costs paid by homeowners do not count, which could let students exclude 1A and 1B (paid by water customers); the packet now states that water-customer costs count toward the budget, and the q1 key names water customers for 1B. The debrief and expected observations no longer call 1B 'usually near-unanimous' when the budget forces it. Smaller accuracy fixes: slide 16 caption no longer says every link was tested (experiments confirmed the drug-to-vulture links; the dog and human links rest on counts and district comparisons); slide 15 says Cavendish grows from shoots of parent plants, not cuttings; scavenger example and slide 16 notes now agree with W3 that a large flock strips a carcass in under an hour; W1 timeline moves colony splitting to spring and gives September to mite checks, combining and winter feeding. Links and references: every W1-W10 and Lab reference in chapter.json, the slide links and the worksheet and lab teacher notes was checked against the files (W3 vultures, W4 watershed, W5 orchard data, W6 seawall versus dunes, W8 banana jigsaw, W9 vineyard rodent control). Fixed slide 3 (W8 belongs to target 5, not target 1), evidenceOfLearning item 6 (now cites slide 8, W2 q9 and W7 for geological resources, since W10 does not test that), the sequence note that W9 is a pairs task, and the Lab 2 teacher note that pointed the filter class table to W9. Originality: no 6-word run shared with the lesson text outside titles and citations. Standards: every code exists with matching caGrade; MS-ESS3-3 is labeled Grade 6 and supports-only everywhere. Text limits, diagram fields, W3 passage length (684 words) and pacing total (137 minutes) all pass. Labs remain untested in a classroom, as each modelLimitations says.

Source references

Verified against the student edition of Bring Science Alive! 7th Grade Integrated (Student Edition). Printed page numbers appear in the book; PDF pages are the physical pages of the 524-page scan (printed + 36). The textbook is not reproduced on this site.

SectionPrinted pagesPDF pagesUsed for
Introduction: clean water and the lesson question374, 375410, 411Lesson question, vocabulary list (ecosystem service, disease resistance, scavenger), the standards the publisher lists, and the water-cleaning idea behind Lab 2.
1. Healthy Ecosystems Provide Services376, 377412, 413Definition of ecosystem service and natural resource, the meadow's soil and nutrient cycling, pollination (slides 4, 6, 7, 9-11; Lab 1). Grain, mineral and energy wording corrected in accuracy notes.
Key Science Concept: Humans Rely on Ecosystem Services378414The range of services on the wheel, regrouped in the slide 5 concept map and the slide 8 check.
2. Ecosystem Change Impacts Human Food Supplies: Bananas379415Biodiversity and disease resistance in crops (slide 15), with the disease names corrected.
3. Ecosystem Change Impacts Human Health: Vultures and Rabies380, 381416, 417Scavengers, the diclofenac chain and the two-trend graph (slides 16-18), extended with the district-comparison research.
4. Ecosystem Change Impacts Human Environments: Flooding382, 383418, 419Dunes, marshes and beach grasses as flood buffers, restoration (slides 19-21; Lab 3 Decision 2).
5. Clean Drinking Water for New York City (Engineering Design)384, 385420, 421Criteria and constraints, the watershed-protection solution (slides 22-24; Lab 2 comparison; Lab 3 Decision 1).
Lesson Summary385421Check that every summary idea is covered by a target, a slide and at least one lab.

External references used for accuracy checks

Related chapters