Chapter 29 · Unit 10: Humans and Changing Ecosystems · Segment 4

Engineering Solutions for Protecting Ecosystems

How do a growing human population and rising use per person change ecosystems, and how can people design, test and choose solutions that protect biodiversity and the services ecosystems provide?

MS-LS2-5 · assessesMS-ETS1-1 · assessesMS-ETS1-2 · assessesMS-ESS3-4 · supports Textbook pp. 386–399 1 presentation · 10 worksheets · 3 labs

Overview

Students figure out why wild populations such as snowshoe hares and lynx rise and fall while the human population has kept climbing, and what that rising line, multiplied by rising use per person, means for the ecosystems that supply our food, water, wood and energy. They trace the lesson's six kinds of human disruption through cause-and-effect chains that loop back to people, then work as engineers: they test solution ideas in a token model of a fished lake, design and retest a net that lets by-catch escape, and weigh competing plans to prevent a bat-borne virus without destroying the bats, using a weighted criteria matrix. The chapter ends on what science can and cannot decide: it predicts the results of choices, and communities weigh them.

Estimated class time: presentation about 131 minutes · worksheets about 425 minutes in total · labs 4 sessions. Eight 50- to 55-minute periods: one for the phenomenon and population milestones; two for the lake token model; one for per capita use, the six disruptions and engineering criteria; one for the net design challenge; one for Long Island Sound, the California connection and collaborative work; one for the Nipah decision lab; one for synthesis and the mastery quiz.

Phenomenon

Ten-year waves and one rising line

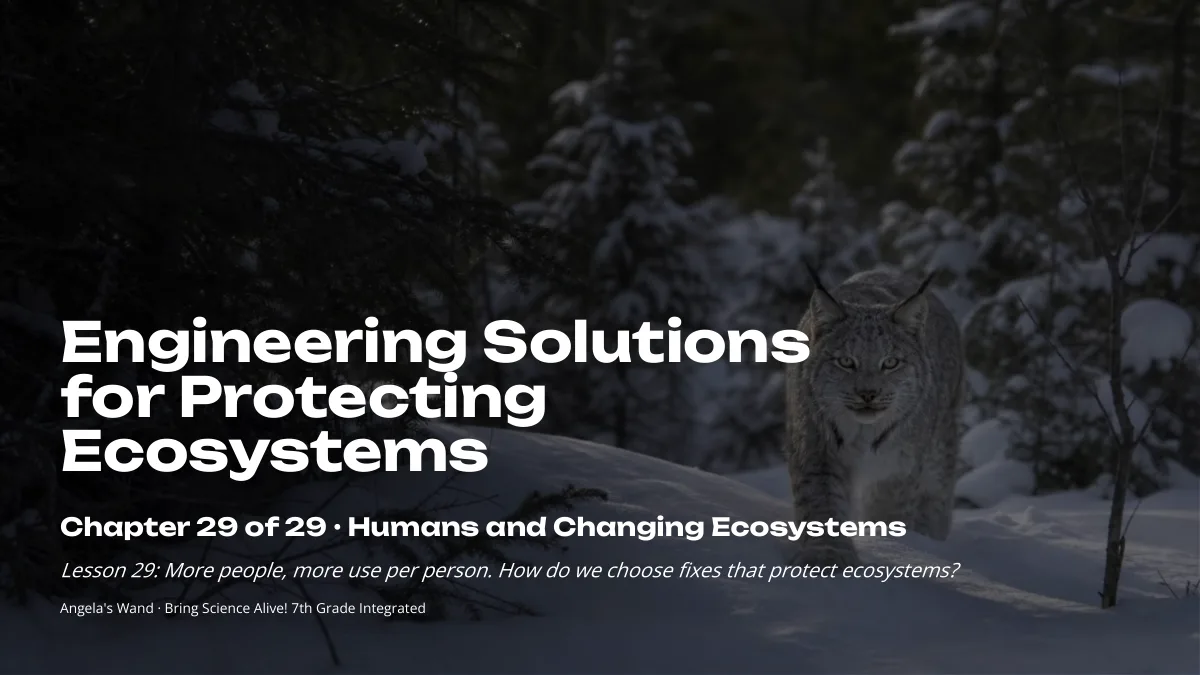
For about a century, from the 1820s to the 1930s, fur traders for the Hudson's Bay Company kept yearly records of how many lynx pelts trappers sold across northern Canada. The numbers rose and fell in waves roughly ten years apart, and each lynx peak came a year or two after a peak in snowshoe hares, the lynx's main food. Over those same years the number of people on Earth only climbed: about 1 billion around 1800, 2 billion in 1927, 8 billion in 2022 and about 8.2 billion in 2025 (United Nations estimates, World Population Prospects 2024). Why does a wild population rise and crash while ours keeps rising, and what does our rising line mean for the ecosystems that supply everything we use?

Notice and wonder prompts

  • What repeats in the lynx and hare records, and which animal seems to peak first?
  • A pelt count is not a head count. What besides the number of lynx could change how many pelts trappers sold in a year?
  • What keeps a lynx population from rising forever? Is anything doing the same thing to people?
  • If the human line keeps rising, where do the extra food, water and energy come from, and what happens to the places they come from?

Learning targets

  • I can use population and per capita data to explain how the number of people and the amount each person uses together set the demand on ecosystems.
  • I can explain why wild populations such as snowshoe hares and lynx rise and fall while the human population has kept rising, and say what that difference means for ecosystems.
  • I can name the six kinds of human disruption in this lesson and trace a cause-and-effect chain from a human activity to changes in biodiversity, ecosystem services and people.
  • I can define criteria and constraints precisely and test a design, such as a selective fishing net, against them.
  • I can evaluate competing solutions with a weighted criteria matrix that includes scientific, economic and social factors, and explain what science can and cannot decide.
  • I can compare monitoring data with a healthy-ecosystem model to judge whether a solution is working and how to revise it.

What shows the learning happened

  • A Lab 1 data table and graph comparing the otter-rule and village-rule runs on identical lakes, with a written explanation of why the otters crashed while the village kept growing that names imported fish as pressure moved to other ecosystems.
  • A per capita calculation (Lab 1 Part B, slide 11 or a worksheet item) showing that doubling use per person raises total demand as much as doubling the number of people.
  • A Lab 2 net design with measurable criteria and constraints written before building, three-haul test data, percent of target fish kept and by-catch released, and one modification justified by the first test.
  • A Lab 3 weighted criteria matrix with group-agreed weights, scores traced to the case-file data, weighted totals, rechecks under other stakeholders' weights and under worst-case estimates, and a recommendation that separates what the data showed from what the group valued.
  • A cause-and-effect chain from one human activity in the lesson to a change in biodiversity or an ecosystem service and back to people (slides 12 and 14, W4, W8 Part A).
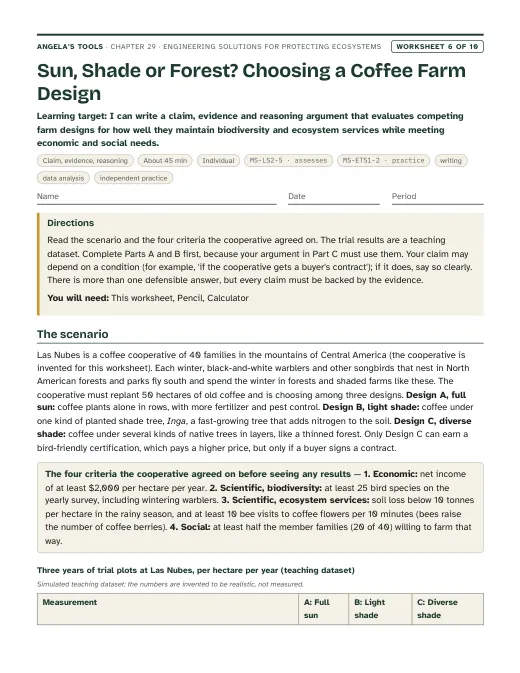
  • A written claim, supported by evidence and reasoning, about a human impact or a proposed solution (W6).

Key vocabulary 12 terms

per capitaPer person. A per capita amount is a group's total divided by how many people are in it.The town's total water use rose even though per capita use fell slightly, because many more people moved in.
ecosystem servicesThe benefits people get from working ecosystems, such as clean water, fish to eat, pollinated crops, fertile soil and protection from floods.A tidal marsh provides ecosystem services by removing nitrogen from water and soaking up storm surge before it reaches houses.
biodiversityThe variety of life in a place: how many kinds of organisms live there, how many of each there are, and the variety of habitats they use.Coffee farms shaded by tall trees keep far more bird biodiversity than coffee planted in open fields.
over-exploitationHarvesting a wild species faster than its population can replace the individuals taken, so the population shrinks.Catching small snail-eating fish along with large ones was over-exploitation that let the snails multiply.
by-catchAnimals caught by fishing gear that the fishers were not trying to catch, such as young fish, small species, sea turtles, dolphins or seabirds.The redesigned net cut the by-catch of small fish from most of each haul to a small fraction of it.
habitat degradationDamaging or destroying a natural area so that it can no longer support the living things and natural processes it used to.Clearing tropical forest for full-sun coffee is habitat degradation for the warblers that spend their winters there.
invasive speciesA species that people have moved, on purpose or by accident, to a place where it did not live before, and that harms the ecosystem, the economy or human health there.Silver carp count as an invasive species in the Mississippi basin because they eat the plankton that young native fish need.
emerging diseaseA disease that has newly appeared in people or is quickly spreading to new places, often after people or their animals come into new contact with wild animals that carry it.Nipah virus became an emerging disease in Malaysia when farm pigs picked it up from fruit bats and passed it to farmworkers.
climate changeA long-term shift in Earth's climate, including rising average temperatures, rising seas and changes in how often extreme weather happens. The change since the 1800s is driven mainly by burning fossil fuels.City planners use climate change models to estimate how far high tides may reach by 2050.
criteriaThe things a design must do to count as a success, stated precisely enough to test. The singular is criterion.One criterion for the net was that it keep at least 80 percent of the large fish in every three-haul test.
constraintsThe limits a design must work within, such as cost, materials, time, laws, safety and what the people who use it can manage.A small budget and the need for nets that fishers could repair themselves were the main constraints.
tradeoffGiving up some of one good outcome to get more of another, when no design can have everything.Shade-grown coffee is a tradeoff: fewer beans per hectare in exchange for forest habitat and pollinators.


Standards alignment

California NGSS, Grade 7 Preferred Integrated Course Model. Each entry says whether this chapter's work assesses the performance expectation, gives practice toward it, or supports it as background; the resource lists below repeat this for every worksheet and lab.

MS-LS2-5Assesses: evaluating competing design solutions for maintaining biodiversity and ecosystem services against scientific, economic and social criteriaCA Grade 7

Evaluate competing design solutions for maintaining biodiversity and ecosystem services.

In Lab 3 students score five plans and six packages for preventing Nipah virus spillover in an invented farming district against agreed, weighted criteria that include a wild species and its ecosystem services (fruit bats that pollinate durian and spread forest seeds), human health, farm income, cost, fairness and certainty, recheck the ranking under other stakeholders' weights and worst-case estimates, and defend a recommendation. W6 (coffee farm designs), W9 (keeping invasive mussels out of a reservoir) and W10 items 6, 9 and 12 ask for the same kind of evaluation. These tasks produce direct evidence toward this PE as written. Lab 2's comparison of net designs by how well they spare a by-catch species uses one simplified criterion set, so it is practice.

MS-ETS1-1Assesses: stating criteria and constraints precisely, including impacts on people and the environment (W9 Parts A and D)CA Grade 6-8

Define the criteria and constraints of a design problem with sufficient precision to ensure a successful solution, taking into account relevant scientific principles and potential impacts on people and the natural environment that may limit possible solutions.

In W9 students turn a water board's vague goals into measurable criteria and firm constraints, then judge whether a criterion is strict enough for an invasion that can never be undone and write a stricter one; that is direct evidence toward the PE. Lab 2 (sharpening supplied net criteria and adding one of their own), W2, W3 and W10 item 7 practice the same skill.

MS-ETS1-2Assesses: using a systematic process to judge competing solutions against criteria and constraints (Lab 3, W9 Part B)CA Grade 6-8

Evaluate competing design solutions using a systematic process to determine how well they meet the criteria and constraints of the problem.

In Lab 3 students apply fixed scoring rules and weighted totals to every competing plan and package and test how the ranking holds up under other weights and worst-case estimates; in W9 they run two competing plans through one model and check each against every criterion and the budget. Both are the PE as written: the process is supplied, and students carry it out and judge the results. Lab 1's criteria checks, Lab 2's shared test data and W4, W6, W8 and W10 item 9 are practice.

MS-ESS3-4Supports: background on population size and per capita consumptionCA Grade 8

Construct an argument supported by evidence for how increases in human population and per-capita consumption of natural resources impact Earth’s systems.

This is a California Grade 8 performance expectation. In this Grade 7 chapter students only build background for it: they calculate per capita use, compare population growth with growth in use per person in the Lab 1 model, and read real population milestones. Constructing the full evidence-based argument about Earth's systems belongs to Grade 8.

Science and engineering practices

  • Engaging in Argument from Evidence. Students evaluate competing solutions with jointly agreed, weighted criteria and defend a recommendation for preventing Nipah spillover with scores tied to data (Lab 3); they also argue which change, more people or more use per person, pushed the model lake down faster (Lab 1).
  • Asking Questions and Defining Problems. Students rewrite a vague goal as measurable criteria and constraints before building a net (Lab 2) and separate questions science can answer from questions only a community can answer (slides 22 and 24).
  • Developing and Using Models. A token model of a fished lake generates year-by-year data for comparing a wild consumer with a village and for testing solution cards (Lab 1); students read how scientists compared Long Island Sound measurements with a model of a healthy sound.
  • Analyzing and Interpreting Data. Students read the lynx and hare pattern and real population milestones, pool net-test results into a class selectivity graph (Lab 2), and compare model runs (Lab 1).
  • Using Mathematics and Computational Thinking. Per capita calculations, percent of target fish kept and by-catch released, and weighted totals in the decision matrix.

Disciplinary core ideas

  • LS2.C Ecosystem Dynamics, Functioning, and Resilience. Biodiversity is used as a measure of ecosystem health; removing snail-eating fish sets off a chain that reaches people; Long Island Sound recovers partly and unevenly after nitrogen is cut.
  • LS4.D Biodiversity and Humans. Losing species or habitat changes the resources and services people rely on, such as fish, pollination and seed dispersal, which is why the Lab 3 criteria count the fruit bats and the services they provide alongside human health.
  • ESS3.C Human Impacts on Earth Systems. Human impacts usually grow when both the population and the use per person grow, unless the activities and technologies involved are designed to do less harm; the Lab 1 solution cards test that idea. In California this idea is assessed in Grade 8, so here it is background.
  • ETS1.A Defining and Delimiting Engineering Problems. Precise criteria and constraints for the net, the lake model and the Nipah plans, including impacts on people and the environment.
  • ETS1.B Developing Possible Solutions. Systematic evaluation of competing solutions: criteria checks in Lab 1, test data in Lab 2 and the weighted matrix in Lab 3.
  • ETS1.C Optimizing the Design Solution. Students test a net, use the results to modify it, and retest; they combine solution cards whose strengths cover each other's weaknesses.

Crosscutting concepts

  • Cause and Effect. Students trace chains such as more fishing, fewer snail-eating fish, more snails, more bilharzia, and predict how each solution card changes the lake.
  • Stability and Change. In the lake model a modest rise in demand tips the lake into fast decline because a smaller stock regrows more slowly; small changes in one part cause large changes in another.
  • Patterns. The repeating waves of the hare and lynx record contrast with the steadily rising human line; the class net data form a pattern of percent kept against mesh opening.
  • Influence of Science, Engineering, and Technology on Society and the Natural World. Gear changes, bat-proof pig sheds, farm siting and treatment plants change both ecosystems and communities; science predicts the results, and people weigh them.

Presentation 27 slides

Engineering Solutions for Protecting Ecosystems: more people, more use, and how we choose fixes. Original, editable slides with speaker notes: a phenomenon opener, learning targets, the chapter's concepts with diagrams, vocabulary in context, 4 checks for understanding, 2 discussion prompts, an application task, a misconception check, a synthesis and an exit ticket.

Worksheets 10 of 10

Ten different tasks, one per instructional blueprint. Each has a student PDF (low ink, US Letter), an editable DOCX, an HTML preview, and a separate teacher answer key with reasoning.

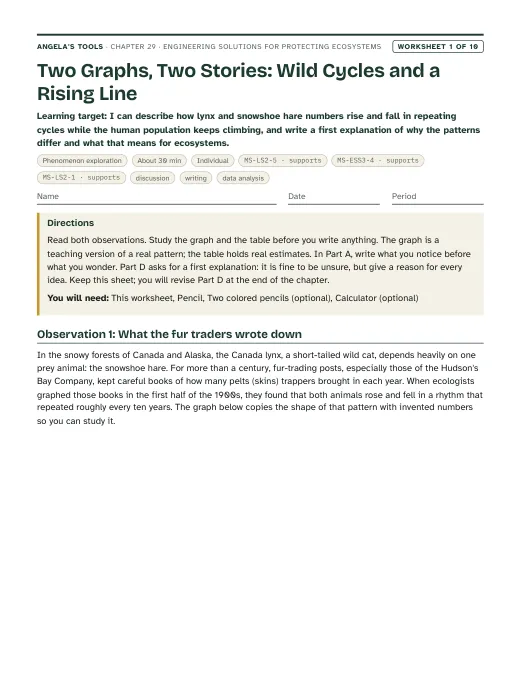
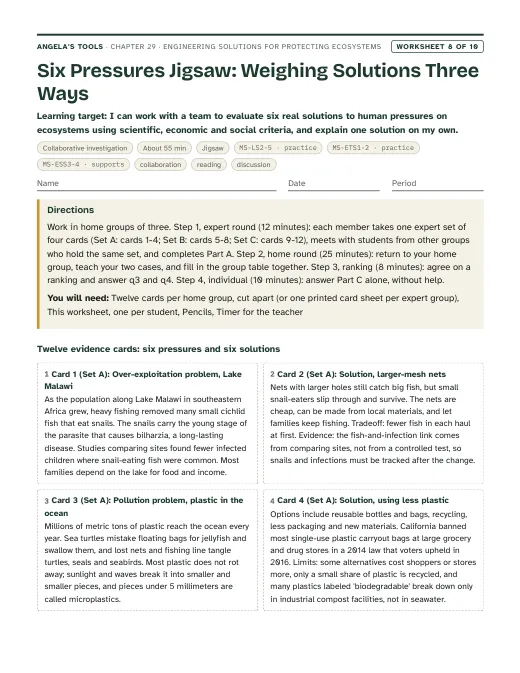
First page of Two Graphs, Two Stories: Wild Cycles and a Rising Line
Worksheet 1 · Phenomenon exploration

Two Graphs, Two Stories: Wild Cycles and a Rising Line

I can describe how lynx and snowshoe hare numbers rise and fall in repeating cycles while the human population keeps climbing, and write a first explanation of why the patterns differ and what that means for ecosystems.

30 minindividualActivates prior knowledgeDiscussionWritingData analysis MS-LS2-5 · supportsMS-ESS3-4 · supportsMS-LS2-1 · supports
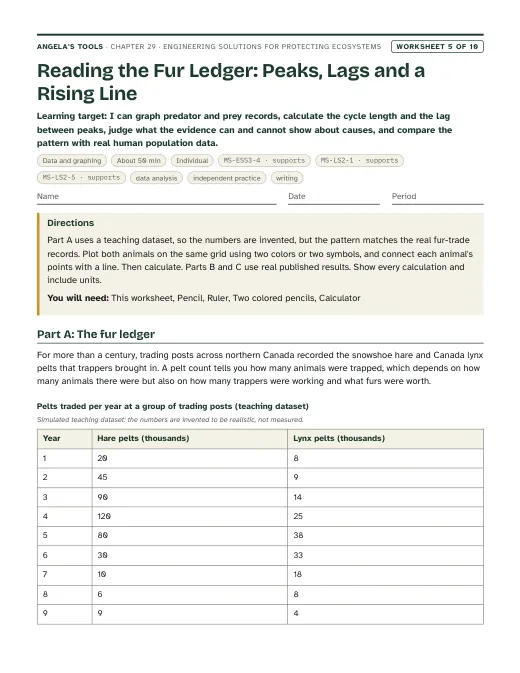
First page of Reading the Fur Ledger: Peaks, Lags and a Rising Line
Worksheet 5 · Data and graphing

Reading the Fur Ledger: Peaks, Lags and a Rising Line

I can graph predator and prey records, calculate the cycle length and the lag between peaks, judge what the evidence can and cannot show about causes, and compare the pattern with real human population data.

50 minindividualPracticeData analysisIndependent practiceWriting MS-ESS3-4 · supportsMS-LS2-1 · supportsMS-LS2-5 · supports

Collaborative labs 3 of 3

Three different investigation approaches. Each has a teacher guide (purpose, materials with quantities, estimated cost, prep, safety, procedure, expected observations, debrief, answer key, assessment criteria, accessibility adaptations, low-cost alternative) and a student recording sheet.

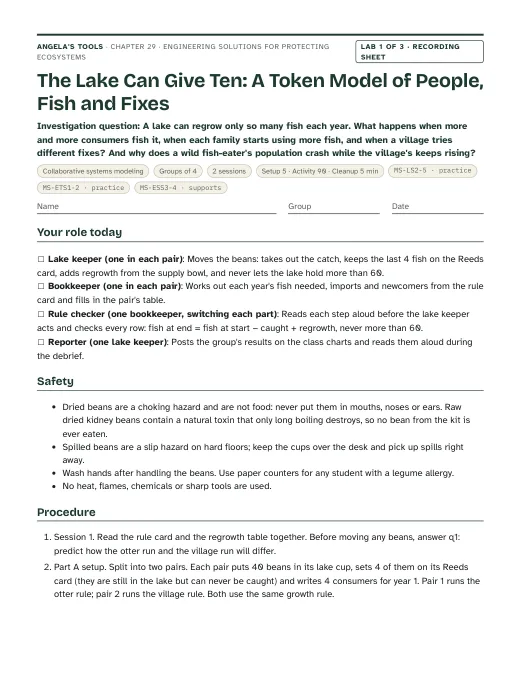
First page of the The Lake Can Give Ten: A Token Model of People, Fish and Fixes recording sheet
Lab 1 · Collaborative systems modeling

The Lake Can Give Ten: A Token Model of People, Fish and Fixes

A lake can regrow only so many fish each year. What happens when more and more consumers fish it, when each family starts using more fish, and when a village tries different fixes? And why does a wild fish-eater's population crash while the village's keeps rising?

Groups of 42 sessions90 min activityEst. 6 to 11 per class (estimate)Dried beans (pinto, navy or similar) or paper counters, standing for fishClear plastic cups labeled 'Lake'Small cup labeled 'Reserve' MS-LS2-5 · practiceMS-ETS1-2 · practiceMS-ESS3-4 · supports
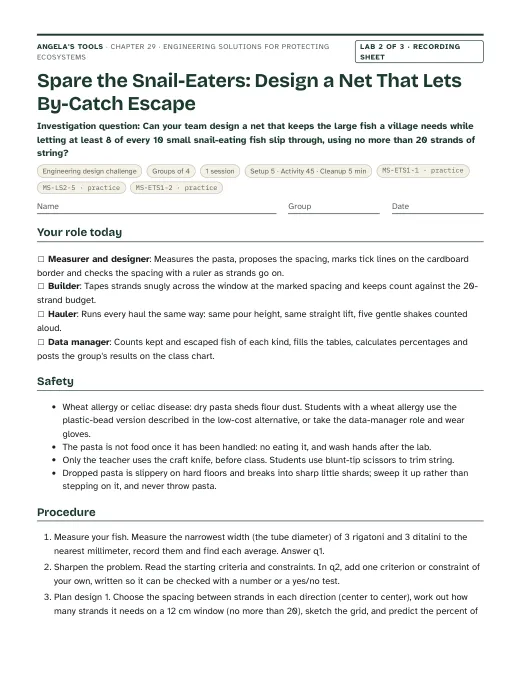
First page of the Spare the Snail-Eaters: Design a Net That Lets By-Catch Escape recording sheet
Lab 2 · Engineering design challenge

Spare the Snail-Eaters: Design a Net That Lets By-Catch Escape

Can your team design a net that keeps the large fish a village needs while letting at least 8 of every 10 small snail-eating fish slip through, using no more than 20 strands of string?

Groups of 41 session45 min activityEst. 8 to 11 per class (estimate)Dry rigatoni pasta (large target fish)Dry ditalini pasta (small snail-eating fish)Corrugated cardboard frames, 20 cm × 20 cm, with a 12 cm × 12 cm window cut in the center MS-ETS1-1 · practiceMS-LS2-5 · practiceMS-ETS1-2 · practice
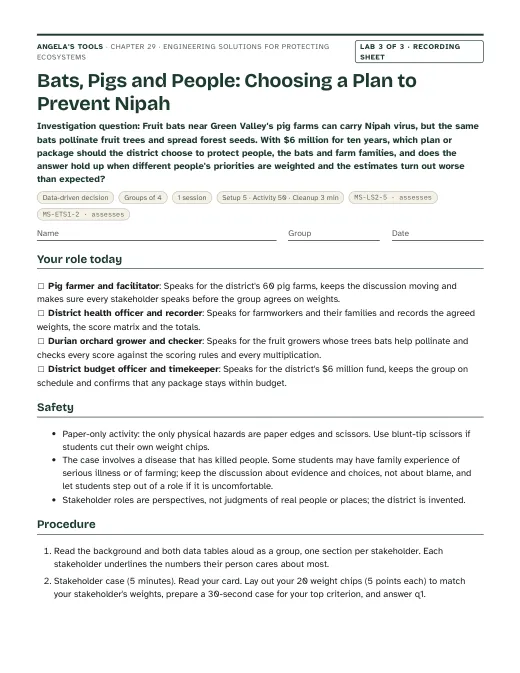
First page of the Bats, Pigs and People: Choosing a Plan to Prevent Nipah recording sheet
Lab 3 · Data-driven decision

Bats, Pigs and People: Choosing a Plan to Prevent Nipah

Fruit bats near Green Valley's pig farms can carry Nipah virus, but the same bats pollinate fruit trees and spread forest seeds. With $6 million for ten years, which plan or package should the district choose to protect people, the bats and farm families, and does the answer hold up when different people's priorities are weighted and the estimates turn out worse than expected?

Groups of 41 session50 min activityEst. 2 to 4 per class (estimate)Case file: background, the two data tables and the scoring rulesStakeholder cards (pig farmer, health officer, orchard grower, budget officer)Weight chips: paper squares worth 5 points each MS-LS2-5 · assessesMS-ETS1-2 · assesses

Teacher guidance

Suggested sequence (8 steps)
  1. Period 1: Presentation slides 1-8 (the lynx-and-human phenomenon, the hare and lynx waves, population milestones, why wild populations fall and why the human line has not, first check). W1 phenomenon worksheet: Parts A and B in class, Parts C and D for homework.
  2. Period 2: Lab 1 session 1, The Lake Can Give Ten: Part A runs the otter rule and the village rule on identical lakes; Part B compares a slowly growing village with one whose fish per family doubles. Groups post their tipping years on the class chart. W5 data worksheet (the fur records) for homework.
  3. Period 3: Slides 9-18 (total use equals population times per capita use, the per capita check, the Lake Malawi chain, the six disruptions and their vocabulary, the hardest-to-undo discussion, criteria and constraints, the sorting check). W2 vocabulary for homework.
  4. Period 4: Lab 1 session 2: groups test solution cards and two-card packages against three criteria and an 8-coin budget and compare designs class-wide. W3 reading on nets and by-catch for homework, to prepare for Lab 2.
  5. Period 5: Lab 2, Spare the Snail-Eaters: groups measure the pasta fish, write measurable criteria, build a string-mesh lift net, run three hauls, modify once and add results to the class selectivity graph. W6 CER (coffee farm designs) for homework.
  6. Period 6: Slides 19-22 (the Long Island Sound test-compare-adjust cycle and its data, the California drift gillnet connection, the should-we-remove-the-bats discussion), then the W8 six-pressures jigsaw for the rest of the period; students finish its individual section at home. W4 diagram worksheet for homework.
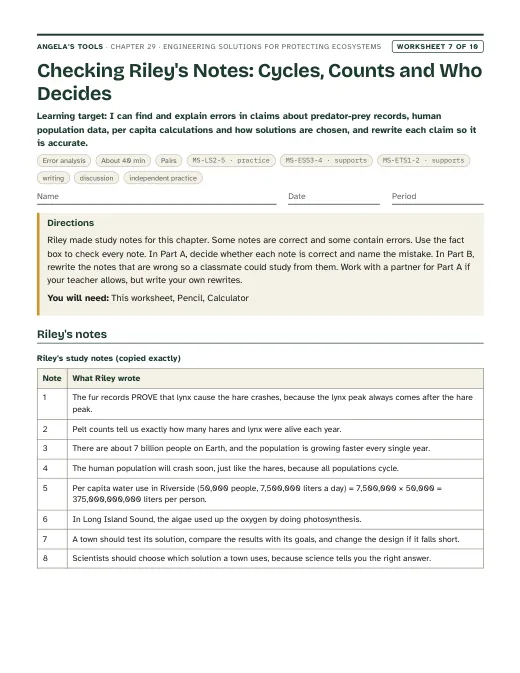
  7. Period 7: Lab 3, Bats, Pigs and People: stakeholders negotiate weights with chips, score five plans for preventing Nipah in an invented farming district, compute weighted totals, recheck the ranking under every stakeholder's weights and under worst-case estimates, and recommend a plan or package within the budget. W7 misconception repair for homework (it draws on the Long Island Sound correction and the who-decides discussion).
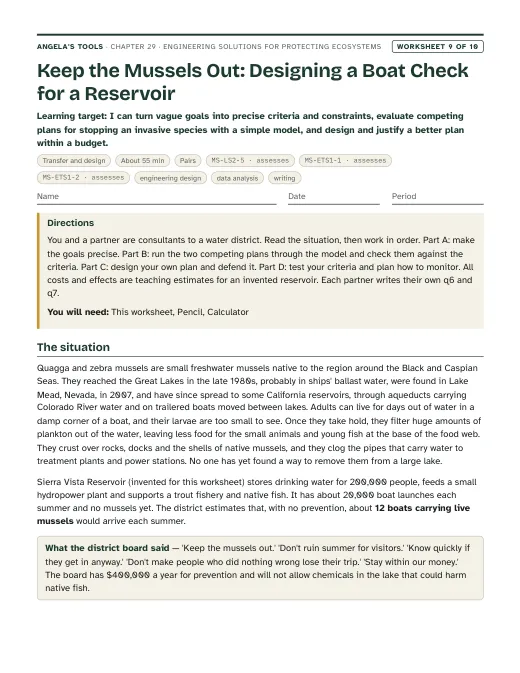
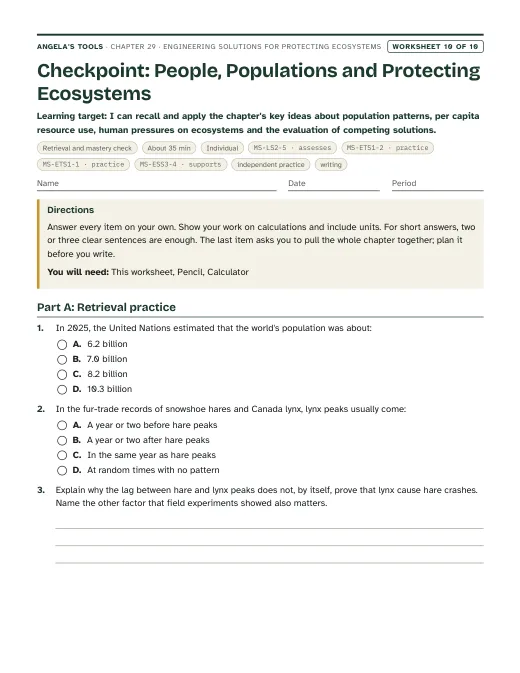
  8. Period 8: Slides 23-27 (the matrix task, the science-and-values check, the misconception, synthesis, exit ticket). W10 mastery as the quiz; the slides take about 28 minutes, so if the period runs short skip the exit ticket (W10 covers the same ideas) or let students finish W10 q12 at home. W9 transfer (a boat check for a reservoir) as a take-home design task or extension.

Materials overview: No flames, heat sources, chemicals or live organisms. Lab 1 uses dried beans or paper counters as fish, cups, a printed rule card, regrowth table and solution cards, and a calculator. Lab 2 uses dry rigatoni and ditalini pasta (or two sizes of plastic beads), cotton string, masking tape, rulers, blunt scissors, plastic tubs and cardboard frames the teacher cuts in advance. Lab 3 is paper only: the case file, stakeholder cards, scoring rules and a calculator. Each lab lists an estimated cost with its basis; the three together come to roughly $16 to $26 per class, including printing.

Common misconceptions (6)
“The human population is growing faster every year.”
Why it happens: The total keeps climbing, the population graph looks steeper and steeper, and the textbook says growth is continuing at an increasing rate.
Correction: The total is still rising, but the growth rate peaked at about 2 percent a year in the 1960s and is now under 1 percent a year. Going from 7 to 8 billion took 12 years; the UN expects 8 to 9 billion to take about 15. The UN projects a peak of about 10.3 billion in the mid-2080s.
“If the population stopped growing, our impact on ecosystems would stop growing too.”
Why it happens: Students hear 'more people, more impact' and stop at population size.
Correction: Total use equals the number of people times the use per person, and how a resource is produced matters too. If each person uses more, impact grows even with a steady population; if technologies are engineered to use less or harm less, impact can fall even while population rises. In Lab 1 a village of only 15 families that doubled its use per person collapsed the lake sooner than a fast-growing village.
“A renewable resource such as fish or forest cannot run out.”
Why it happens: 'Renewable' sounds like 'unlimited', and a lake or forest looks big.
Correction: A renewable resource renews at a limited rate, and the rate depends on how much is left. Harvest faster than that rate and the stock shrinks; a smaller stock then regrows even more slowly, so decline can speed up suddenly. That is over-exploitation.
“Any species from somewhere else is an invasive species.”
Why it happens: 'Non-native' and 'invasive' are used as if they mean the same thing.
Correction: Invasive means two things together: people moved it to a new place, and it causes harm there. Many crops and garden plants come from other continents without spreading out of control or harming ecosystems.
“The lynx and hare cycle happens simply because lynx eat hares until the hares are gone.”
Why it happens: Predator-prey graphs are often taught as a two-species story, and the lynx curve trails the hare curve.
Correction: Lynx numbers follow hares, but hares are eaten by many predators and also face poorer winter food when they are abundant. Field experiments in the Yukon suggest predation and food act together, and scientists still debate the details. The famous graph also comes from fur-trade records, which depend on trapping effort and fur prices.
“Science tells us which solution to choose.”
Why it happens: Science is presented as the source of right answers, and a decision matrix produces a single top score.
Correction: Science predicts what each option is likely to do, with some uncertainty. Choosing means deciding how much each outcome matters, such as farm income versus fruit bats, and those weights come from people's values. Change the weights and the winner can change.
Differentiation suggestions (5)
  • Multilingual learners: Pre-teach per capita, criteria, constraint, tradeoff and by-catch with a picture card each (a pie cut into equal slices, a checklist, a fence, a balance scale, a net with a turtle). Provide frames: 'Total use goes up when ___ or when ___.' 'A criterion is ___; a constraint is ___.' 'I chose ___ because the data showed ___, but it costs ___.' Stakeholder cards in Lab 3 can be read aloud in pairs.
  • Students who need more support: In Lab 1 give the first four rows of each table already filled in and a laminated rule card with the four steps numbered; in Lab 2 supply a mesh guide card with lines drawn at 8, 10, 12, 14 and 16 mm; in Lab 3 give the score matrix with one proposal fully scored as a model and a multiplication grid for the weighted totals.
  • Students ready for extension: Ask them to find the smallest change to the Lab 1 regrowth table that would let the fast-growing village keep the lake at 20 or more at the end of every year for 20 years with no cards (it takes an almost empty lake regrowing 16 fish a year, more than a half-full lake does, which no real fish population can do; explaining why is the point); to design a turtle-escape grid for a shrimp net in Lab 2; or to write their own scoring rule for a new Lab 3 criterion, such as animal welfare or forest regrowth, and show whether it changes the winner.
  • Students who need movement or alternative output: Run Lab 1 Part A as a whole-class game: students are otters or village families who step into the lake circle to collect a bean each year, with a 'reeds' zone the last four beans hide in. Accept a recorded spoken explanation or a labeled photo of the net and the class graph in place of written answers.
  • Students with limited fine-motor control or low vision: Use large dried lima beans or counters for Lab 1 and a muffin tin for the lake so counting is by cup; in Lab 2 let the student direct string placement and spacing while a partner tapes, and use rigatoni and large beads in high-contrast colors; print Lab 3 tables in large type.
Accuracy notes: where the textbook simplifies (14)
  • Population figures are dated: Section 1 (p. 388) says there are 'well over 7 billion' people and predicts 8 billion 'by around 2025'. The United Nations marked 8 billion on 15 November 2022, and its World Population Prospects 2024 puts the 2025 population at about 8.2 billion. Every slide and lab here states the source year with the number. The same paragraph says 1927 came 130 years after 1800; it is 127. The UN dates the first billion to about 1804, so 'around 1800' is fine.
  • Growth rate: p. 388 says the population is still growing at an increasing rate. The total is rising, but the growth rate peaked at about 2 percent a year in the 1960s and is now under 1 percent a year. The UN expects 9 billion around 2037 and a peak of about 10.3 billion in the mid-2080s. Teach 'still rising, but more slowly'.
  • Lynx and hare: the textbook's phenomenon says 'lynx and rabbit', but the lynx's prey is the snowshoe hare, a hare rather than a rabbit. The classic graph is built from Hudson's Bay Company fur-trade records of pelts sold (compiled by Elton and Nicholson, 1942, with hare figures gathered from several sources by MacLulich, 1937), so the numbers also reflect trapping effort, fur prices and changes in where furs were collected. The cycle of roughly ten years is confirmed by modern field studies; its causes are debated. Large experiments in the Yukon point to predation and food supply acting together (Krebs and colleagues, 2001). Slide 4 uses a simulated dataset shaped like the records, labeled as such.
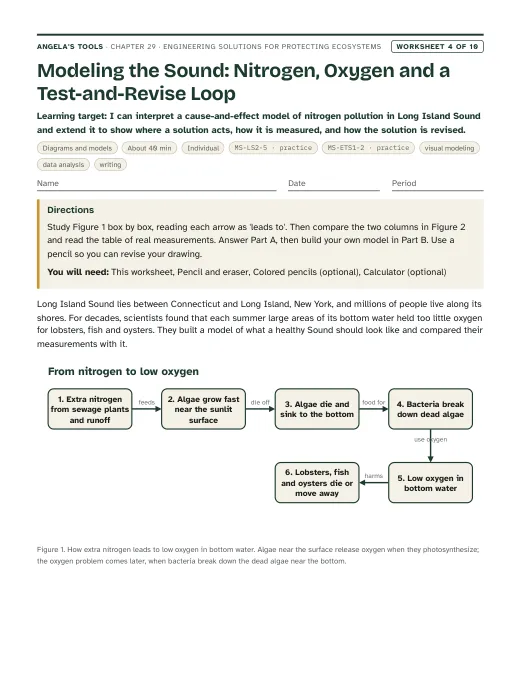
  • Photosynthesis does not remove oxygen: p. 398 says producers such as algae 'extract' oxygen during photosynthesis. Photosynthesis releases oxygen. Low oxygen in nutrient-polluted water comes mainly from bacteria decomposing large amounts of dead algae, plus respiration by living things, and it collects in bottom water in summer. Slide 20 teaches the corrected chain.
  • Key Science Concept graphs (p. 390): the panel titled 'Mineral Consumption' actually plots fertilizer use per hectare of farmland; the cultivated-land values must be millions of hectares; and fresh water per person falls mainly because a roughly fixed renewable supply is shared by more people. The chapter does not quote values from these panels.
  • Sea level (Figure 7, p. 396): the caption's numbers do not match the graph or current assessments. NOAA reports a global rise of about 21 to 24 cm since 1880 and expects about 25 to 30 cm (10 to 12 inches) more, on average along U.S. coasts, between 2020 and 2050. The chapter speaks only of a range of predictions that widens with time.
  • Lake Malawi (p. 391): the chain from overfishing to more snails to more bilharzia is supported by correlational field evidence (Stauffer and colleagues, 2006: infection was lower where snail-eating fish were more common), but the textbook's statement that larger-mesh nets were adopted and then reduced infections is not documented in that study. Present the net solution as the lesson's example of a design that fits the constraints. Bilharzia is schistosomiasis; the parasite is a blood fluke whose larvae leave infected snails and burrow through the skin of people in the water.
  • Nipah virus (p. 393): WHO and CDC describe fruit bats as the natural host and pigs as the animals that passed the virus to farmworkers in the 1998-1999 Malaysia outbreak, in which more than 100 people died. Neither says communities had just moved into the forest. The chapter describes only the bat-to-pig-to-person route and the prevention steps. WHO reports no approved vaccine or drug for people and advises protecting pig feed and sheds from bats; it does not recommend killing bats, and bat experts warn that driving a roost away can move the bats rather than remove the risk. Flying foxes help pollinate durian (Aziz and colleagues, 2017), so Lab 3 counts them as providers of ecosystem services.
  • Asian carp (p. 395): the U.S. Fish and Wildlife Service says silver carp were imported in the 1970s for fish farms and wastewater ponds and escaped during floods, rather than being released into lakes. Federal agencies now use the name 'invasive carp', and the group includes several species with different diets. Whether the Chicago-area electric barriers will keep carp out of Lake Michigan long term is still uncertain.
  • Plastics (p. 392): most plastics do not disappear; they break into smaller and smaller pieces (microplastics, under 5 mm). Many products labeled biodegradable break down only in industrial composting facilities, not in the ocean. The 2014 sea-turtle figure comes from a single study and is not used here.
  • Coffee (p. 394): coffee plants are botanically shrubs, though the lesson calls them trees. The claim that 'most' coffee is grown without shade is not verified here, so the chapter says only that some forest is cleared for full-sun coffee.
  • Long Island Sound (pp. 397-398): after nitrogen limits at wastewater plants, the Long Island Sound Partnership reports the summer low-oxygen area fell from an average of 208 square miles (1987-1999) to 83 square miles (2021-2025). Lobsters have not recovered mainly because warmer water and other stresses also harm them (NOAA Fisheries). The textbook's 23 million residents and 'more than twice as much energy' per person are figures from when the book was written.
  • Night-time satellite images (p. 389) show where people live and use electricity. They are indirect evidence of human activity, not a measurement of ecosystem damage.
  • Teaching models: the Lab 1 regrowth table, solution cards and results, the Lab 3 Green Valley District case file and all of its numbers (its background facts about Nipah virus and fruit bats are real), and the slide 23 scores are invented for teaching and labeled simulated. Lab 2 pasta sizes vary by brand, so groups measure their own pieces.

Review status: reviewed · 2026-10-19 · Standards aligned: W9 genuinely assesses MS-ETS1-1 (students write measurable criteria from vague goals and test whether C1 is strict enough) and MS-ETS1-2 (two plans run through one model and checked against every criterion and the budget), so chapter.json now lists both as assesses with notes naming W9 and Lab 3; Lab 3's MS-ETS1-2 role raised to assesses for the same reason. The chapter's MS-LS2-5 note no longer claims Lab 2 assesses (Lab 2 marks itself practice). MS-ESS3-4 is supports with the Grade 8 label everywhere; MS-LS2-1 supports on W1 and W5; caGrade present and matching on every entry. Slide links 6, 7, 12, 20, 21 and 22 checked against the worksheets as written and all match (W5 fur records and Krebs test, W1, W3 nets and TEDs, W4 Long Island Sound, W3, W7 note 8 and Lab 3). Slide 25 re-pointed from W7 to W5 q10 and W10 q12. Slide 23 notes rewritten so the matrix task follows Lab 3 as the sequence has it; slide 24 notes corrected to the farm-income weight change from 1 to 3; misconception watches added to slides 16, 21 and 22. Sequence fixed: W7 needs the Long Island Sound correction and the who-decides discussion, so it moved to Period 7 homework and W6 to Period 5; Period 1 splits W1 between class and home; Period 8 notes the time budget. Evidence of learning now names W8 Part A. Numbers verified: UN milestones (8 billion on 15 November 2022, about 8.2 billion in 2025, 9 billion around 2037, peak about 10.3 billion in the mid-2080s, growth peaking above 2 percent in 1963 and below 1 percent since 2020); Krebs et al. 1995 (2, 3 and 11 times); LIS Partnership hypoxia 208 to 83 square miles (60 percent); TED rules (late 1980s; new designs must exclude at least 97 percent in testing, wording tightened in W3); WHO no approved vaccine or drug and pig feed and sheds protected from bats; CDC more than 300 ill and more than 100 deaths; California drift gillnet law (2018, permits ended 2024), the December 2022 federal phase-out and 2023 deep-set buoy gear rule. Lab 1 re-run independently from its rules: Part A, B1, B2, all five cards, all two-card packages and the 20-year extension match the reference values. Lab 3 matrix recomputed: scores, practice totals, stakeholder winners and worst-case totals all match; one q5 example was wrong (E scores 310 under the example weights, ahead of A) and is fixed. All W1-W10 numeric, mc, true/false, fill and table keys re-solved (W6 net incomes, W9 model 3.6 and 0.9 launches and the no-package-within-$400,000 result, W10 weighted totals); keys were correct. Accuracy fixes: Lab 3 no longer says Indian outbreaks spread mainly through date palm sap (WHO gives food and person-to-person routes); W9 notes that California's quagga mussels spread through Colorado River aqueducts as well as on boats; W9's budget constraint now allows the fee Part C invites; the differentiation extension's regrowth claim corrected after testing (a table only works if an almost empty lake regrows faster than a half-full one). Lab cost bases now count recording-sheet printing, and the chapter total reads $16 to $26. Originality: no 6-word runs shared with the lesson text outside section titles; the passage in W3 is 652 words. Slide text limits, diagram fields and answer-key coverage all pass.

Source references

Verified against the student edition of Bring Science Alive! 7th Grade Integrated (Student Edition). Printed page numbers appear in the book; PDF pages are the physical pages of the 524-page scan (printed + 36). The textbook is not reproduced on this site.

SectionPrinted pagesPDF pagesUsed for
Introduction: divers placing young corals on a reef frame, the lesson question, vocabulary and standards box386, 387422, 423Lesson question, vocabulary list, the publisher's standards (MS-LS2-5, MS-ESS3-4, ETS1.B and ETS1.C), and the idea that people can both damage and restore ecosystems (slide 1, chapter overview). The lynx-and-hare phenomenon comes from the segment's lesson list, recorded in the curriculum inventory.
1. Predicting the Impact of Human Populations on Ecosystems388, 389424, 425Population growth since 1800, per capita use, demand on ecosystems (slides 5, 7, 9-11, Lab 1); dated population figures corrected in accuracy notes.
Key Science Concept: Human Populations Are Changing Natural Resources390426The link between population, per capita consumption and resource loss (slide 9, Lab 1 Part B); graph labels corrected in accuracy notes.
2. Over-Exploitation: Overfishing Changes Ecosystems (Lake Malawi)391427The overfishing-snail-bilharzia chain and the constraints of low cost and ease of use (slides 12, 17, Lab 2 context, Lab 1 mesh card).
3. Pollution: Plastics in the Oceans392428Pollution as one of the six disruptions (slide 14); microplastics and biodegradable claims in accuracy notes.
4. Emerging Diseases: New Viral Infections (Nipah virus)393429Emerging disease definition and the bat-pig-person route; prevention steps as a constraint-friendly solution (slides 14, 15, 17); the basis of the slide 22-24 discussion, task and check and of the Lab 3 case.
5. Habitat Degradation: Coffee Agriculture394430Habitat degradation and the shade-coffee tradeoff (slides 13, 14, 17, 18).
6. Invasive Species: Asian Carp and the Great Lakes395431Invasive species definition and electric barriers as an engineered response (slides 14, 15); quagga mussels as a California example on slide 15.
7. Climate Change: Sea Level and Temperature Changes Affect Coastal Communities396432Climate change definition, models that predict a range of sea-level rise, and coastal planning (slides 14, 15).
8. Restoring Long Island Sound's Ecosystem (Engineering Design)397, 398433, 434Comparing measurements with a model of a healthy ecosystem, cutting nitrogen, monitoring and adjusting (slides 19-20); the oxygen error corrected in accuracy notes.
9. Science, Society, and You; Lesson Summary399435What science can and cannot decide (slides 22, 24, 26, Lab 3 analysis).

External references used for accuracy checks

Related chapters