Worksheet 1 · Phenomenon exploration
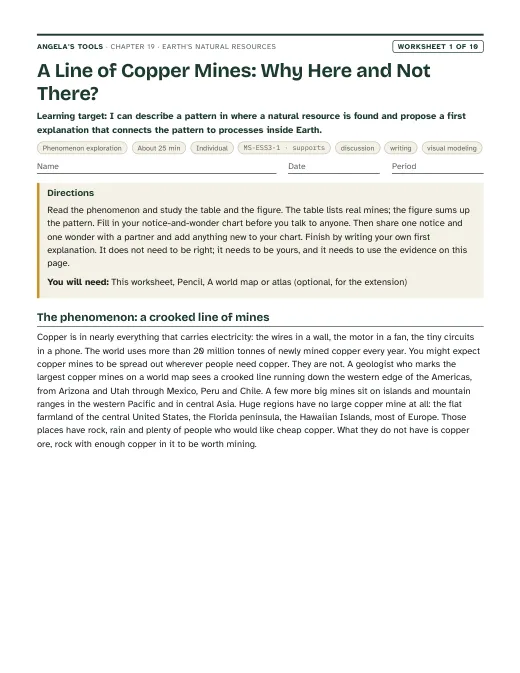
A Line of Copper Mines: Why Here and Not There?
I can describe a pattern in where a natural resource is found and propose a first explanation that connects the pattern to processes inside Earth.
Teacher only
 Angela's Wand
Chapter 19 · Unit 6: Processes that Shape Earth · Segment 3
Why are mineral, energy and groundwater resources concentrated in some places and missing from others, and what happens to that pattern as people use them?
Students figure out why Earth's resources are lumpy: gold runs in a narrow belt through the Sierra foothills, oil clusters under Kern County, geothermal steam rises north of San Francisco, and the biggest groundwater store in California sits under the Central Valley. Each resource formed only where a particular set of geoscience processes came together, often long ago, so a resource map is really a map of Earth's history. Students learn to read geologic clues as evidence, to sort resources by how fast nature replaces them compared with a human lifetime, and to see that pumping, drilling, mining and logging now redraw the map. The engineering strand uses Hoover Dam to show how a team weighs competing designs against criteria and constraints.
Estimated class time: presentation about 138 minutes · worksheets about 400 minutes in total · labs 4 sessions. Seven 50-minute periods: one for the phenomenon and the renewable/nonrenewable idea, two for groundwater and the aquifer decision lab, one for petroleum and ores with the treasure-map mystery, one for the cookie mine and the human-change idea, one for geothermal, soil, wood and the Hoover Dam engineering strand, and one for synthesis and mastery. Lab 3 spans two sessions; its second session can be homework-style data work if time is short.
Lay four maps of California on top of each other. The big historic gold mines form a thin stripe along the western foothills of the Sierra Nevada, with only scattered mines elsewhere. Oil wells crowd into the southern San Joaquin Valley around Kern County. Geothermal power plants cluster in a few spots, the largest at The Geysers north of San Francisco and in the Imperial Valley near the Salton Sea. The largest groundwater store lies under the flat Central Valley. None of these treasures is spread evenly, and the four patterns do not overlap. Something about each place made its resource form there and not next door. What was it?
Notice and wonder prompts
California NGSS, Grade 7 Preferred Integrated Course Model. Each entry says whether this chapter's work assesses the performance expectation, gives practice toward it, or supports it as background; the resource lists below repeat this for every worksheet and lab.
Construct a scientific explanation based on evidence for how the uneven distributions of Earth’s mineral, energy, and groundwater resources are the result of past and current geoscience processes.
Lab 1, Lab 3, W6 and W10 ask students to use geologic clues (past volcanic arcs, hydrothermal veins, buried marine sediments with traps, porous river gravels, rainfall and ancient climates) as evidence for where a resource is and is not, and to explain how pumping, drilling and mining are changing the pattern. That is the explanation the PE asks for, including its emphasis on limited supply and human removal.
Evaluate competing design solutions using a systematic process to determine how well they meet the criteria and constraints of the problem.
The lesson's engineering spread tells how a team compared five dam types for the Hoover Dam site. Lab 3 has students score three competing water-supply plans in a decision matrix, and W9 has them test four competing energy plans in a pass/fail matrix with 30-year costs; both end in a choice justified against stated criteria and constraints, which is evidence toward this PE.
Develop a model to describe the cycling of water through Earth’s systems driven by energy from the sun and the force of gravity.
Groundwater recharge is the water cycle seen from below: rain and snowmelt soak through soil into porous rock. This is a Grade 6 PE in the California sequence; this chapter uses it as background for recharge versus pumping and does not reteach or assess the whole cycle.
Assessment boundary: A quantitative understanding of the latent heats of vaporization and fusion is not assessed.
Develop a model to describe the cycling of Earth’s materials and the flow of energy that drives this process.
The four ways ore forms (crystals settling in magma, hydrothermal veins, sedimentary layering and deep weathering) are rock-cycle processes from the Grade 7 rock cycle lesson. The chapter uses them as the mechanism behind resource distribution; it does not ask students to name minerals.
Assessment boundary: Assessment does not include the identification and naming of minerals.
Earth's Natural Resources: why the treasure map is lumpy. Original, editable slides with speaker notes: a phenomenon opener, learning targets, the chapter's concepts with diagrams, vocabulary in context, 3 checks for understanding, 2 discussion prompts, an application task, a misconception check, a synthesis and an exit ticket.
Ten different tasks, one per instructional blueprint. Each has a student PDF (low ink, US Letter), an editable DOCX, an HTML preview, and a separate teacher answer key with reasoning.
I can describe a pattern in where a natural resource is found and propose a first explanation that connects the pattern to processes inside Earth.
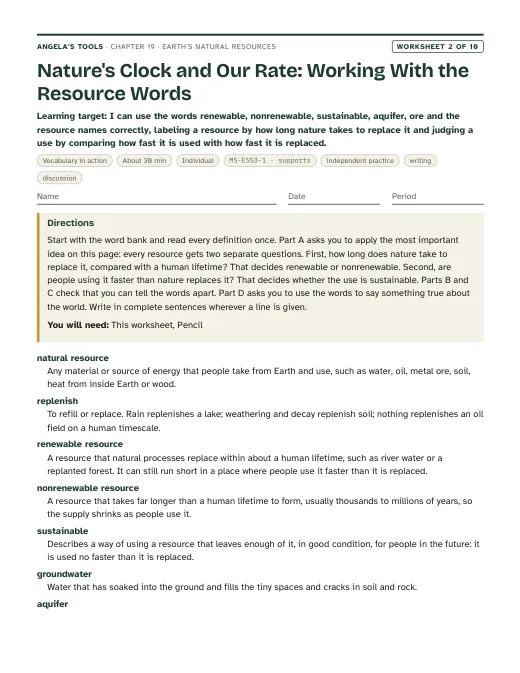
I can use the words renewable, nonrenewable, sustainable, aquifer, ore and the resource names correctly, labeling a resource by how long nature takes to replace it and judging a use by comparing how fast it is used with how fast it is replaced.
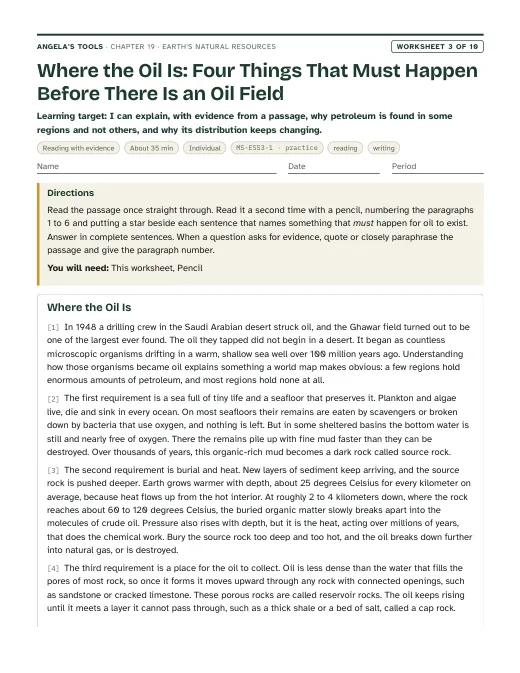
I can explain, with evidence from a passage, why petroleum is found in some regions and not others, and why its distribution keeps changing.
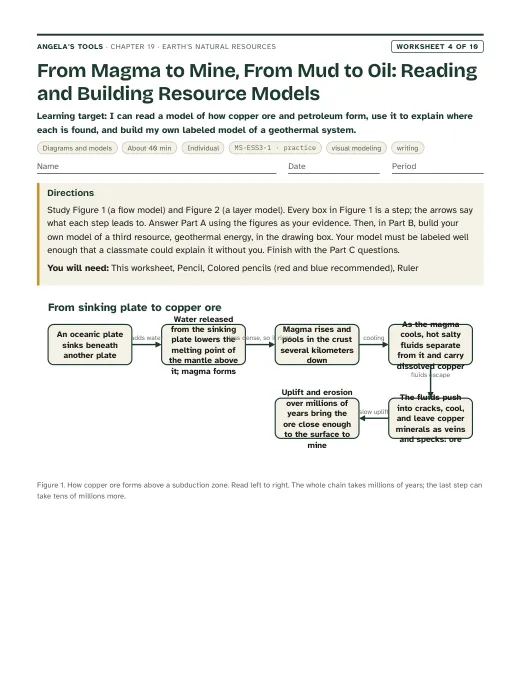
I can read a model of how copper ore and petroleum form, use it to explain where each is found, and build my own labeled model of a geothermal system.
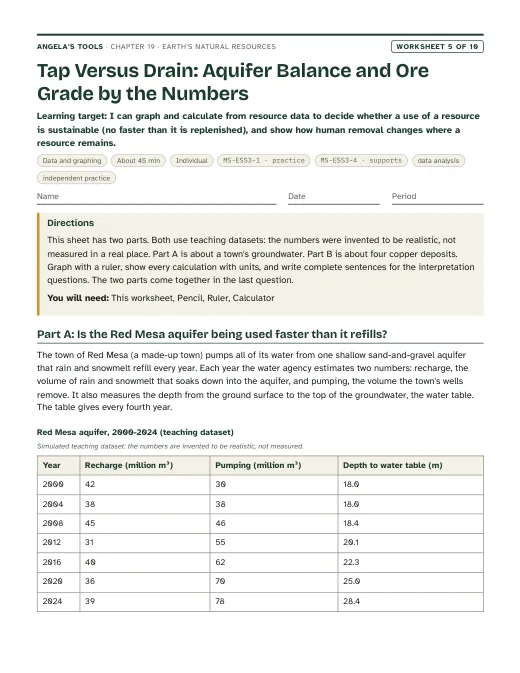
I can graph and calculate from resource data to decide whether a use of a resource is sustainable (no faster than it is replenished), and show how human removal changes where a resource remains.
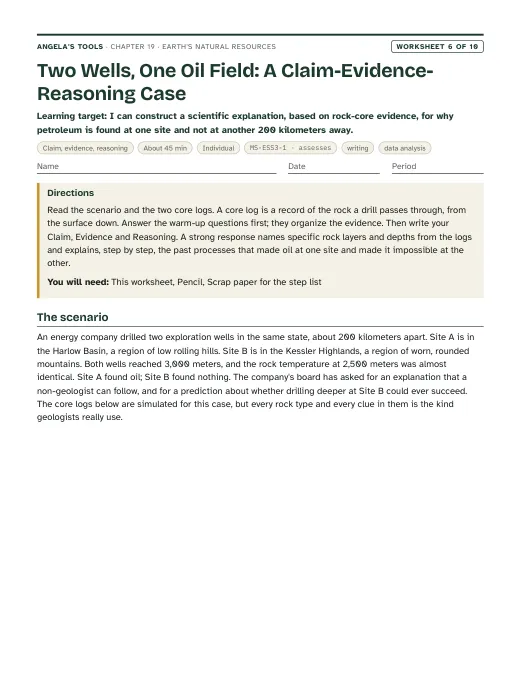
I can construct a scientific explanation, based on rock-core evidence, for why petroleum is found at one site and not at another 200 kilometers away.
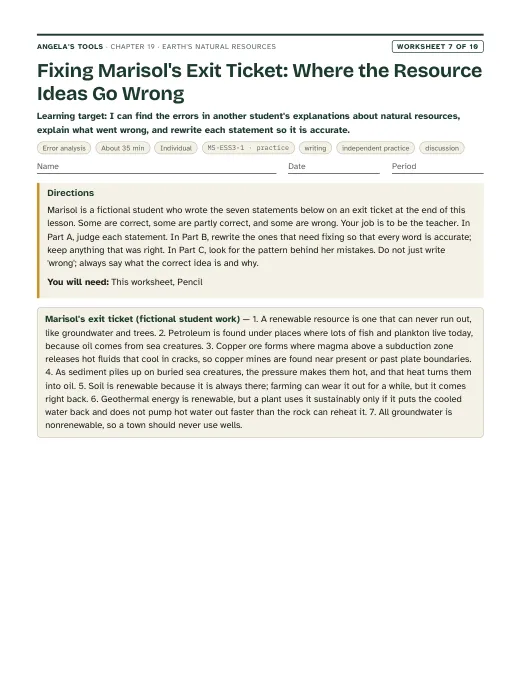
I can find the errors in another student's explanations about natural resources, explain what went wrong, and rewrite each statement so it is accurate.
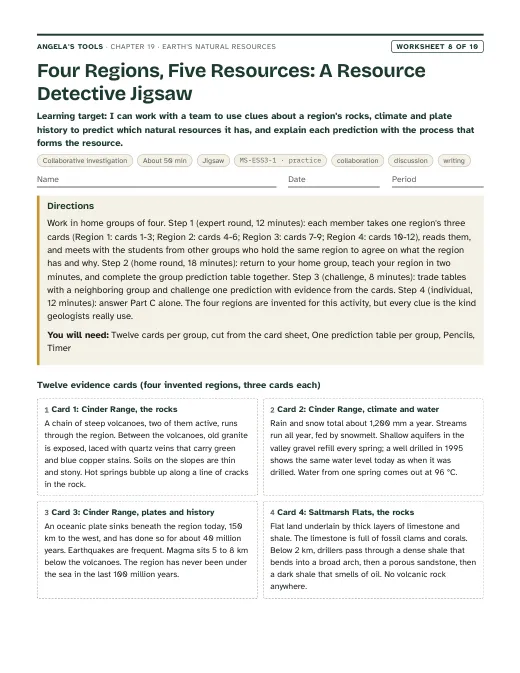
I can work with a team to use clues about a region's rocks, climate and plate history to predict which natural resources it has, and explain each prediction with the process that forms the resource.
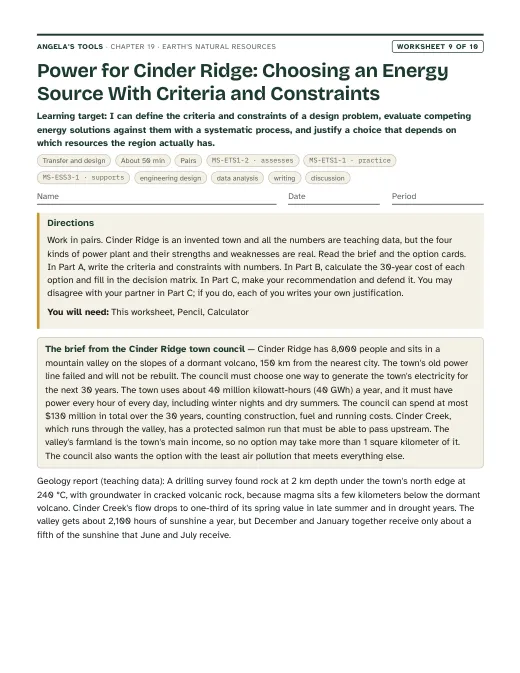
I can define the criteria and constraints of a design problem, evaluate competing energy solutions against them with a systematic process, and justify a choice that depends on which resources the region actually has.
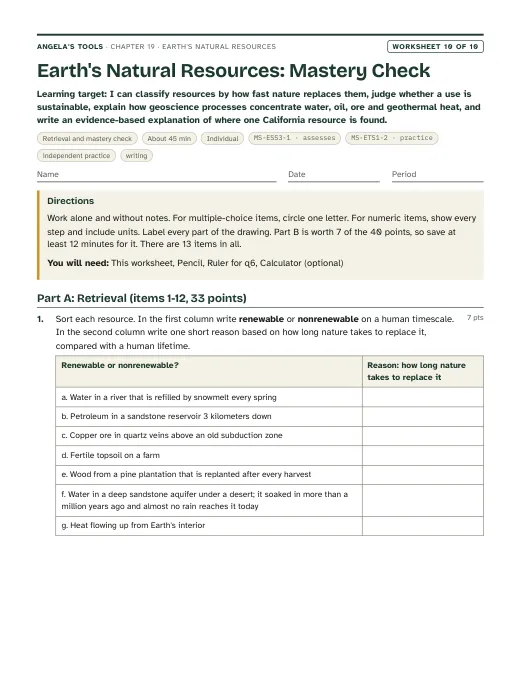
I can classify resources by how fast nature replaces them, judge whether a use is sustainable, explain how geoscience processes concentrate water, oil, ore and geothermal heat, and write an evidence-based explanation of where one California resource is found.
Three different investigation approaches. Each has a teacher guide (purpose, materials with quantities, estimated cost, prep, safety, procedure, expected observations, debrief, answer key, assessment criteria, accessibility adaptations, low-cost alternative) and a student recording sheet.
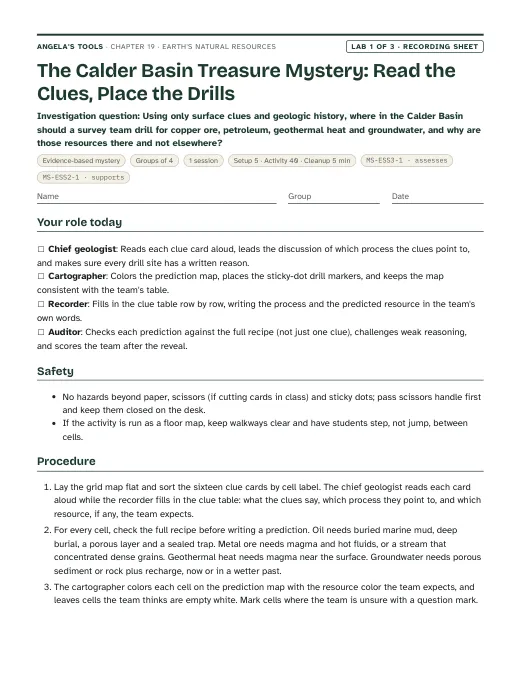
Using only surface clues and geologic history, where in the Calder Basin should a survey team drill for copper ore, petroleum, geothermal heat and groundwater, and why are those resources there and not elsewhere?
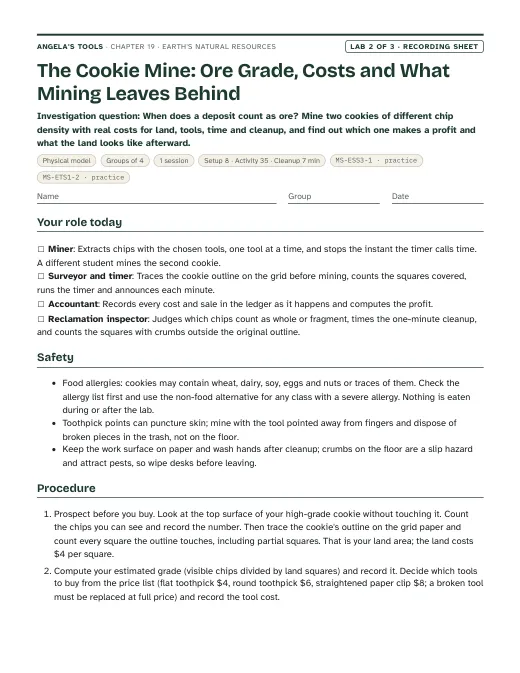
When does a deposit count as ore? Mine two cookies of different chip density with real costs for land, tools, time and cleanup, and find out which one makes a profit and what the land looks like afterward.
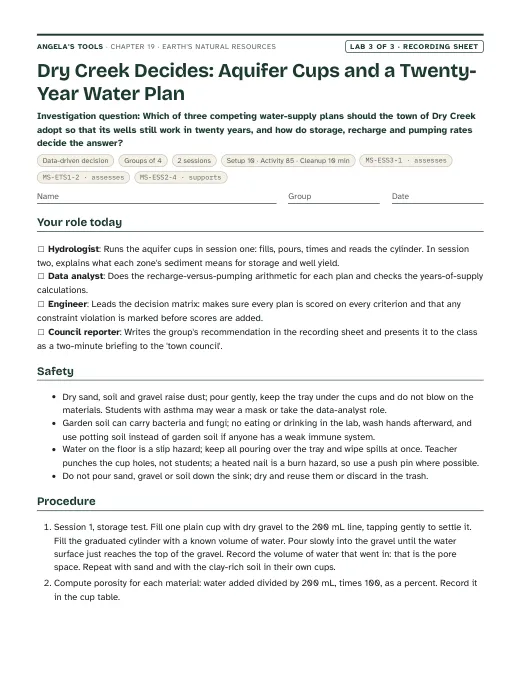
Which of three competing water-supply plans should the town of Dry Creek adopt so that its wells still work in twenty years, and how do storage, recharge and pumping rates decide the answer?
Materials overview: No chemicals or flames. Lab 1 uses printed grid maps, clue cards, sticky dots and answer envelopes. Lab 2 uses store-bought cookies of two chip densities (or play dough with beads), toothpicks, paper clips, centimeter grid paper and a timer; check allergy lists first. Lab 3 uses clear cups, pea gravel, play sand, clay-rich soil, measuring cups or graduated cylinders, a timer, and printed simulated town data. A wall map of California or a projected resource map supports the phenomenon.
Review status: reviewed · 2026-10-19 · Definitions unified on chapter.json: renewable or nonrenewable comes from how long nature takes to replace a resource compared with a human lifetime; sustainable or unsustainable compares the use rate with the replacement rate. W2 (title, word bank, Part A table, concept map, q1, q2, q10, q11, scaffold), W4 (q2, q8, q9, drawing key), W5 (q3, q6 now asks 'sustainable?' and then 'still renewable?'), W7 (statement 6 and every key, scaffold, notes), W8 (groundwater column, steps, q1, q3, q5, rubric, notes) and W9 q8 were rewritten from 'renewable for these users' to the two-question wording; W5 q6 and the slide 27 exit ticket now agree. Slide 27 exit item and slide 6 notes now give the aquifer's refill time so 'renewable?' is answerable from the definition; chapter misconception 2, accuracy note 2 and slides 10 and 13 no longer use recharge versus pumping to decide the label. Re-solved every numeric, multiple-choice, true/false and table item in W1-W10 and Labs 1-3. Fixed: Lab 3 q2 key (garbled drought arithmetic; Plan C loses about 4 Mm3 from Zone G, with the data-sheet cell made explicit), Lab 3 debrief (400 / 0.5 is about 800 years, not 'hundreds of centuries') and expected matrix totals (Plan C cannot exceed 13); W5 2004 water-table depth set to 18.0 m so depth agrees in direction with the net balance; W6 CER evidence item 5 no longer calls the limestone the deepest rock. Science: Mother Lode slide dated to the veins (about 150-100 million years ago) and tied to the Melones fault zone; phenomenon softened ('only scattered' gold mines elsewhere; geothermal plants in 'a few spots'); slide 8 notes corrected (groundwater is about 25 times surface water at USGS values; it supplies roughly 40 percent of world irrigation, not 'most farms'); ore enrichment 'fifty to more than a hundred times'; W8 card 4 reordered so the seal lies above the reservoir and the source rock below; W3 passage trimmed to 687 words and dated 'more than 160 years'. Lab 2 calibrated: prices assume 4-5 cm cookies (20-30 grid squares); a prep step tells teachers to halve larger cookies, and expected profits were restated. Lab 2 q7 now says recycling comes closest to renewal without making copper ore renewable. Standards: caGrade added to every lab standards entry; W9 MS-ETS1-2 raised to 'assesses' (a full systematic evaluation), matching chapter.json; chapter notes, evidence of learning, sequence and slide links corrected to describe W4, W6 and W9 as written (W9 is an energy decision, W6 is a two-well oil CER, W4 has no aquifer cross-section). Invented core logs (W6) and Lab 3 plan table moved into simulated dataset blocks. Six-word overlaps with the lesson text removed or reduced to short quoted fragments in teacher notes. California facts checked: Mother Lode and Sutter's Mill 1848, hydraulic-mining ruling 1884, Kern River field since 1899 and the Monterey Formation, San Joaquin subsidence near 9 m by 1970 and SGMA 2014, The Geysers decline and wastewater injection from 1997 and 2003. Labs remain physically untested.
Verified against the student edition of Bring Science Alive! 7th Grade Integrated (Student Edition). Printed page numbers appear in the book; PDF pages are the physical pages of the 524-page scan (printed + 36). The textbook is not reproduced on this site.
| Section | Printed pages | PDF pages | Used for |
|---|---|---|---|
| Introduction: four resources in one phone; the lesson question | 244, 245 | 280, 281 | Lesson question, vocabulary list, the publisher's standards box (MS-ESS3-1, MS-ETS1-2), the phone as a resource inventory. |
| 1. Fresh Water: water budget, renewable surface water, aquifers and the Great Artesian Basin | 246, 247 | 282, 283 | Water-budget bar diagram, aquifer layers diagram, recharge versus pumping, Lab 3 and W5 groundwater reasoning. |
| 2. Designing Hoover Dam: evaluating five dam designs against criteria and constraints | 248, 249 | 284, 285 | Engineering strand, criteria/constraints compare diagram, the decision-matrix method in Lab 3 and W9, environmental trade-offs. |
| 3. Petroleum: formation, Ghawar, uneven distribution | 250, 251 | 286, 287 | Petroleum formation flow diagram, the trap and reservoir idea, Lab 1 oil clue cards, the 'oil from dinosaurs' misconception. |
| 4. Geothermal Energy: The Geysers, flash-steam plants, plate boundaries | 252, 253 | 288, 289 | Geothermal content slide, the California connection, the 'renewable is not unlimited' misconception slide. |
| 5. Soil: formation by weathering and organic matter, fertility, Ethiopia | 254, 255 | 290, 291 | Soil and wood content slide, the biosphere resources in the renewable sort. |
| 6. Copper Ore and Key Science Concept: hydrothermal copper above sinking plates; the distribution summary | 256, 257 | 292, 293 | Four-ways-ore-forms diagram, Lab 1 ore clue cards, Lab 2 ore-grade idea, synthesis slide. |
| 7. Wood and Lesson Summary: forest distribution, harvest and replanting | 258, 259 | 294, 295 | Wood as a rate-dependent renewable resource, the summary used for the synthesis slide. |