Chapter 16 · Unit 6: Processes that Shape Earth · Segment 3

Earth's Tectonic Plates

What evidence convinced scientists that the continents move, and how did that evidence turn a hypothesis into the theory of plate tectonics?

MS-ESS2-3 · assessesMS-ESS2-2 · supportsMS-ETS1-1 · practice Textbook pp. 202–217 1 presentation · 10 worksheets · 3 labs

Overview

Students figure out how a strange idea, that whole continents move, went from a mapmaker's hunch to one of the best-supported theories in science. They weigh the clues Alfred Wegener gathered in 1912 (matching fossils, matching rock belts, continents that fit like torn pieces) and see why scientists still set his idea aside. Then they follow the new evidence of the 1900s: earthquake waves that revealed a rigid lithosphere over a slowly flowing mantle, belts of earthquakes and volcanoes that outline giant plates, sonar maps of a world-circling ridge and deep trenches, and drill cores showing that the seafloor gets older with distance from the ridge. Students practice the heart of MS-ESS2-3: reading fossil, rock, shape and seafloor data as evidence of past plate motion, and using rates to see how centimeters a year become oceans over millions of years.

Estimated class time: presentation about 145 minutes · worksheets about 400 minutes in total · labs 3 sessions. Seven 50-minute periods: one for the phenomenon and Wegener's evidence, one for the landmass-fit mystery, one for Earth's interior, earthquake belts and the seafloor, one for the paper seafloor model, one for drill-core data and the theory, one for boundaries, the California connection and the CER, and one for synthesis and mastery.

Phenomenon

A forest where nothing grows today

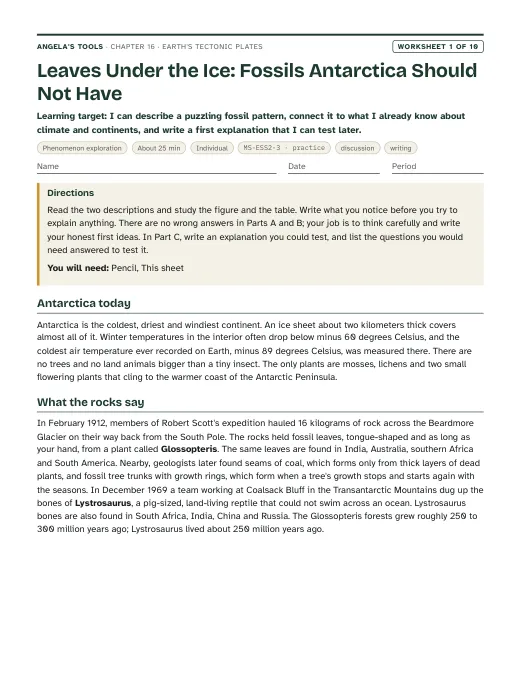
In the Transantarctic Mountains, about 85 degrees south, field teams have dug up fossil tree trunks with growth rings, broad fossil leaves of an extinct seed plant called Glossopteris, and bones of Lystrosaurus, a pig-sized land animal that could not swim across an ocean. The rocks are about 250 million years old. Today the site is buried in ice and spends months of every year in total darkness. The very same plant and the very same animal turn up in rocks of the same age in India, more than 10,000 kilometers away, and in southern Africa. How did a forest and a land-dwelling animal get to a place where nothing grows, and how did the same species end up on three continents separated by oceans?

Notice and wonder prompts

  • What would a plant with broad leaves need that Antarctica does not offer today?
  • How could a land animal that cannot swim leave fossils on three continents separated by thousands of kilometers of ocean?
  • Did the plants and animals move, did the climate move, or did the land itself move? What evidence would tell these apart?
  • What would you want to measure or collect to test your explanation?

Learning targets

  • I can explain Wegener's continental drift hypothesis and describe the fossil, rock and shape evidence he used to support it.
  • I can explain why scientists set continental drift aside and what kind of evidence was missing.
  • I can describe what seismic waves, earthquake and volcano maps, and sonar revealed about Earth's interior, its plates and the seafloor.
  • I can analyze seafloor age and distance data to show that new seafloor forms at a mid-ocean ridge and spreads outward.
  • I can distinguish criteria from constraints in the design of a research drill ship.
  • I can classify plate boundaries by motion and use a rate and a time to estimate how far plates move.

What shows the learning happened

  • A scored evidence table and sketch from Lab 1 showing which arrangement of simplified landmass shapes makes the most fossil and rock bands continuous, with a written justification.
  • A distance-versus-age graph from Lab 2 or Lab 3 with a computed spreading rate in km per million years and in cm per year, and a statement of what pattern the data would have to show if spreading were not happening.
  • A Claim-Evidence-Reasoning paragraph (W6) that uses at least two independent lines of evidence (fossils or rocks, continental shapes, seafloor structures or ages) to argue that the continents have moved.
  • A correct sort of criteria and constraints for a seafloor-sampling problem, with one original example of each (a sampling tool on slide 17, a drilling voyage in W9).
  • A short explanation of why Wegener's hypothesis was set aside and what the seafloor evidence added, written in the student's own words (W3, W10).
  • A rate-times-time calculation that converts a plate speed into distance over a million years, with units shown (slide 19, W10).

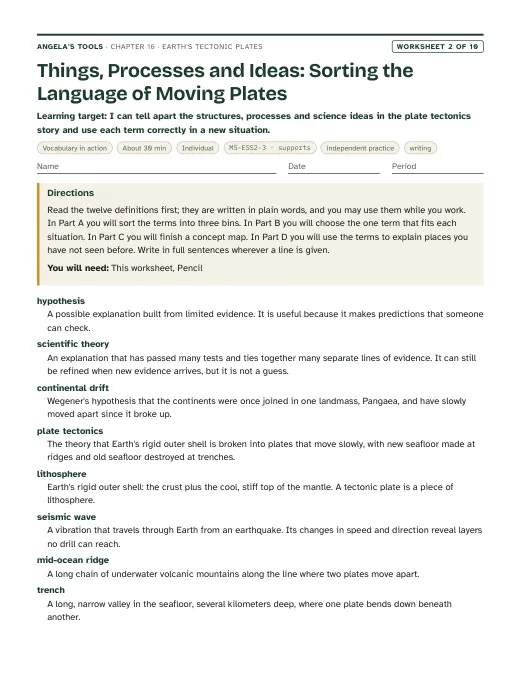
Key vocabulary 12 terms

hypothesisA possible explanation built on limited evidence that makes predictions you can test by observing or experimenting.Wegener's hypothesis predicted that rock layers on facing coasts should match, and geologists went looking to see whether they did.
continental driftWegener's hypothesis that the continents were once joined in one supercontinent, Pangaea, that broke apart, with the pieces slowly moving to their present places.Continental drift explained the fossil matches, but it could not say what force was pushing the continents.
lithosphereEarth's rigid outer shell: the crust plus the cool, stiff uppermost mantle. It is broken into tectonic plates.A plate is a piece of lithosphere, so it carries ocean floor and continental crust together as one rigid slab.
seismic waveA vibration that travels through Earth from an earthquake. Changes in its speed and direction reveal layers that no drill can reach.Seismic waves showed that the mantle is solid rock, yet below the lithosphere it is hot enough to flow slowly over millions of years.
mid-ocean ridgeA chain of underwater volcanic mountains that winds around the globe along the places where plates move apart and new seafloor forms.Drill cores showed the youngest seafloor sits right on the mid-ocean ridge and older seafloor lies farther away.
trenchA long, narrow valley in the seafloor, several kilometers deep, where one plate bends down beneath another.Earthquake belts and trenches line up around the Pacific because that is where old seafloor is sinking back into the mantle.
continental shelfThe shallow, submerged edge of a continent, the true outline of the landmass under the water.Matching the continental shelves of Africa and South America gives a tighter fit than matching their coastlines.
seafloor spreadingThe process in which plates pull apart at a mid-ocean ridge, molten rock rises to fill the gap and hardens, and the new seafloor moves outward on both sides.Seafloor spreading predicts that rock ages should increase in matching steps on both sides of a ridge.
subductionThe sinking of a denser plate beneath a less dense plate where the two converge, which carries old seafloor down into the mantle.Because subduction removes old seafloor at trenches, Earth does not grow even though new seafloor keeps forming.
scientific theoryAn explanation supported by a large body of evidence from many independent lines that accounts for many observations and makes successful predictions. New evidence can still refine it.Plate tectonics became a scientific theory when fossils, rock belts, earthquake belts and seafloor ages all pointed to the same moving plates.
plate tectonicsThe theory that Earth's lithosphere is divided into rigid plates that move slowly relative to one another, forming new seafloor at ridges and destroying old seafloor at trenches.Plate tectonics explains why volcanoes and earthquakes cluster in narrow belts: those belts are plate edges.
plate boundaryThe edge where two plates meet. At a convergent boundary they move toward each other, at a divergent boundary apart, and at a transform boundary they slide past each other.California's San Andreas Fault is a transform plate boundary where the Pacific and North American plates grind past each other.

Standards alignment

California NGSS, Grade 7 Preferred Integrated Course Model. Each entry says whether this chapter's work assesses the performance expectation, gives practice toward it, or supports it as background; the resource lists below repeat this for every worksheet and lab.

MS-ESS2-3Assesses: analyzing and interpreting fossil, rock, continental-shape and seafloor data as evidence of past plate motionCA Grade 7

Analyze and interpret data on the distribution of fossils and rocks, continental shapes, and seafloor structures to provide evidence of the past plate motions.

This is the lesson's performance expectation. Lab 1, Lab 3, W5, W6 and W8 ask students to read distributions of fossils and rock belts, the fit of simplified landmass shapes, and simulated seafloor age-distance data, and to argue from that data that plates have moved. Paleomagnetic stripes are mentioned only as history (teacher notes, the timeline slide and the W3 passage) and never assessed, in line with the assessment boundary.

Assessment boundary: Paleomagnetic anomalies in oceanic and continental crust are not assessed.

MS-ESS2-2Supports: the large-scale, slow end of geoscience processesCA Grade 7

Construct an explanation based on evidence for how geoscience processes have changed Earth’s surface at varying time and spatial scales.

Plate motion of a few centimeters a year is the slowest, largest process on the time-and-space scale this PE describes. The rate-times-time calculations in the deck and W9 build the idea that small yearly motions open oceans over millions of years, but the full explanation of surface change at many scales belongs to Lesson 11 and Lesson 17.

MS-ETS1-1Practice toward: sorting and stating criteria and constraints for a tool-design problemCA Grade 6-8

Define the criteria and constraints of a design problem with sufficient precision to ensure a successful solution, taking into account relevant scientific principles and potential impacts on people and the natural environment that may limit possible solutions.

The lesson's engineering spread on the research drill ship gives students a real case for telling requirements (criteria) from limits (constraints). The presentation (for a seafloor-sampling tool) and W9 (for a drilling voyage) have students sort and write both; this practices the PE rather than fully assessing it because the design problem is given to students rather than defined from scratch.

Science and engineering practices

  • Analyzing and Interpreting Data. Students score how well evidence bands line up across landmass joins (Lab 1), measure age-band distances on a paper seafloor (Lab 2), and compute spreading rates from simulated drill-core data (Lab 3, W5).
  • Engaging in Argument from Evidence. Students argue whether Wegener should have been believed in 1926, decide which fossil finds count as strong evidence, and write a CER (W6) that uses several independent lines of evidence for plate motion.
  • Asking Questions and Defining Problems. Students sort the drill ship's criteria and constraints, write their own for a seafloor-sampling tool (presentation slide 17), and set criteria and constraints for a drilling voyage (W9).

Disciplinary core ideas

  • ESS2.B Plate Tectonics and Large-Scale System Interactions. Maps of fossils, rock belts and seafloor features show that plates have moved great distances, collided and spread apart; the seafloor age pattern is the key data.
  • ESS1.C The History of Planet Earth. New seafloor forms continually at ridges and old seafloor is destroyed at trenches, which is why no ocean floor is older than about 200 million years while continents hold far older rock.
  • ESS2.A Earth Materials and Systems. Earth's interior and surface interact over scales from centimeters a year to the opening of an ocean, and the lithosphere moves over a hot, slowly flowing mantle.
  • ETS1.A Defining and Delimiting Engineering Problems. The drill ship story shows that precisely stated criteria and constraints made it possible to build a ship that could test seafloor spreading.

Crosscutting concepts

  • Patterns. Students find repeating patterns: same fossils on separated continents, earthquakes in narrow belts, seafloor ages rising in matching steps on both sides of a ridge.
  • Scale, Proportion, and Quantity. Students convert centimeters per year to kilometers per million years and reason about how a 1 meter paper model stands for thousands of kilometers of seafloor.
  • Stability and Change. Earth's surface looks fixed within a lifetime but has changed completely over hundreds of millions of years; students explain why Earth stays the same size while new seafloor keeps forming.

Presentation 27 slides

Earth's Tectonic Plates: the evidence that moved the continents. Original, editable slides with speaker notes: a phenomenon opener, learning targets, the chapter's concepts with diagrams, vocabulary in context, 3 checks for understanding, 2 discussion prompts, an application task, a misconception check, a synthesis and an exit ticket.

Worksheets 10 of 10

Ten different tasks, one per instructional blueprint. Each has a student PDF (low ink, US Letter), an editable DOCX, an HTML preview, and a separate teacher answer key with reasoning.

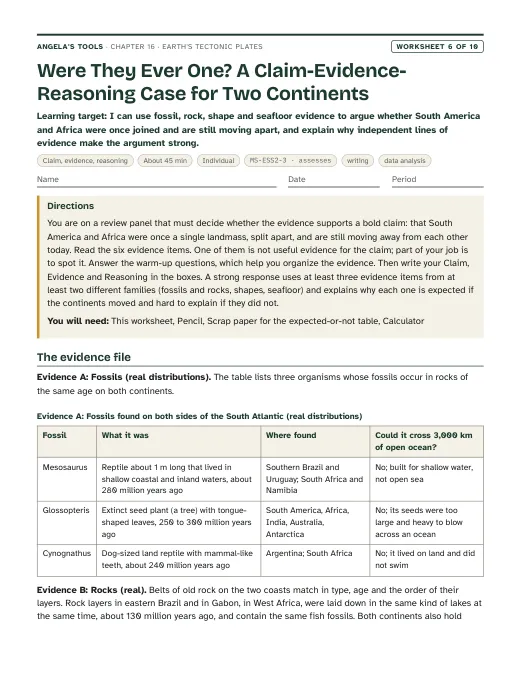
First page of Were They Ever One? A Claim-Evidence-Reasoning Case for Two Continents
Worksheet 6 · Claim, evidence, reasoning

Were They Ever One? A Claim-Evidence-Reasoning Case for Two Continents

I can use fossil, rock, shape and seafloor evidence to argue whether South America and Africa were once joined and are still moving apart, and explain why independent lines of evidence make the argument strong.

45 minindividualAssessmentWritingData analysis MS-ESS2-3 · assesses

Collaborative labs 3 of 3

Three different investigation approaches. Each has a teacher guide (purpose, materials with quantities, estimated cost, prep, safety, procedure, expected observations, debrief, answer key, assessment criteria, accessibility adaptations, low-cost alternative) and a student recording sheet.

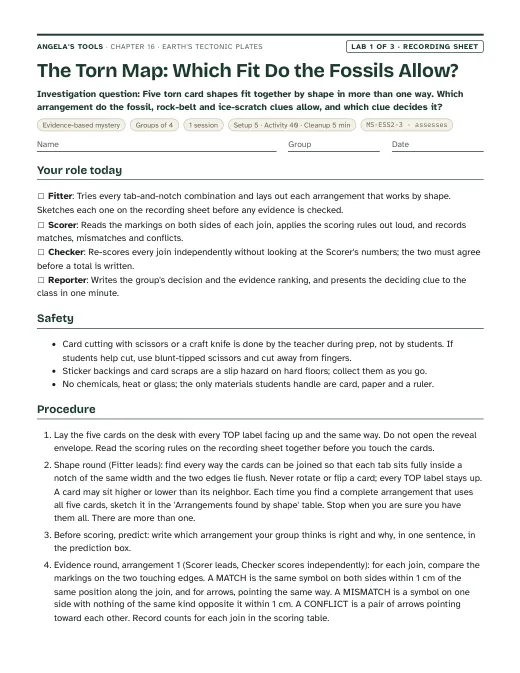
First page of the The Torn Map: Which Fit Do the Fossils Allow? recording sheet
Lab 1 · Evidence-based mystery

The Torn Map: Which Fit Do the Fossils Allow?

Five torn card shapes fit together by shape in more than one way. Which arrangement do the fossil, rock-belt and ice-scratch clues allow, and which clue decides it?

Groups of 41 session40 min activityEst. 8 to 12 per class, reusableCard-stock landmass set (five cards, A to E, cut and marked by the teacher from the template in the prep notes)Colored dot stickers, about 1 cm: green, red and blueBrown and black markers MS-ESS2-3 · assesses
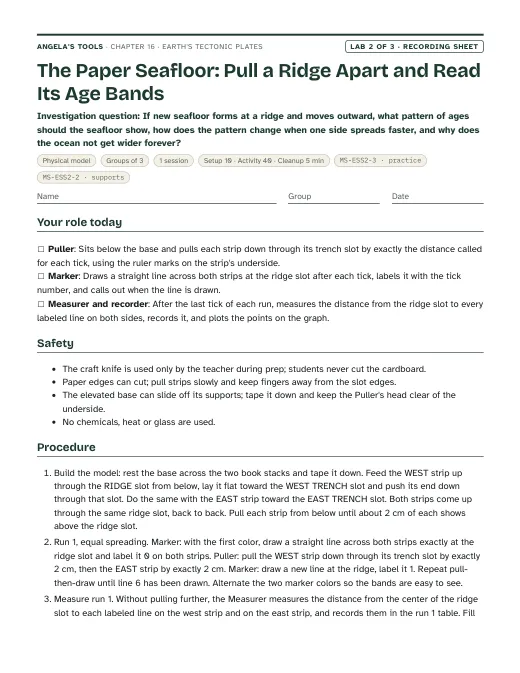
First page of the The Paper Seafloor: Pull a Ridge Apart and Read Its Age Bands recording sheet
Lab 2 · Physical model

The Paper Seafloor: Pull a Ridge Apart and Read Its Age Bands

If new seafloor forms at a ridge and moves outward, what pattern of ages should the seafloor show, how does the pattern change when one side spreads faster, and why does the ocean not get wider forever?

Groups of 31 session40 min activityEst. 5 to 8 per class, mostly reusableCorrugated cardboard base, about 36 cm by 20 cm, with three slots cut by the teacher (see prep)Adding-machine or receipt paper strips, 60 cm longWashable markers in two colors, plus a pencil MS-ESS2-3 · practiceMS-ESS2-2 · supports
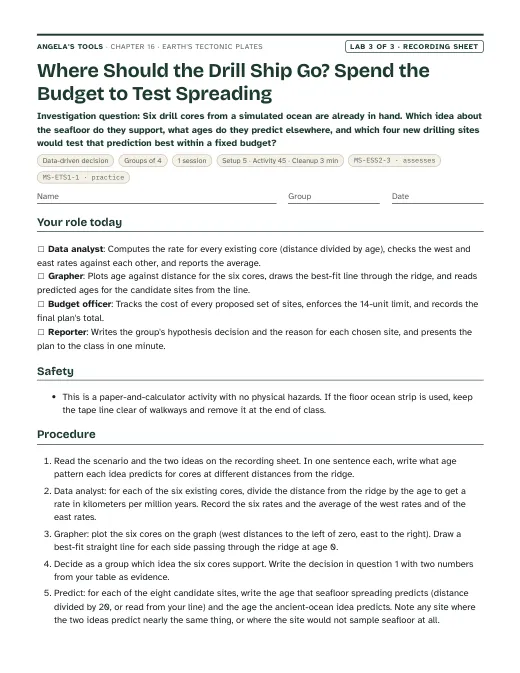
First page of the Where Should the Drill Ship Go? Spend the Budget to Test Spreading recording sheet
Lab 3 · Data-driven decision

Where Should the Drill Ship Go? Spend the Budget to Test Spreading

Six drill cores from a simulated ocean are already in hand. Which idea about the seafloor do they support, what ages do they predict elsewhere, and which four new drilling sites would test that prediction best within a fixed budget?

Groups of 41 session45 min activityEst. 1 to 2 per classRecording sheet with the simulated core data and candidate site listCalculatorRuler MS-ESS2-3 · assessesMS-ETS1-1 · practice

Teacher guidance

Suggested sequence (7 steps)
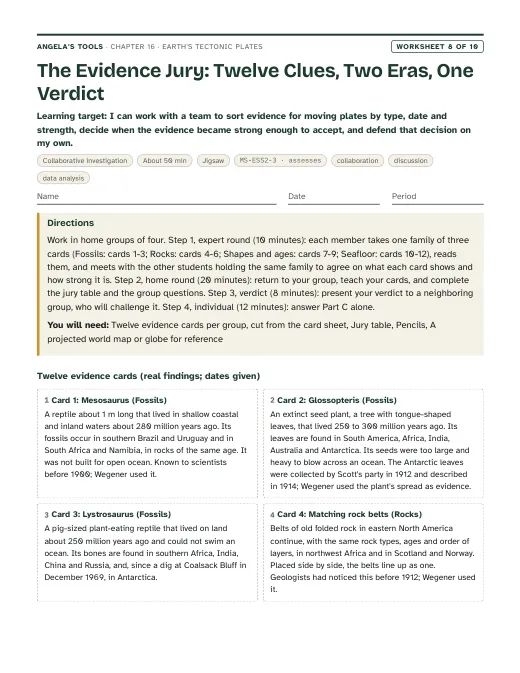
  1. Period 1: Presentation slides 1-9 (the Antarctic forest phenomenon, targets, Ortelius and Wegener, the four lines of evidence, why drift was set aside, the 1926 debate). W1 phenomenon worksheet as the opener; W2 vocabulary relationships to close.
  2. Period 2: Lab 1, the landmass-fit mystery (one session): groups fit simplified southern landmass shapes by outline, then by fossil, rock and glacial evidence, and score each arrangement. W8 collaborative evidence jigsaw can replace or follow the lab.
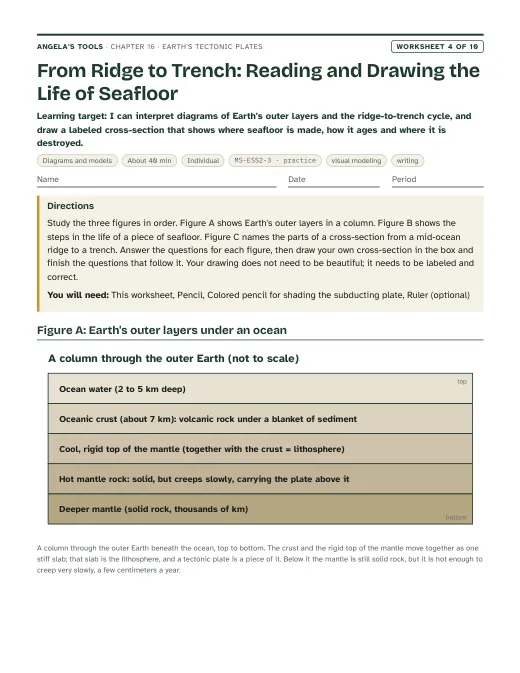
  3. Period 3: Slides 10-15 (seismic waves and the lithosphere, earthquake and volcano belts, sonar and Marie Tharp's maps, the four seafloor structures). W3 reading passage for homework or in class; W4 diagram interpretation of a ridge-to-trench cross-section.
  4. Period 4: Lab 2, the paper seafloor (one session): groups build a spreading ridge from paper strips, mark age bands, measure and graph distance against model age, and test an uneven pull. Slide 16 (the seafloor spreading prediction) opens the period.
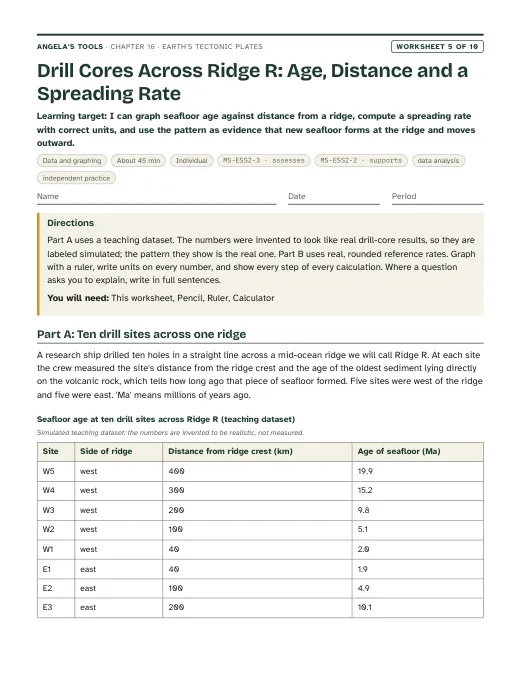
  5. Period 5: Slides 17-21 (drill ship criteria and constraints, the simulated core-age task, the rate check, from hypothesis to theory, the timeline). Lab 3, the drill-core data decision (one session), or W5 data worksheet if time is short.
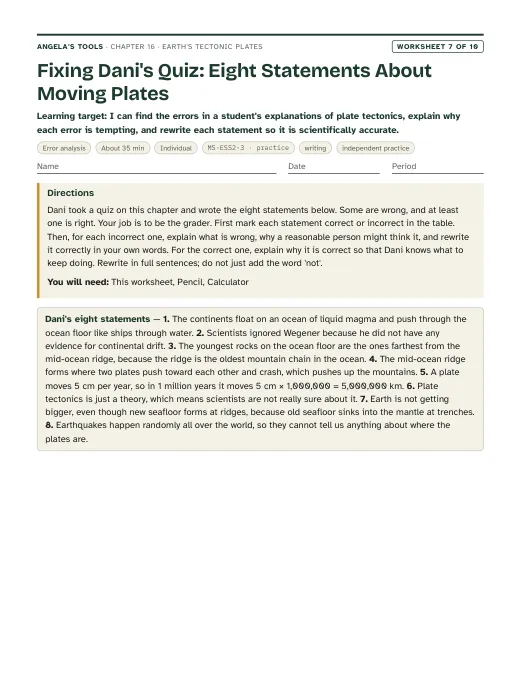
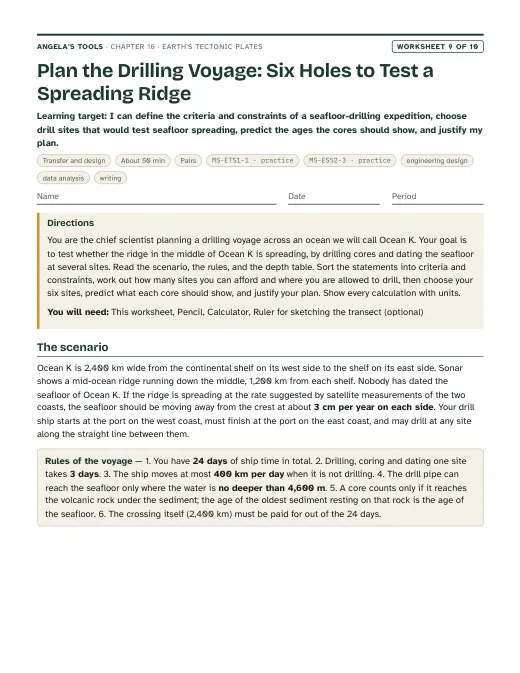
  6. Period 6: Slides 22-24 (boundary types and rates, the Pinnacles connection, the 'why is Earth not growing' discussion). W6 CER on evidence for moving continents as the written assessment; W7 misconception repair; W9 drill-ship transfer task for the engineering strand.
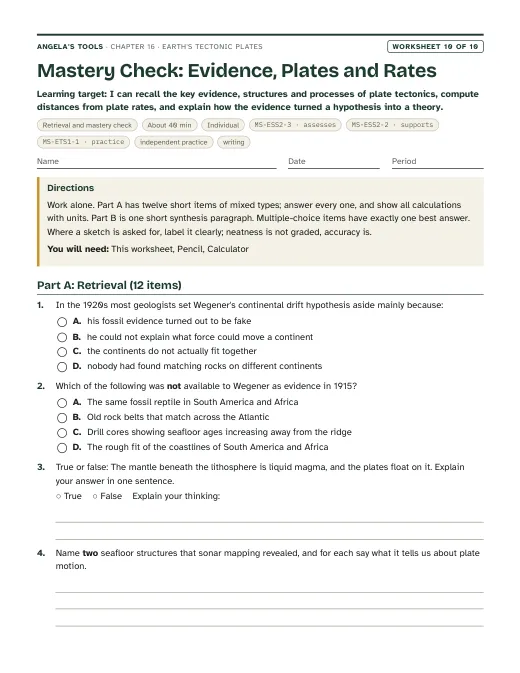
  7. Period 7: Slides 25-27 (misconception, synthesis, exit). W10 mastery as the quiz. Reteach from the exit-ticket piles.

Materials overview: No chemicals, no heat, no sharp tools beyond scissors. Lab 1 uses card stock, colored dot stickers and a printed evidence key. Lab 2 uses adding-machine paper, a cardboard sheet with slots, markers and rulers. Lab 3 is paper and calculator only. A wall map or globe and a projected plate map help every period. If a 'fossil' prop is wanted for the phenomenon, a photo of Glossopteris leaves and of a Lystrosaurus skull works; no specimens are needed.

Common misconceptions (6)
“Continents float on an ocean of liquid magma and plow through the seafloor.”
Why it happens: Diagrams show red layers under the crust, lava is the only mantle material students have seen, and 'drift' sounds like floating. The textbook says the mantle 'can flow' without saying it is solid.
Correction: The mantle is solid rock. Below the lithosphere it is hot enough to creep slowly, centimeters a year, like extremely stiff putty over millions of years. Continents do not move through the seafloor; the continent and the nearby seafloor ride together on the same rigid plate.
“Wegener was rejected because he had no evidence.”
Why it happens: Students assume that an idea that was turned down must have been weak, and the story is often told as one lone genius against everyone else.
Correction: Wegener had strong evidence from fossils, rock belts and continental shapes. What he lacked was a mechanism; the force he proposed could not move continents. Scientists set the hypothesis aside until seafloor evidence in the 1950s and 1960s supplied the mechanism.
“A theory is just a guess, so plate tectonics might easily be wrong.”
Why it happens: In everyday speech 'theory' means a hunch. Students also hear that scientists changed their minds about drift and conclude that science flips back and forth.
Correction: In science a theory is an explanation that has survived many tests and ties together many independent lines of evidence. Plate tectonics is supported by fossils, rock belts, earthquake belts, seafloor ages and direct satellite measurements of plate speeds. It stays open to refinement, such as the debate about which force moves plates most, but the core idea is as well established as any in Earth science.
“Plates are the same thing as continents, and the ocean floor is the gap between plates.”
Why it happens: World maps draw continent outlines, and the textbook's plate map still looks like a map of continents to many students.
Correction: Plates are pieces of lithosphere, which includes oceanic crust, continental crust and the rigid top of the mantle. Most plates carry both ocean floor and continent; the Pacific Plate is almost entirely ocean floor. Plate edges run through oceans and across continents.
“The oldest seafloor is always at a trench.”
Why it happens: The textbook's Key Science Concept says the oldest rocks are at the trenches, which is true in a Pacific-style ocean but not everywhere.
Correction: Seafloor gets older with distance from the ridge. Where there is a trench, the oldest seafloor sinks there. In the Atlantic there are almost no trenches, so the oldest seafloor lies against the continental shelves of the Americas, Africa and Europe.
“Plates move so slowly that they cannot make large changes.”
Why it happens: A few centimeters a year sounds like nothing, and students have no feel for a million years.
Correction: Rate times time: 2 cm per year is 20 km per million years. Over 100 million years that is 2,000 km, enough to open an ocean. Students should always multiply before deciding a change is small.
Differentiation suggestions (5)
  • Multilingual learners: Pre-teach six anchor terms (hypothesis, evidence, plate, ridge, trench, spreading) with a picture card set; let students label the Lab 1 sketch and the Lab 2 cross-section in their home language first; pair during the evidence-scoring so each piece of evidence is read aloud and explained before it is scored.
  • Students who need more support: Provide the Lab 3 rate table with the first row worked, a graph with axes already scaled, sentence frames for the CER ('Fossils of ___ are found in ___ and ___, which shows ___ because ___'), and a two-column criteria/constraints sort with a word bank.
  • Students ready for extension: Ask them to explain why the Atlantic's oldest seafloor lies beside the continents while the Pacific's lies at trenches, to estimate when the South Atlantic began to open from a rate and a half-width, or to research how GPS measures plate motion today and compare it with rates computed from seafloor ages.
  • Students who need movement or alternative output: Run the timeline as a floor line with students holding event cards; let the Lab 2 model be demonstrated live to the class instead of written up; allow the synthesis to be a 60-second spoken explanation or a labeled poster of the evidence.
  • Students with limited fine-motor control or low vision: Use large card pieces with raised sticker dots for evidence in Lab 1; let a partner pull the paper strips in Lab 2 while the student calls the tick and reads the ruler with a hand lens; provide the Lab 3 dataset in large print and accept rates computed for three cores rather than all six.
Accuracy notes: where the textbook simplifies (22)
  • Mantle state: the textbook says the mantle below the lithosphere 'is capable of flowing' (pp. 206, 217) without saying it is solid. Teach that the mantle is solid rock that creeps very slowly; it is not liquid magma, and plates do not float on a liquid.
  • Driving forces: the book presents mantle convection, seafloor spreading and subduction as the three processes that drive plate motion (p. 215). Current research treats the pull of old, dense plates sinking at trenches ('slab pull') as the strongest force, with mantle flow and ridge push also contributing, and the details are still debated. Mention this only in teacher notes; MS-ESS2-3 does not assess mechanisms.
  • Oldest seafloor location: p. 213 lists 'the oldest rocks at the trenches'. That holds where trenches exist; in the Atlantic the oldest seafloor lies against the continental shelves, as the book's own Figure 4B shows. Teach 'older with distance from the ridge'.
  • Glossopteris: the book calls it 'a fern that grew only in warm climates' and uses it to argue the continents were nearer the equator (p. 205). It was an extinct seed plant (a 'seed fern', not a true fern), and Antarctic fossil wood shows it grew at polar latitudes in a cool, strongly seasonal climate. Use its fossils only as evidence that the southern continents were joined and that Antarctica's climate has changed.
  • Lystrosaurus: the book says its fossils are found 'only' in Antarctica, southeastern Africa and India (p. 205). They are also found in China and Russia. Say 'found in' rather than 'only in'.
  • Mesosaurus: the book says it 'lived only in fresh water' (p. 205). Its habitat is debated (fresh, brackish or salty lagoons). The argument needs only that it was a small shallow-water reptile unable to cross an open ocean.
  • San Andreas rate: p. 217 gives about 5 millimeters per year. USGS gives about 5 centimeters (50 mm) per year for the Pacific and North American plates' relative motion; the printed figure appears to be a unit slip. The deck uses about 5 cm per year across the whole plate boundary and notes that the San Andreas Fault itself takes only part of that motion.
  • Nazca convergence: p. 216 gives 70-100 mm per year. USGS gives about 80 mm per year in the south falling to about 65 mm per year in the north; the deck uses 65-80 mm per year.
  • Red Sea: p. 216 gives 15-15.7 mm per year. GPS studies report about 15 mm per year of opening for the southern Red Sea; the deck says 'about 15 mm per year in the south'.
  • Glomar Challenger: the book says scientists 'redesigned an existing drill ship' (p. 210). The ship was newly built (keel laid 1967, launched March 1968) for the Deep Sea Drilling Project. The South Atlantic transect that confirmed the age pattern was Leg 3 (late 1968 to early 1969), which drilled 17 holes at 10 sites, not the ship's very first voyage.
  • JOIDES Resolution: p. 211 says the ship 'is still exploring the seafloor today'. Its final scientific expedition sailed in 2024; teach it in the past tense. Its site and depth totals in the book describe an earlier date.
  • Deepest drilling: p. 206 gives 12,262 m as the deepest hole (the Kola borehole, on land). No drill has gone through the full thickness of the crust into the mantle, but in 2023 the JOIDES Resolution recovered more than a kilometer of mantle rock from a place on the Mid-Atlantic Ridge where mantle rock is exposed at the seafloor.
  • Number of plates: the book says there are 15 major plates (p. 214). The count depends on how plates are grouped; sources list seven or eight very large plates, about a dozen once the mid-sized ones are counted, plus many smaller ones. Say 'about a dozen major plates and many smaller ones' and never assess a count.
  • Seismic wave speed: p. 206 says waves travel faster through denser rock. Speed depends on stiffness as well as density; with stiffness fixed, denser rock actually slows the waves. Teach only that waves change speed and direction when the rock they pass through changes.
  • Fracture zones: p. 208 says the two sides of a fracture zone move in opposite directions. That is true only on the active stretch between offset ridge segments (a transform fault); beyond that, fracture zones are mostly inactive scars.
  • Source of magma at subduction zones: p. 216 says part of the sinking plate melts. Scientists debate whether the melting is in the sinking plate, the mantle above it, or both; say 'melting deep below feeds the volcanoes' without naming which rock melts.
  • San Andreas behavior: p. 217 says transform motion builds stress until sudden slip. The locked sections of the fault behave this way; a central section from San Juan Bautista to Parkfield creeps steadily, with many small earthquakes but no large ones; Parkfield itself is a transition zone.
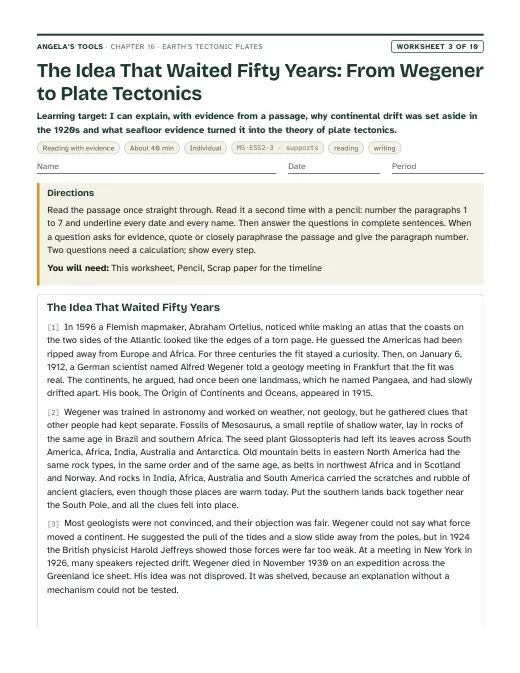
  • Wegener's dates: the book says 1912 (pp. 204, 214) and a photo caption says 1915 (p. 205). Both are right: he presented the idea in January 1912 and published his book The Origin of Continents and Oceans in 1915. Pangaea assembled about 300 million years ago and began to break apart about 200 million years ago.
  • Appalachian-Atlas match: the old rock belt that continues the Appalachians is best seen in Morocco's Anti-Atlas; the High Atlas gained much of its height far later. 'One mountain range torn in two' is a simplification; 'matching old rock belts on facing coasts' is accurate.
  • Age of plate tectonics: p. 214 says plate motion over 'the past 3 billion years' built today's features. When plate tectonics began is debated, with published estimates ranging from more than 4 billion to less than 1 billion years ago and many near 3 billion. Do not assess a start date.
  • Theory wording: p. 214 can read as if a theory is proven and final. Teach that a theory is a well-tested explanation that remains open to refinement; the lesson's own standards box lists 'Scientific Knowledge is Open to Revision in Light of New Evidence'.
  • Paleomagnetic stripes: in 1963 Vine and Matthews proposed that magnetic stripes on the seafloor are a record of spreading; ship surveys published in 1965-66 (Vine and Wilson; Pitman and Heirtzler) showed the predicted mirror-image pattern across ridges, a decisive test. The MS-ESS2-3 assessment boundary excludes paleomagnetic anomalies, so the stripes appear only as history (teacher notes, the timeline slide and the W3 passage) and are never assessed.

Review status: reviewed · 2026-10-19 · Both interrupted edits confirmed complete: the W3 passage is 696 words (450-700) and every slide bullet is 110 characters or fewer. Glossopteris consistency: W1 (q4 key, q7 model, extension) and W8 q7 argued that forests could not grow at a dark pole, contradicting the chapter's own correction. They now say the forests grew near the pole in a milder, ice-free climate, and that climate alone cannot explain the shared fossils or the glacial pattern. Vine-Matthews: 1963 was the proposal; the mirror-image stripes were shown in 1965-66 (Vine and Wilson; Pitman and Heirtzler). Corrected in the W3 passage, slide 16 notes, the timeline and the accuracy notes, and the paleomagnetic notes no longer claim the stripes appear only in teacher notes. Still never assessed. History: the 1926 New York symposium was not a vote (slide 9, W3). Slide 1 now says about 370 years to match the timeline. The timeline is in chronological order. The Meteor expedition bullet is limited to the South Atlantic. The San Andreas creeping section is given as San Juan Bautista to Parkfield, with Parkfield as a transition zone. Arithmetic and units, all items re-solved: estimatedMinutes 150 to 145 (sum of pacing). Slide 19 now separates the one-side and full widening. Lab 2's real one-side spreading rates now read 0.5-8 cm per year to match W5. W1 q6's comparison distance is fixed. W8 q2's total range is 16-18. W9's teacher note says a faster ship buys no extra site. Lab 1's decoy has 7 matches (not 8). Lab 1's E-to-B green dots were moved from the 1 cm tolerance edge to an exact match; scores are unchanged (11 and 1). Lab 3: shelf site S7 was 1,050 km west, inland of the 1,000 km west shore; it is now 980 km west. The model-limitations note now names the west-margin versus trench age inconsistency. W6 no longer says the 70 Ma sites are at the shelves. Contract and consistency: caGrade added to all five lab standards entries. Chapter vocabulary trimmed from 13 to 12 by removing Pangaea, which stays on vocab slide 6. W2's third bin is redefined so continental drift and plate tectonics fit it. The chapter text now describes W9 as a drilling-voyage plan. The sequence, SEP and differentiation now match slide 9 (1926), Lab 2 (one uneven run) and Lab 3 (six cores). The plate-onset range is broadened to more than 4 to less than 1 billion years ago. Originality: remaining 6-word overlaps with the lesson are section titles in sourceReferences, textbook claims quoted in accuracyNotes so they can be corrected, a proper noun, and one generic phrase. Echoing sentences in the deck, W3, W7 and W10 were reworded. Labs remain physically untested; see each lab's modelLimitations.

Source references

Verified against the student edition of Bring Science Alive! 7th Grade Integrated (Student Edition). Printed page numbers appear in the book; PDF pages are the physical pages of the 524-page scan (printed + 36). The textbook is not reproduced on this site.

SectionPrinted pagesPDF pagesUsed for
Introduction: the seafloor without its oceans202, 203238, 239Lesson question, the world-circling ridge, the vocabulary list and the publisher's standards box.
1. Wegener's Hypothesis: Ortelius, Pangaea and the fossil, rock and mountain evidence204, 205240, 241Wegener's four lines of evidence, Lab 1 evidence overlays, slides 4-9, the 'no mechanism' problem.
2. Discovering Earth's Interior: seismic waves and the lithosphere206242The layers diagram, the solid-but-flowing mantle, the plates-are-lithosphere idea.
3. Observing Patterns of Volcanoes and Earthquakes207243Earthquake and volcano belts as plate outlines, the Ring of Fire, slide 11-12 check.
4. Discovering Features of the Seafloor: sonar, structures and seafloor spreading208, 209244, 245The four seafloor structures, the age-pattern prediction, Lab 2 and Lab 3, the recycling of seafloor at trenches.
5. Designing a Drill Ship: criteria, constraints and testing for seafloor spreading210, 211246, 247The criteria versus constraints compare diagram, the Glomar Challenger core evidence, Lab 3's drilling-program scenario, W9.
Key Science Concept: Evidence for Moving Continents212, 213248, 249The three evidence families (land, earthquakes and volcanoes, seafloor) used to organize the synthesis slide, W6 and W8.
6. The Theory of Plate Tectonics: from hypothesis to theory, the plates, mantle convection214, 215250, 251Hypothesis versus theory, the plate map, the seafloor life-cycle flow diagram (mechanism in notes only).
7. Tracking Plate Motion: convergent, divergent and transform boundaries; rate times time216, 217252, 253Boundary table, plate speeds, the rate-times-time check, the San Andreas connection, lesson summary.

External references used for accuracy checks

Related chapters