Chapter 25 · Unit 9: Earth's Natural Hazards · Segment 4

Volcanic Eruptions and Earthquakes

How can people forecast and prepare for volcanic eruptions and earthquakes when only one of them usually gives warning signs?

Overview

Students figure out why earthquakes and volcanoes crowd into belts along plate boundaries, what lets solid rock melt into magma, why some magma explodes, and how locked faults store stress for years and release it in seconds. They read hazard data the way scientists do: locations, depths, frequencies and logarithmic magnitudes. One contrast runs through every activity: volcanoes often give measurable warning signs, so eruptions can be forecast, but no reliable warning sign for earthquakes is known, so scientists forecast chances over decades instead of dates. California's own hazards (the San Andreas Fault, the Cascadia subduction zone and Long Valley Caldera) anchor the chapter, which ends with engineers turning hazard data into precise criteria for earthquake-resistant bridges.

Estimated class time: presentation about 145 minutes · worksheets about 430 minutes in total · labs 4 sessions. Eight 50-minute periods: one for the phenomenon, the global pattern and how rock melts; one for the unlabeled-map lab; one for eruption styles, faults, waves and magnitude; one for forecasting eruptions and earthquakes and California's hazards; two for the shake-table bridge challenge; one for the bridge-site decision lab; one for synthesis and the mastery check. These eight periods cover the presentation and the three labs; the ten worksheets add roughly seven more periods of work, so assign some as homework or choose among them.

Phenomenon

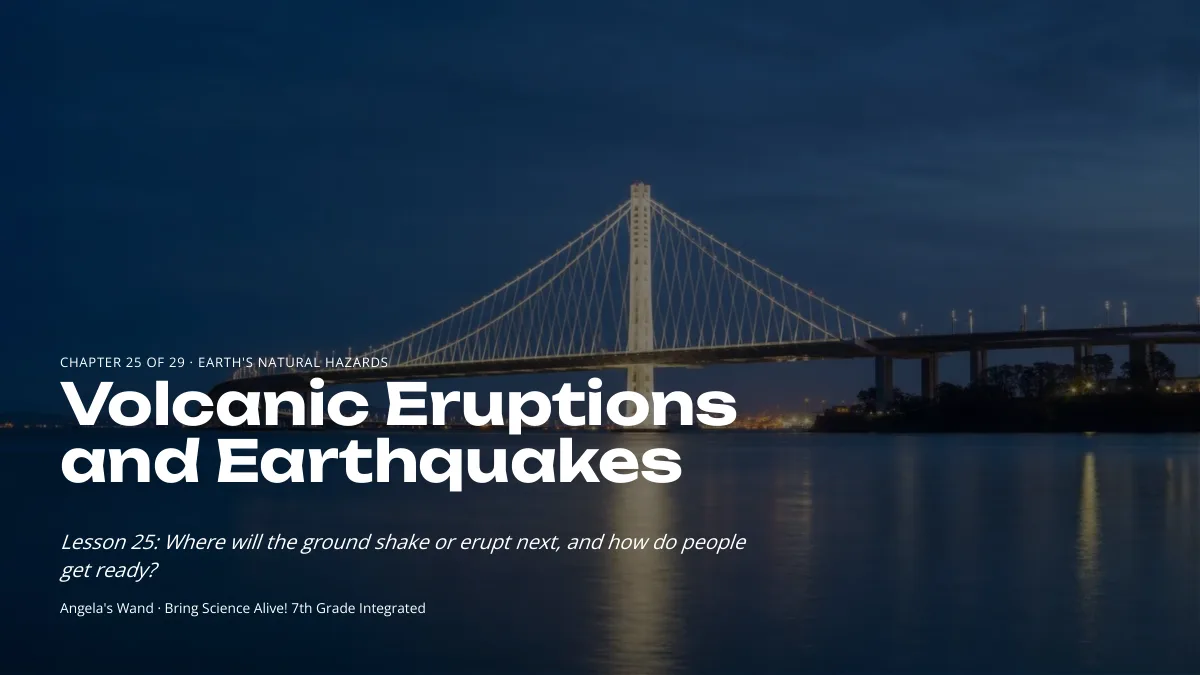
Fifteen seconds, and a bridge built for 1,500 years

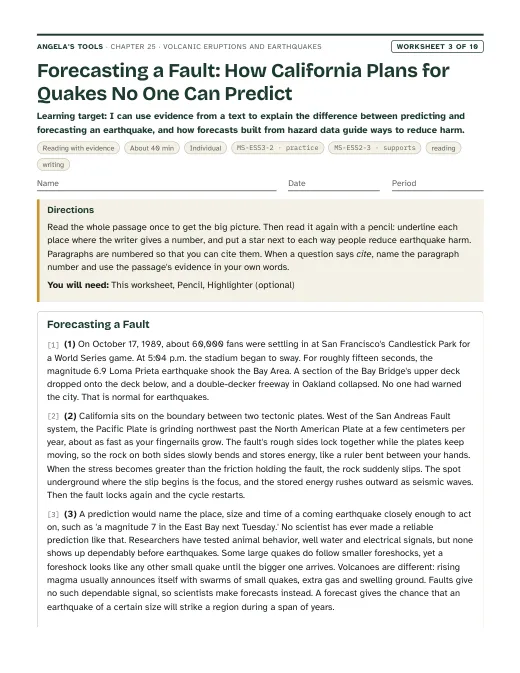
At 5:04 p.m. on October 17, 1989, rock deep beneath the Santa Cruz Mountains suddenly slipped. The Loma Prieta earthquake (magnitude 6.9) shook the region hard for about 15 seconds. Roughly 100 km to the north, a section of the San Francisco-Oakland Bay Bridge's upper deck broke loose and dropped onto the deck below. Nobody knew that afternoon was coming, and nobody could have. Yet when engineers designed the new eastern span, which opened in 2013, they planned for it to reopen quickly after the strongest shaking expected in about 1,500 years. How can anyone design for an event they cannot predict?

Notice and wonder prompts

  • Why could a bridge roughly 100 km from where the rock slipped still be damaged?
  • If no one can name the date of the next big earthquake, what can scientists measure that is useful to engineers?
  • Would a volcano give more warning than a fault? What could a volcano give away before it erupts?
  • What could 'the strongest shaking expected in 1,500 years' mean when written records in California cover only about 250 years?

Learning targets

  • I can use maps of earthquake and volcano locations, depths and magnitudes to locate plate boundaries, identify their type, and explain the exceptions (hot spots and faults inside plates).
  • I can explain three ways mostly solid rock melts into magma, and why thick, gas-rich magma erupts explosively while runny magma pours out as lava.
  • I can explain how stress builds along a locked fault and is released suddenly at the focus, and describe how body waves and surface waves travel from it.
  • I can use the logarithmic magnitude scale and frequency data to compare earthquakes and to forecast where hazards are most likely.
  • I can explain why eruptions can often be forecast from precursor events while earthquakes cannot be predicted, and what forecasts and early-warning alerts can and cannot do.
  • I can write precise criteria and constraints for an earthquake-resistant bridge, test designs fairly, and use hazard data to choose a site and a performance target.

What shows the learning happened

  • A plotted map and depth cross-section (Lab 1) in which each boundary is classified with evidence from earthquake depth, magnitude and the presence or absence of volcanoes, plus a written forecast ranking four towns by earthquake hazard.
  • Magnitude comparisons worked with powers of 10 (ground motion) and about 32 (energy), with a sentence explaining why one earthquake has one magnitude but many intensities (slides 14 and 16, Lab 1 q7, Lab 3 q3).
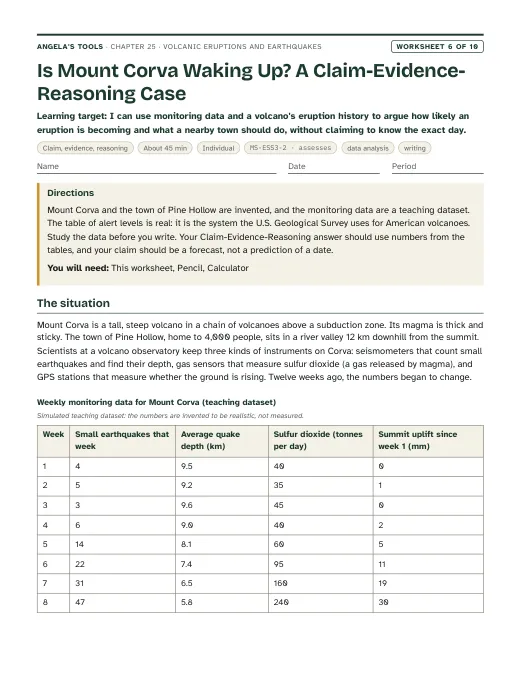
  • A written explanation, from monitoring data, of why a restless volcano's eruption can be forecast while the timing of an earthquake cannot, including what a probability forecast and an early-warning alert each mean (slide 18 task, exit ticket).
  • A shake-table test record (Lab 2) showing precise criteria and constraints written before building, results at three measured shaking levels, and a redesign justified by the class's comparison data.
  • A site ranking and recommendation (Lab 3) that computes frequencies, compares magnitudes logarithmically, scores each hazard, checks the budget, and names a hazard the design cannot fully mitigate.
  • A claim-evidence-reasoning paragraph on a restless volcano (W6) and a volcano monitoring network with an alert rule (W9) that use precursor data to support a forecast and a mitigation choice.

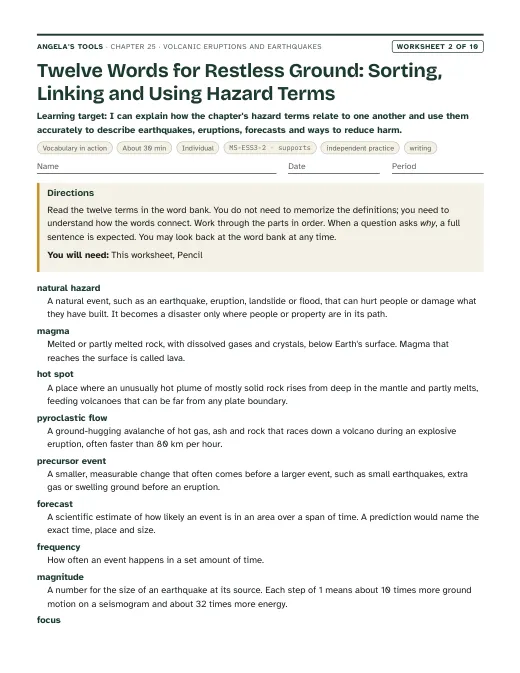
Key vocabulary 12 terms

natural hazardA natural event, such as an earthquake, a volcanic eruption, a landslide or a flood, that can hurt people or damage what they have built. It becomes a disaster only where people, homes or roads are in its path.The county's hazard map shows three natural hazards for the river crossing: strong shaking, soft-ground failure and mudflows from the volcano.
magmaMolten or partly molten rock, carrying dissolved gases and crystals, below Earth's surface. Once it reaches the surface, it is called lava.Rising magma cracked the rock beneath the volcano and set off thousands of tiny earthquakes.
hot spotA place where an unusually hot plume of mostly solid rock rises from deep in the mantle and partly melts as the pressure on it drops, feeding volcanoes that can sit far from any plate boundary.The Hawaiian volcanoes erupt in the middle of the Pacific Plate because they sit above a hot spot.
pyroclastic flowA ground-hugging avalanche of hot gas, ash and rock fragments that races down a volcano during an explosive eruption, often faster than 80 km per hour.The hazard map marked every valley within 10 km of the summit as a pyroclastic flow zone, because no one can outrun a flow once it starts, so people must leave before an eruption.
precursor eventA smaller, measurable change that often comes before a larger event. Before eruptions, precursors include swarms of small earthquakes, extra volcanic gas and swelling ground.Satellite radar picked up a precursor event: the volcano's flank had bulged outward by several centimeters in a month.
forecastA scientific estimate of how likely an event is in a given area over a given time span. A prediction would name the specific time, place and size, which nobody can do for earthquakes.The forecast gives the San Francisco Bay region a 72 percent chance of at least one magnitude 6.7 or larger earthquake between 2014 and 2043.
frequencyHow often an event happens during a set amount of time.Earthquakes of magnitude 5 had a frequency of about two per decade near the gorge, but magnitude 7 events came only every few centuries.
magnitudeA number for the size of an earthquake at its source, calculated from seismic wave recordings. The scale is logarithmic: each step of 1 means 10 times more ground motion on a seismogram and about 32 times more energy released.A magnitude 7 earthquake releases about 1,000 times the energy of a magnitude 5, not just a little more.
focusThe place underground where rock first slips and an earthquake begins. Seismologists also call it the hypocenter.Seismologists placed the Loma Prieta earthquake's focus about 18 km beneath the Santa Cruz Mountains.
epicenterThe point on Earth's surface directly above an earthquake's focus.The epicenter was in the Santa Cruz Mountains, but some of the worst damage happened on soft ground far to the north.
seismic waveA wave of vibration that carries energy away from an earthquake through rock. Body waves (P and S waves) travel through Earth's interior; slower surface waves travel along the surface and make it roll and sway.The P wave reached the station first, and the stronger shaking from the S wave and surface waves arrived seconds later.
mitigateTo lessen the harm a hazard causes, for example by keeping buildings off the most dangerous ground, building stronger structures, monitoring and planning evacuations. Mitigation does not stop the hazard itself.Japan mitigated earthquake damage by setting new tall buildings on stacks of rubber and steel that soak up shaking.

Standards alignment

California NGSS, Grade 7 Preferred Integrated Course Model. Each entry says whether this chapter's work assesses the performance expectation, gives practice toward it, or supports it as background; the resource lists below repeat this for every worksheet and lab.

MS-ESS3-2Assesses: analyzing location, depth, frequency and magnitude data on earthquakes and eruptions to forecast where and how likely future events are, and using that analysis to choose mitigationCA Grade 7

Analyze and interpret data on natural hazards to forecast future catastrophic events and inform the development of technologies to mitigate their effects.

This is the lesson's performance expectation. Lab 1 asks students to forecast which towns face which hazards from mapped event data, and Lab 3 has them rank bridge sites from frequency, magnitude and ground data and choose a mitigation plan. The deck keeps the clarification statement's contrast front and center: eruptions are often preceded by measurable precursors, while earthquakes strike without reliable warning.

MS-ESS2-3Supports: earthquake and volcano locations, depths and trenches as evidence of plate boundaries and plate motionCA Grade 7

Analyze and interpret data on the distribution of fossils and rocks, continental shapes, and seafloor structures to provide evidence of the past plate motions.

Plotting earthquakes and volcanoes in Lab 1 reveals the plate boundaries and the direction a plate is sinking, which is background evidence for plate motion. Lesson 16 is where this PE is assessed; here it supports reasoning about why hazards cluster where they do.

Assessment boundary: Paleomagnetic anomalies in oceanic and continental crust are not assessed.

MS-ESS2-2Supports: slow, gradual processes punctuated by sudden catastrophic eventsCA Grade 7

Construct an explanation based on evidence for how geoscience processes have changed Earth’s surface at varying time and spatial scales.

Stress accumulates on a locked fault over decades or centuries and is released in seconds, and magma can collect for years before an eruption. This illustrates the clarification statement's point that earthquakes and volcanoes usually behave gradually but are punctuated by catastrophic events, without asking students to construct the full explanation the PE requires.

MS-ETS1-1Practice toward: defining precise, measurable criteria and constraints for an earthquake-resistant bridgeCA Grade 6-8

Define the criteria and constraints of a design problem with sufficient precision to ensure a successful solution, taking into account relevant scientific principles and potential impacts on people and the natural environment that may limit possible solutions.

In Lab 2 students turn a performance-target table into measurable criteria (load stays on the deck, sag limits, joints intact at each shaking level) and constraints (budget, materials, build time) before building, and Lab 3 adds site hazards as scientific limits on the solution. The problem frame is supplied by the teacher, so this practices the PE rather than fully assessing it.

MS-ETS1-2Practice toward: evaluating competing designs and sites systematically against criteria and constraintsCA Grade 6-8

Evaluate competing design solutions using a systematic process to determine how well they meet the criteria and constraints of the problem.

Groups compare tested bridge designs with a shared results table in Lab 2 and compare three sites with a scoring table and a cost check in Lab 3, mirroring the lesson's account of engineers comparing bridge designs before choosing one.

Science and engineering practices

  • Analyzing and Interpreting Data. Students plot simulated earthquake and volcano coordinates and depths to find boundary patterns (Lab 1), read monitoring graphs to judge eruption likelihood (slide 18), and compare site hazard data (Lab 3).
  • Using Mathematics and Computational Thinking. Students use powers of 10 and of about 32 to compare magnitudes, convert catalog counts into frequencies per decade, and compute risk scores and cost totals (slides 14 and 16, Lab 1, Lab 3).
  • Asking Questions and Defining Problems. Students rewrite vague goals as measurable criteria and constraints for a bridge at a chosen importance level (Lab 2, slide 24).
  • Planning and Carrying Out Investigations. Students run a controlled shake-table test with a measured stroke and beat rate, the same load and the same shaker for every design (Lab 2).
  • Engaging in Argument from Evidence. Students defend a site and design decision with numbers, and debate what a probability forecast does and does not promise (Lab 3, slide 21).

Disciplinary core ideas

  • ESS3.B Natural Hazards. Mapping the locations, frequencies and magnitudes of past events, combined with knowledge of plate settings, forecasts where future earthquakes and eruptions are likely and informs land-use and building choices.
  • ESS2.B Plate Tectonics and Large-Scale System Interactions. Earthquake and volcano belts outline plate boundaries; the depth pattern of earthquakes traces a plate sinking beneath another.
  • ESS2.A Earth's Materials and Systems. Energy from Earth's interior and plate motion explain where mostly solid mantle rock melts (water added, pressure lowered, hot plumes) and why stress accumulates in the brittle crust.
  • ETS1.A Defining and Delimiting Engineering Problems. A bridge's criteria depend on its importance and on local hazard data; precise criteria and constraints make a design test meaningful.
  • ETS1.B Developing Possible Solutions. Students compare tested bridge designs and candidate sites systematically before choosing one, and combine the best features in a redesign.

Crosscutting concepts

  • Patterns. Belts of activity on a map, depth increasing in one direction across a subduction zone, and small earthquakes far outnumbering large ones are the patterns students use to forecast.
  • Cause and Effect. Plate motion causes stress and melting; ground type and distance, not just magnitude, determine how hard a site shakes.
  • Scale, Proportion, and Quantity. Magnitude is logarithmic, so each step multiplies ground motion by 10 and energy by about 32; recurrence intervals of centuries are compared with records of decades.
  • Stability and Change. A locked fault looks stable for decades while stress grows, then changes in seconds; a restless volcano can return to quiet without erupting.
  • Influence of Science, Engineering, and Technology on Society and the Natural World. Hazard maps, monitoring networks, early-warning alerts and performance-based bridge design all turn science into decisions that protect people.

Presentation 28 slides

Volcanic Eruptions and Earthquakes: reading the hazards, planning the bridge. Original, editable slides with speaker notes: a phenomenon opener, learning targets, the chapter's concepts with diagrams, vocabulary in context, 4 checks for understanding, 2 discussion prompts, an application task, a misconception check, a synthesis and an exit ticket.

Worksheets 10 of 10

Ten different tasks, one per instructional blueprint. Each has a student PDF (low ink, US Letter), an editable DOCX, an HTML preview, and a separate teacher answer key with reasoning.

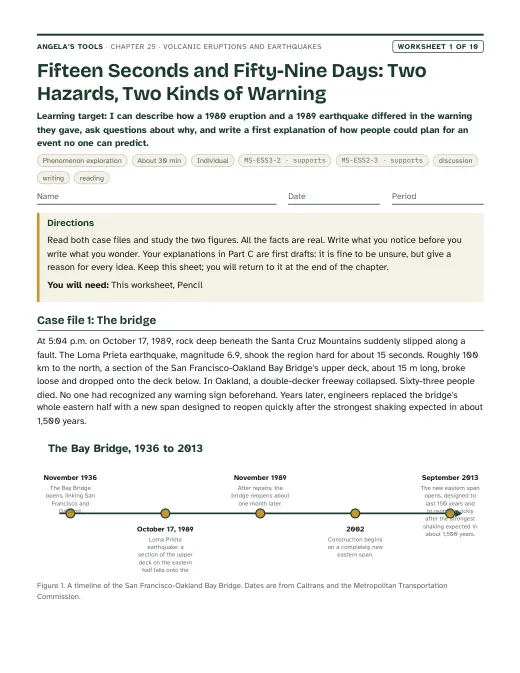
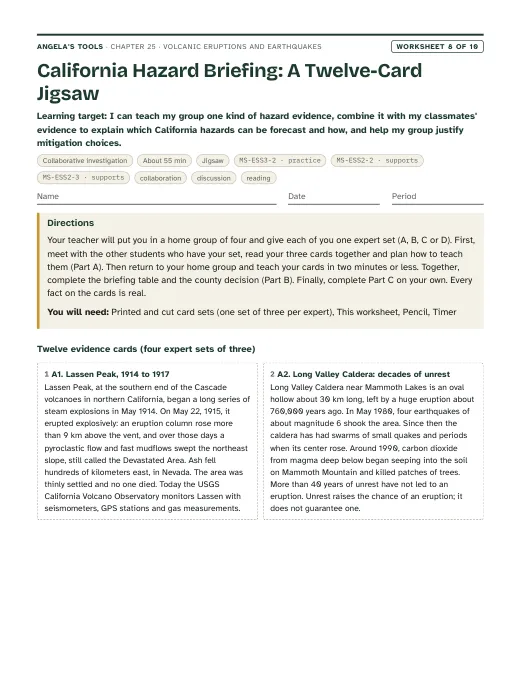
First page of Fifteen Seconds and Fifty-Nine Days: Two Hazards, Two Kinds of Warning
Worksheet 1 · Phenomenon exploration

Fifteen Seconds and Fifty-Nine Days: Two Hazards, Two Kinds of Warning

I can describe how a 1980 eruption and a 1989 earthquake differed in the warning they gave, ask questions about why, and write a first explanation of how people could plan for an event no one can predict.

30 minindividualActivates prior knowledgeDiscussionWritingReading MS-ESS3-2 · supportsMS-ESS2-3 · supports
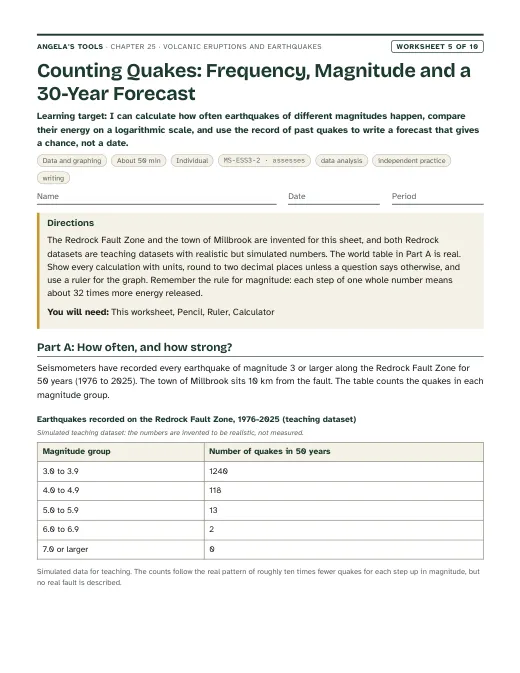
First page of Counting Quakes: Frequency, Magnitude and a 30-Year Forecast
Worksheet 5 · Data and graphing

Counting Quakes: Frequency, Magnitude and a 30-Year Forecast

I can calculate how often earthquakes of different magnitudes happen, compare their energy on a logarithmic scale, and use the record of past quakes to write a forecast that gives a chance, not a date.

50 minindividualPracticeData analysisIndependent practiceWriting MS-ESS3-2 · assesses
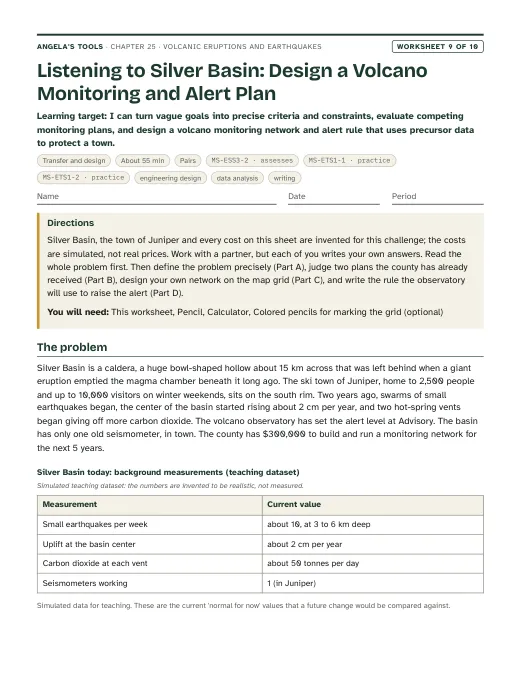
First page of Listening to Silver Basin: Design a Volcano Monitoring and Alert Plan
Worksheet 9 · Transfer and design

Listening to Silver Basin: Design a Volcano Monitoring and Alert Plan

I can turn vague goals into precise criteria and constraints, evaluate competing monitoring plans, and design a volcano monitoring network and alert rule that uses precursor data to protect a town.

55 minpairsExtensionEngineering designData analysisWriting MS-ESS3-2 · assessesMS-ETS1-1 · practiceMS-ETS1-2 · practice

Collaborative labs 3 of 3

Three different investigation approaches. Each has a teacher guide (purpose, materials with quantities, estimated cost, prep, safety, procedure, expected observations, debrief, answer key, assessment criteria, accessibility adaptations, low-cost alternative) and a student recording sheet.

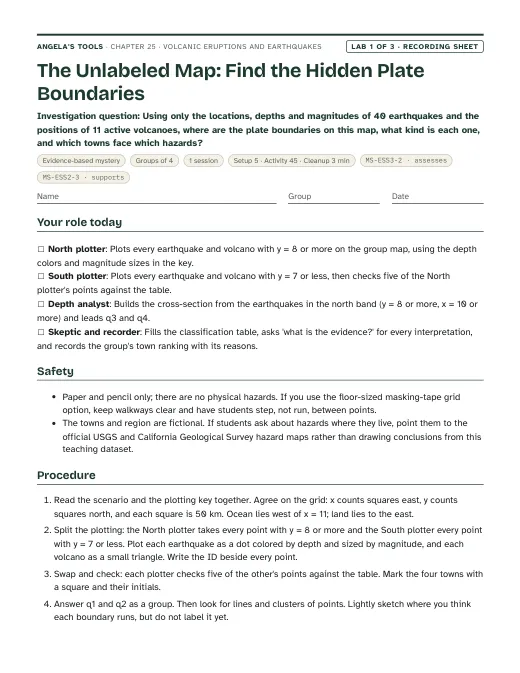
First page of the The Unlabeled Map: Find the Hidden Plate Boundaries recording sheet
Lab 1 · Evidence-based mystery

The Unlabeled Map: Find the Hidden Plate Boundaries

Using only the locations, depths and magnitudes of 40 earthquakes and the positions of 11 active volcanoes, where are the plate boundaries on this map, what kind is each one, and which towns face which hazards?

Groups of 41 session45 min activityEst. 2 to 4 per class (estimate)Recording sheet with the earthquake table, volcano table, town table, plotting key, map grid and cross-section gridColored pencils: red, blue and black (one each)Ruler MS-ESS3-2 · assessesMS-ESS2-3 · supports
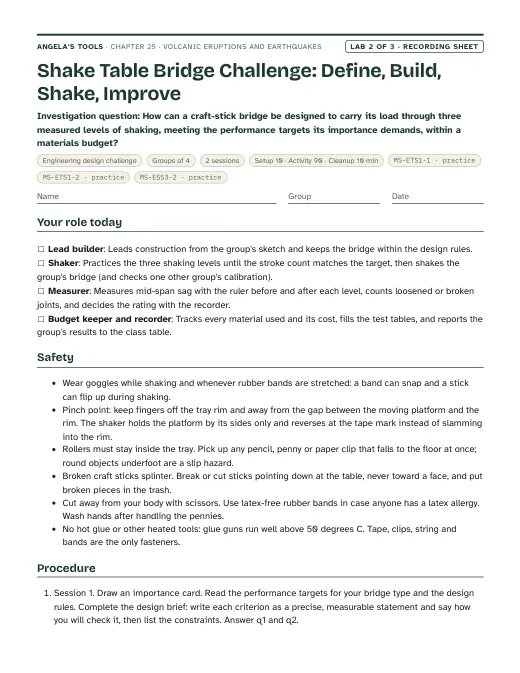
First page of the Shake Table Bridge Challenge: Define, Build, Shake, Improve recording sheet
Lab 2 · Engineering design challenge

Shake Table Bridge Challenge: Define, Build, Shake, Improve

How can a craft-stick bridge be designed to carry its load through three measured levels of shaking, meeting the performance targets its importance demands, within a materials budget?

Groups of 42 sessions90 min activityEst. about 35 to 60 to set up 8 groups (the low end with borrowed trays), then about 10 to 15 per class (estimates)Rimmed baking sheet or plastic cafeteria tray, about 30 x 45 cm (the shake-table base)Stiff corrugated cardboard or foam board, about 25 x 35 cm (the moving platform)Round pencils or 1 cm wooden dowels about 18 cm long (rollers under the platform) MS-ETS1-1 · practiceMS-ETS1-2 · practiceMS-ESS3-2 · practice
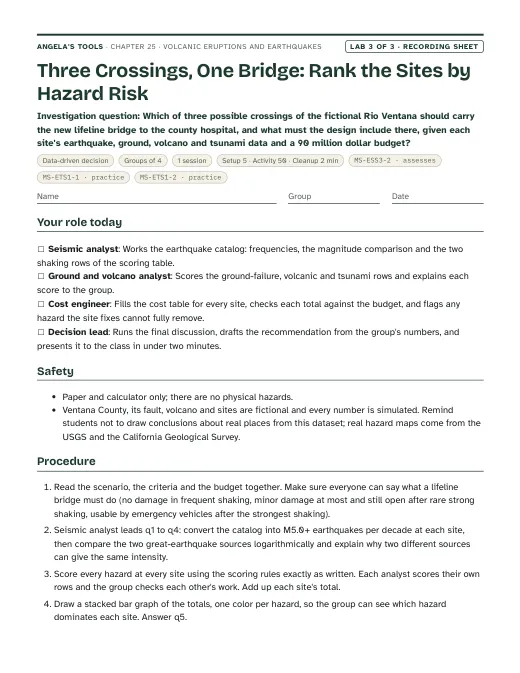
First page of the Three Crossings, One Bridge: Rank the Sites by Hazard Risk recording sheet
Lab 3 · Data-driven decision

Three Crossings, One Bridge: Rank the Sites by Hazard Risk

Which of three possible crossings of the fictional Rio Ventana should carry the new lifeline bridge to the county hospital, and what must the design include there, given each site's earthquake, ground, volcano and tsunami data and a 90 million dollar budget?

Groups of 41 session50 min activityEst. 2 to 4 per class (estimate)Recording sheet with the site description, both datasets, scoring rules, scoring table, cost menu and cost tableCalculatorColored pencils (five colors, one per hazard) for the stacked bar graph MS-ESS3-2 · assessesMS-ETS1-1 · practiceMS-ETS1-2 · practice

Teacher guidance

Suggested sequence (8 steps)
  1. Period 1: Presentation slides 1-8 (the Loma Prieta and Bay Bridge phenomenon, targets, the global pattern, the five settings, how solid rock melts, vocabulary, first check). W1 phenomenon worksheet as the opener (it may run into Period 2 or go home).
  2. Period 2: Lab 1, The Unlabeled Map: groups plot 40 simulated earthquakes and 11 volcanoes, draw a depth cross-section, classify the hidden boundaries and rank four towns by earthquake hazard. Debrief reveals the map is loosely modeled on western North America.
  3. Period 3: Slides 9-16 (runny and thick magma, the stick-build-slip cycle, focus, epicenter and seismic waves, the logarithmic magnitude scale, two vocabulary slides, the energy check). W2 vocabulary once all twelve terms have been introduced, and W3 reading as homework.
  4. Period 4: Slides 17-23 (precursors and the Eyjafjallajokull story, the monitoring-data task, why earthquakes are forecast rather than predicted, the real Bay Area forecast and ShakeAlert, the forecast discussion, California's three hazards, check). W4 diagram and W5 data worksheets (one in class, one as homework or in an added period).
  5. Period 5: Slides 24-25 (mitigation, criteria and constraints, the performance-target table, the 'build everything to survive anything' discussion). Lab 2 session 1: groups draw an importance card, write precise criteria and constraints, practice the measured shaking levels and build version 1.
  6. Period 6: Lab 2 session 2: test at three shaking levels, pool the class results, identify the features of the best performers, redesign one feature and retest. W8 collaborative jigsaw in an added period or in place of the retest if time is short.
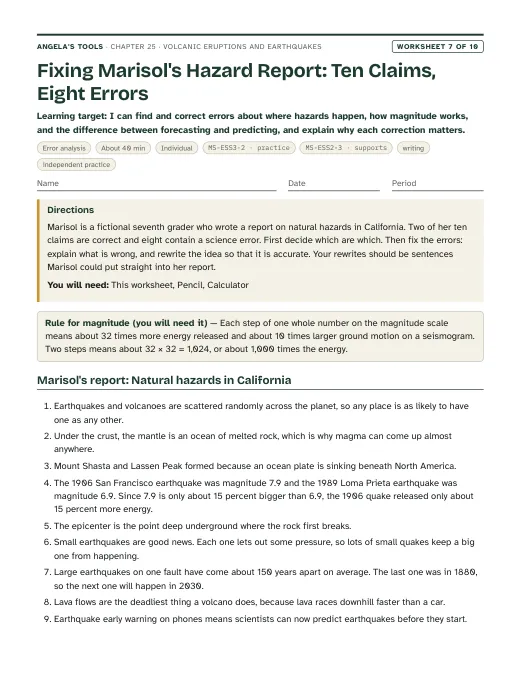
  7. Period 7: Lab 3, Three Crossings, One Bridge: rank three sites by hazard risk from simulated data, check the budget and recommend a site and performance target. W6 CER and W7 misconception repair as homework or in the following period.
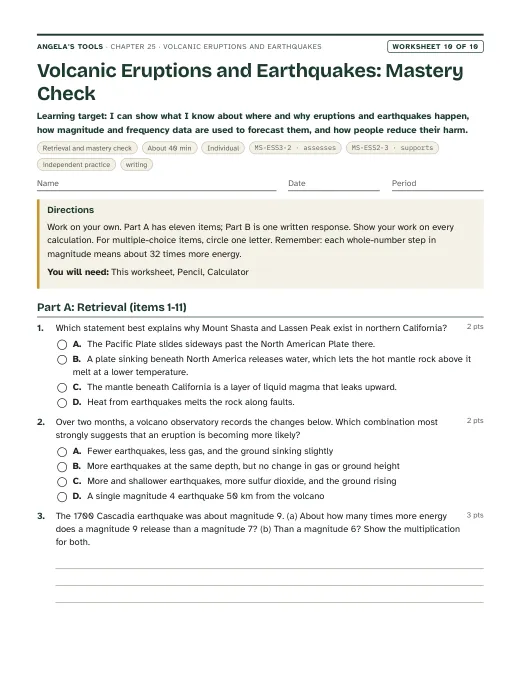
  8. Period 8: Slides 26-28 (the logarithmic misconception, synthesis, exit ticket). W10 mastery as the quiz; W9 transfer as an extension or homework design task.

Materials overview: Lab 1 and Lab 3 are paper only: printed data tables and grids, colored pencils (three colors), rulers and calculators. Lab 2 needs, per group, a rimmed baking sheet or cafeteria tray, a piece of stiff cardboard for the moving deck, six round pencils or dowels as rollers, two latex-free rubber bands and binder clips to center the deck, two small boxes or blocks as river banks, 40 craft sticks, masking tape, paper clips, string, index cards, 40 pennies in a zip bag as the load, a ruler, a phone metronome and safety goggles. No flames, heat or chemicals.

Common misconceptions (6)
“Scientists can predict earthquakes, or animals sense them days ahead.”
Why it happens: Weather forecasts and volcano warnings make every hazard seem predictable, and stories about restless pets or 'earthquake weather' spread widely after big quakes.
Correction: No reliable precursor for earthquakes is known. Animal behavior, groundwater, radon and other signals have been studied, but none has worked dependably, and some earthquakes follow small foreshocks that can only be recognized after the main shock. Scientists forecast the odds of a strong earthquake in a region over decades. Early-warning alerts such as ShakeAlert are not predictions: they detect an earthquake that has already begun and send seconds of notice before the strongest shaking arrives.
“A magnitude 6 earthquake is only a little stronger than a magnitude 5, the way 6 is only a little more than 5.”
Why it happens: Students read the scale like a ruler or a test score, where every step adds the same amount.
Correction: Magnitude is logarithmic. Each step of 1 means 10 times more ground motion on a seismogram and about 32 times more energy. A magnitude 7 releases about 1,000 times the energy of a magnitude 5 (32 x 32), and a magnitude 9 about a million times.
“Under the crust lies an ocean of liquid magma that leaks out wherever a volcano forms.”
Why it happens: Cutaway drawings color the mantle orange-red, and the word 'molten' gets attached to everything below the crust.
Correction: The mantle is mostly solid rock that flows extremely slowly. Magma forms only in special places: where water from a sinking plate lets rock melt at a lower temperature, where pressure drops as plates pull apart, or where an unusually hot plume rises. That is why volcanoes are found in belts and clusters, not everywhere.
“Every plate boundary has both volcanoes and earthquakes, and nothing happens away from boundaries.”
Why it happens: World maps show earthquakes and volcanoes overlapping around the Pacific, so students generalize to all boundaries.
Correction: Transform boundaries such as the San Andreas Fault produce many earthquakes but almost no volcanoes, because sliding plates do not make the rock melt. Hot spots such as Hawaii build volcanoes deep inside a plate, and faults inside plates, such as the New Madrid zone in the central United States, can produce strong earthquakes far from any boundary.
“A big earthquake on the San Andreas Fault could make California fall into the ocean.”
Why it happens: Movies and jokes show coastlines breaking off, and 'the Big One' sounds like a single catastrophe that ends everything.
Correction: The San Andreas Fault is a transform boundary: the Pacific Plate slides northwest past the North American Plate, a few centimeters a year on average, with sudden jumps of several meters in great earthquakes. Land moves sideways along the fault; it does not drop into the sea. The ocean is not a hole for the land to fall into.
“The epicenter is always where the shaking and damage are worst.”
Why it happens: News maps put a target symbol on the epicenter, and shaking does generally weaken with distance.
Correction: Shaking usually weakens with distance, but ground type matters too. Soft mud and loose artificial fill can amplify shaking and even liquefy. In 1989 some of the worst damage, including the collapse of the Cypress Street Viaduct in Oakland and fires in San Francisco's Marina District, happened on soft ground roughly 100 km from the epicenter.
Differentiation suggestions (5)
  • Multilingual learners: Pre-teach focus, epicenter, magma, lava, forecast and predict with a labeled cross-section and gestures (fist for the focus, finger straight up for the epicenter). Post a word wall pairing everyday and science words (shake / seismic wave; size / magnitude; how often / frequency). Provide frames: 'The quakes here are shallow/deep and there are/are no volcanoes, so this boundary is ___.' and 'An M__ releases about ___ times the energy of an M__ because ___.'
  • Students who need more support: In Lab 1 give a map with the ridge points already plotted and a color key printed on the sheet; split the data table so each student plots ten points. Supply a powers-of-ten ladder (1, 10, 100, 1,000) and a powers-of-32 ladder (1, 32, about 1,000, about 32,000) for magnitude comparisons. In Lab 3 pre-fill the scoring table's first row as a worked example.
  • Students ready for extension: Estimate the dip angle of the sinking plate from the Lab 1 cross-section; research how the 1700 Cascadia earthquake was dated from Japanese tsunami records and drowned forests; compute the rough peak acceleration of each Lab 2 shaking level from stroke and beat rate; or read about why Long Valley Caldera's unrest since 1980 has not led to an eruption.
  • Students who need movement or alternative output: Model stick-slip with two rough boards or a brick pulled on sandpaper by a rubber band, and have students time the jerks. Let Lab 1 plotting happen on a floor-sized masking-tape grid with sticky notes. Accept spoken or recorded explanations and labeled photos of the Lab 2 bridge as evidence.
  • Students with low vision or limited fine-motor control: Provide an enlarged Lab 1 grid with raised dot stickers for the three depth classes. In Lab 2 assign the measurer or recorder role with a large-print ruler, and let a partner handle tape and sticks while the student directs the build.
Accuracy notes: where the textbook simplifies (16)
  • Melting at subduction zones: Section 1 and Figure 1A (p. 330) and the Key Science Concept (p. 339) say crustal material from the sinking plate mixes with mantle rock and lowers its melting temperature. The main trigger is water (and other volatiles) released from the sinking plate into the hot mantle rock above it. Teach 'water from the sinking plate lets the hot mantle rock above it melt at a lower temperature.'
  • Hot spots: Figure 1A (p. 330) and the spread (p. 338) describe rising 'columns of magma' that heat the rock near the surface. A mantle plume is mostly solid rock that is hotter than its surroundings; it partly melts as it rises and the pressure on it drops. How deep plumes start, and whether hot spots stay fixed, are still debated, so the chapter says 'from deep in the mantle' without a depth.
  • The mantle is mostly solid: nothing in the lesson says so directly, and students often picture a magma ocean. Every slide on melting states that magma forms only in special settings.
  • Eruption styles: Section 1 (p. 331) calls nonexplosive eruptions the most frequent kind and says they do less damage. Many small eruptions are mildly explosive (for example the bursts that build cinder cones), so the chapter does not repeat the 'most common' claim. Lava flows rarely kill people but destroy most property in their path; the lesson's own Eldfell example (more than 400 buildings) was largely a lava eruption. Teach 'usually less deadly', not 'harmless'. Thicker magma is usually richer in silica; explosiveness depends on how much gas the magma holds and whether the gas can escape.
  • Predicting eruptions: Section 2 and the Lesson Summary say scientists 'can predict' eruptions. Precursors raise the likelihood, but unrest can last weeks to years or fade with no eruption, and some steam-driven eruptions give almost no warning. The chapter says 'forecast' and 'more likely'.
  • Eyjafjallajokull 2010 (p. 332): the eruption began late on March 20, 2010, after weeks of earthquakes and measurable swelling; about 500 residents were evacuated once it had started, and about 800 more when the larger summit eruption began in April. The textbook's statement that people reached safety before the eruption overstates the warning. The defensible point is that months of monitored unrest had communities prepared. The book's 'eleven weeks of swelling' and 'small earthquakes in 2009' are approximate; do not assess them.
  • Earthquake precursors: Section 4 and the spread say earthquakes have no precursor events. More precisely, no reliable precursor is known. Some large earthquakes follow foreshocks, but foreshocks cannot be recognized as such until the main shock happens, and claimed precursors often occur with no earthquake following. Earthquake early warning (ShakeAlert, delivered in California through the MyShake app and phone alerts) is not prediction; it detects an earthquake already under way and gives seconds to tens of seconds of notice depending on distance.
  • Depth at convergent boundaries: Section 3 and Figure 3A (p. 334) call convergent-boundary earthquakes 'deep'. Subduction zones produce shallow earthquakes too, including the largest megathrust earthquakes on the locked plate contact (shallower than about 50 km); they are the only setting that also produces earthquakes down to about 700 km. Lab 1's data shows both.
  • Body waves and damage: Section 3 (p. 335) says body waves are often too weak to feel and that surface waves do the most damage. P waves are usually mild, but S waves, which are body waves, can shake the ground violently near the source; USGS describes S waves and surface waves together as the damaging waves. The chapter says the slower S waves and surface waves cause most of the damage.
  • Epicenter and shaking: the lesson says the epicenter is commonly where shaking is most intense. That is a tendency, not a rule; soft ground amplifies shaking. In 1989 the Cypress Street Viaduct (Oakland) and the Marina District (San Francisco), both on bay mud or artificial fill roughly 100 km from the epicenter, suffered some of the worst damage.
  • Magnitude versus intensity: the lesson defines magnitude as 'the strength, or intensity' of an event. Seismologists separate the two: magnitude is one number for the earthquake's size at its source; intensity (the Modified Mercalli scale, Roman numerals I to XII) describes shaking and damage at a particular place and differs from place to place. Magnitudes today are usually moment magnitudes, not the original Richter scale, though news reports still say 'Richter'. Each whole step means 10 times the recorded ground motion and about 32 times the energy. Eruptions are sized with a different logarithmic scale, the Volcanic Explosivity Index (0 to 8).
  • Dated or approximate figures in the lesson (Iceland's count of about 35 active volcanoes, more than 400 buildings at Eldfell, about 1,500 noticeable earthquakes a year in Japan, the Kobe earthquake's 20 seconds and more than 6,400 deaths, pyroclastic flows faster than 80 km per hour) are not assessed. The Bay Area rates on p. 340 (moderate quakes two or three times a year, strong ones about every seven years) are the book's illustration and do not match USGS forecasts; the chapter uses the USGS Bay Area forecast instead (2014-2043: 98 percent chance of at least one M6.0 or larger, 72 percent for M6.7, 51 percent for M7.0, 20 percent for M7.5).
  • Bay Bridge criteria (pp. 340-341): the lesson is not internally consistent. Page 340 and the photo caption say a safety-critical bridge must stay fully operational in very strong, very rare earthquakes, while the p. 341 text allows minor damage in rare strong quakes, and the chart labels two different cells of one column 'safety critical'. The chapter's own performance-target table (slide 24, Lab 2, Lab 3) is self-consistent and does not ask which cell of the book's chart fits the Bay Bridge. The new eastern span's design goals (the strongest shaking expected in about 1,500 years; a 150-year design life) were checked against a Metropolitan Transportation Commission fact sheet.
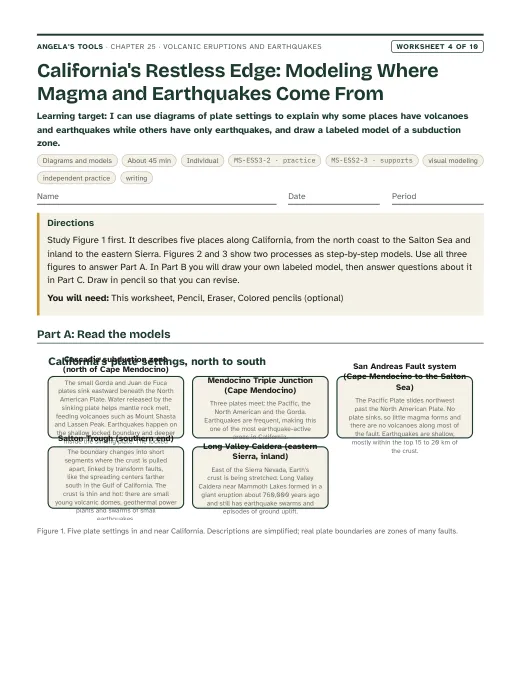
  • California facts used in the chapter: the San Andreas Fault is a transform boundary between the Pacific and North American plates, which move past each other at about 5 cm per year across the whole boundary zone, with the San Andreas taking only part of that motion; its earthquakes are shallow and it has no volcanoes. The Cascadia subduction zone runs about 1,000 km from Cape Mendocino in northern California to Vancouver Island, where the Juan de Fuca Plate (with the smaller Gorda Plate in the south) sinks beneath North America; its last great earthquake, on January 26, 1700, was about magnitude 9 and was dated partly from tsunami records in Japan. It feeds the Cascade volcanoes, including Mount Shasta and Lassen Peak (which erupted from 1914 to 1917). Long Valley Caldera, near Mammoth Lakes, is a 16 by 32 km depression left by a huge eruption about 760,000 years ago; it has had earthquake swarms, ground uplift and gas emissions since 1980, and the youngest eruptions nearby, along the Mono-Inyo chain and in Mono Lake, are only a few hundred years old. USGS rates Mount Shasta, Lassen Volcanic Center and Long Valley Caldera as very high threat; that ranking measures potential impact, not which volcano will erupt next. Long Valley is not at a plate boundary or a classic hot spot; its volcanism is linked to the stretching of the crust east of the Sierra Nevada, so it is presented as an exception.
  • Emergency advice: the spread's 'Preparing for' boxes are personal emergency instructions. The chapter treats mitigation as science and engineering (hazard maps, land use, monitoring, building design, early warning) and refers students to their school and family plans rather than writing new disaster advice. Mentioning 'Drop, Cover, and Hold On', the action ShakeAlert messages recommend, is fine.
  • All lab and slide datasets other than the USGS Bay Area forecast table are simulated teaching data and are labeled that way. The Lab 1 map is fictional, loosely modeled on western North America; the Lab 3 county, fault and volcano are fictional.

Review status: reviewed · 2026-10-19 · Re-solved every numeric, multiple-choice, true/false, fill and table item in W1-W10 and Labs 1-3; all keys agree. Lab 1: 30/8/2 depth classes, 17 cross-section points, about 43 km deeper per square, q7 1,000 and about 32,000. Lab 3: frequencies 0.6, 1.7 and 0.7 per decade, scores A 17, B 14, C 28, lifeline costs 85, 88 and 162, ordinary costs 65, 60 and 122; the 40 and 20 percent chances match Poisson odds from the stated 200- and 500-year intervals. Lab 2: stroke counts 20, 27 and 33 per 10 s and peak accelerations about 0.04, 0.14 and 0.34 g are correct for 1, 2 and 3 cm amplitudes at 1.0, 1.33 and 1.67 Hz. Slide links re-pointed to the worksheets as written: W3 (a forecasting passage) is no longer cited for magma melting (slide 6) or eruption styles (slide 9), which now cite W4, W6, W7 and W10; W5 (frequency and trench data) is no longer cited for the seismogram check (slide 13) or the volcano-monitoring task (slide 18); W9 (a volcano monitoring design) is no longer cited for bridge mitigation (slide 24), which now cites W8 card D3 and q3. Slides 3, 4, 17, 19 and 25 links tightened the same way. Facts checked against sources: Long Valley Caldera 16 x 32 km and about 760,000 years (USGS CalVO page); Bay Area 2014-2043 forecast 98, 72, 51 and 20 percent for M6.0, 6.7, 7.0 and 7.5, Hayward-Rodgers Creek 33 percent and San Andreas 22 percent (USGS Fact Sheet 2016-3020); Cascadia about 1,000 km, January 26, 1700, M8.7-9.2, about 500-year average interval (PNSN); Lassen 1914-1917, the last Cascade eruption before 1980. W8 card A1 now says the May 22, 1915 column rose more than 9 km above the vent (USGS gives more than 9.5 km). Magnitude (10 times amplitude, about 32 times energy per step) and intensity are kept separate everywhere. Smaller fixes: Lab 1 town list and Lab 3 cost menu moved into simulated dataset blocks; Kettle Bay relabeled as inland of the x = 11 coastline; Lab 2 setup-cost range corrected to about 35-60 dollars to match its basis; W5 graph-key description matched to the bars; two vocabulary example sentences corrected (pyroclastic flow evacuation logic; focus depth no longer implies wider strong shaking); topics trimmed to 12; pacing and sequence now say the worksheets need time beyond the eight periods, and W2 moved to after all twelve terms are introduced. Originality scan (6-word runs against the lesson text) found only section titles and the bridge's name. Standards codes and caGrade match standards.json in all 15 files. All labs are untested and labeled so; all invented data are labeled simulated.

Source references

Verified against the student edition of Bring Science Alive! 7th Grade Integrated (Student Edition). Printed page numbers appear in the book; PDF pages are the physical pages of the 524-page scan (printed + 36). The textbook is not reproduced on this site.

SectionPrinted pagesPDF pagesUsed for
Introduction: the Mount Etna opener, the lesson question and vocabulary328, 329364, 365Lesson question, the five vocabulary terms the lesson defines, and the standards the publisher lists (MS-ESS3-2, MS-ETS1-1).
1. Causes of Volcanic Eruptions: formation of volcanoes and types of eruptions330, 331366, 367Three settings where magma forms, explosive and nonexplosive eruptions, pyroclastic flows (slides 5-9, Lab 1); melting and hot-spot wording corrected in accuracy notes.
2. Planning for Volcanic Eruptions: precursors, frequency and magnitude, hazard maps, mitigation332, 333368, 369Precursor events, forecasting with monitoring data, volcanic hazard maps, mitigation (slides 15, 17-18, Lab 3 volcanic row); Eyjafjallajokull details corrected in accuracy notes.
3. Causes of Earthquakes: the origins of earthquakes and types of earthquake waves334, 335370, 371Stick-build-slip along boundaries and faults, focus and epicenter, body and surface waves (slides 10-13, Lab 1 depth analysis); depth and wave-damage simplifications corrected.
4. Planning for Earthquakes: predictability, mapping and mitigation336, 337372, 373Why earthquakes are not predictable, earthquake hazard mapping, the San Andreas and New Madrid examples, earthquake-resistant construction in Japan (slides 19-24, Lab 3).
Key Science Concept: Understanding Volcanic Eruptions and Earthquake Hazards338, 339374, 375Which plate settings produce eruptions, earthquakes or both, and the contrast between forecasting eruptions and earthquakes (slides 4-5, 19, Lab 1 classification table).
5. Designing Earthquake-Resistant Bridges (Engineering Design)340, 341376, 377Assessing local risk, deciding how important a bridge is, matching performance targets to hazard levels, the Bay Bridge replacement span (phenomenon, slides 24-25, Lab 2, Lab 3); the chart's inconsistency is noted in accuracy notes.
Lesson Summary341377Check that every summary idea is covered by a learning target, a slide and a lab.

External references used for accuracy checks

Related chapters