Chapter 24 · Unit 8: States of Matter · Segment 3

Heat, Temperature, and State Changes

When thermal energy is added to or removed from a substance, what happens to how its particles move, to its temperature and to its state?

Overview

Students figure out that temperature, thermal energy and heat are three different ideas: temperature reports how energetic a sample's particles are on average, thermal energy is the total for all of them, and heat is energy that flows from warmer matter to cooler matter because their temperatures differ. They use a particle model to predict all six changes of state, measure a melting curve and discover that a pure substance stays at one temperature while it changes state, test which cup of water can melt the most ice, and engineer a container that slows the energy flowing into an ice cube. These ideas explain dew, frost, boiling kettles and why farmers spray water on crops on freezing nights.

Estimated class time: presentation about 128 minutes · worksheets about 430 minutes in total · labs 4 sessions. Eight 50-55-minute periods plus homework: one for temperature, thermal energy and heat; one for the melting-curve lab; one for the six state changes; one for the which-cup mystery lab; one for why the temperature holds steady, evaporation versus boiling, attractions and the frost-protection connection; two for the insulation engineering lab; one for the jigsaw, misconception, synthesis and exit. Several worksheets (W3, W5, W7, W9) are designed as homework, and W6 (45 minutes) and W10 (40 minutes) fill one or two following assessment periods. A five-period version can skip Lab 2 (use W5 instead) and run Lab 3 as a single test round.

Phenomenon

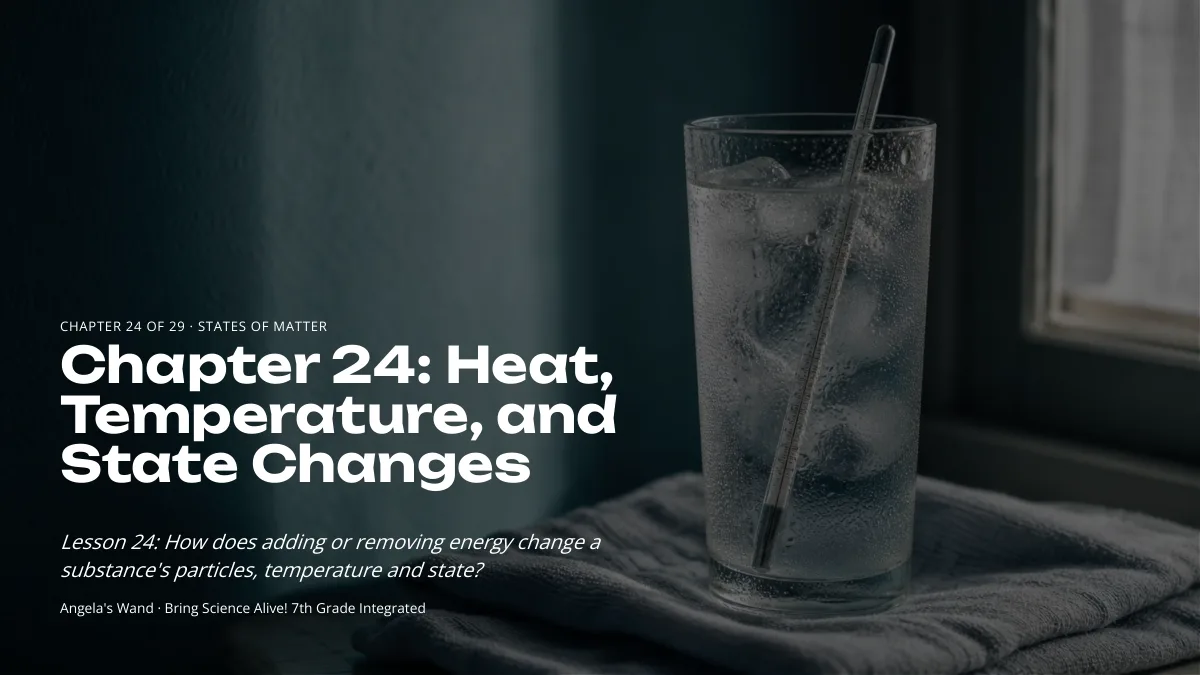
The sweating glass and the stubborn thermometer

On a warm, humid afternoon a student sets a can of juice from the refrigerator and a tall glass packed with ice water on a paper towel. Within a minute both turn misty, and soon drops run down their sides and wet the towel, although neither container leaks. A thermometer in the glass, stirred every few minutes, reads 0 °C and stays there for most of an hour while the ice shrinks, even though the room is 27 °C. Only after the last sliver of ice is gone does the reading begin to climb. Where does the water on the outside come from, and why does the ice water stay at 0 °C while energy from the warm room keeps flowing into it?

Notice and wonder prompts

  • The drops appear on the outside of a sealed can. What could they be made of, and where could they have come from?
  • Energy should be flowing from the 27 °C room into the 0 °C glass. If the temperature is not rising, what is the energy doing?
  • Would a glass of warm water sweat the same way? Would a glass of ice water sweat on a dry winter day?
  • What would the thermometer do after all the ice melted, and would it ever read higher than the room?

Learning targets

  • I can explain how temperature, thermal energy and heat differ, and compare samples using both their temperature and their amount of matter.
  • I can predict which way energy moves as heat between two objects, how each temperature changes, and when the net transfer stops.
  • I can use a particle model to describe and predict all six changes of state when thermal energy is added to or removed from a pure substance.
  • I can read and sketch heating and cooling curves and explain why a pure substance stays at one temperature while it melts, freezes, boils or condenses.
  • I can explain why different substances melt and boil at different temperatures using how strongly their particles attract one another.
  • I can design, test and improve a container that slows the transfer of energy into an ice cube, and explain with particles why it works.

What shows the learning happened

  • A measured melting curve with both the ice-water and bath temperatures graphed (Lab 1), plus a three-panel particle drawing that explains the flat stretch at 0 °C as energy going into freeing particles rather than speeding them up.
  • A ranked claim, backed by measured grams of ice melted, about which of four cups had the most thermal energy available to melt ice, including why the ice-cold cup melted almost none (Lab 2).
  • A class data table of percent ice lost for every insulating design and a written redesign rationale that combines features from at least two other designs and explains them with particles and trapped air (Lab 3).
  • A six-change sort or map that shows the direction of energy transfer for melting, freezing, evaporating, condensing, subliming and depositing, with an everyday example of each (W2 and the slide 15 check), and particle drawings for points on a heating curve (W4).
  • A CER paragraph (W6) that uses test data and a particle model to explain where the water on a cold container comes from, and a mastery quiz (W10) that distinguishes temperature, thermal energy and heat and predicts state changes without calculating energy.
  • A revised explanation of the sweating glass that names condensation, the source of the water vapor, and why the ice water stays at 0 °C (W1 revisited and the slide 22 discussion).

Key vocabulary 12 terms

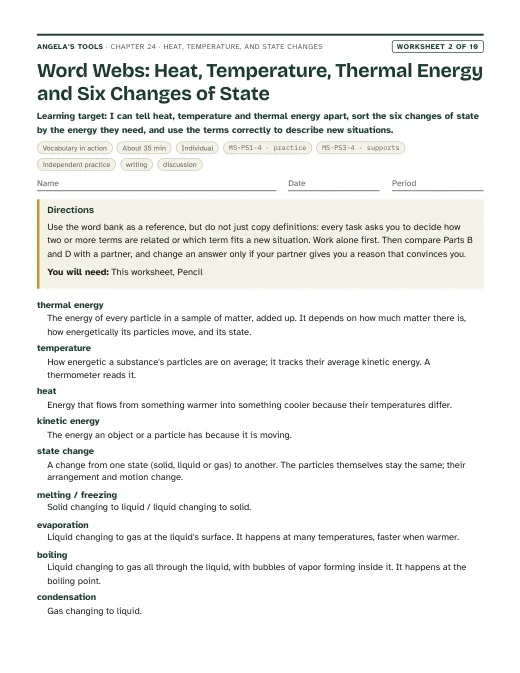
temperatureA measure of how energetic a substance's particles are on average: it tracks their average kinetic energy. A thermometer reports this average, not how much energy the whole sample holds.A thimble of boiling water and a huge pot of boiling water have the same temperature, 100 °C at sea level, because their molecules carry the same average energy of motion.
thermal energyThe sum of the energy of every particle in a sample, from their motion and from how they are arranged against the pulls between them. It depends on how much matter there is, its temperature and its state.The lake at 15 °C holds far more thermal energy than the campfire kettle at 90 °C, because it contains billions of times more water molecules.
heatEnergy that moves from a warmer object or region to a cooler one because of their temperature difference. In science, heat is energy on the move, not something an object stores.Heat flowed from the student's warm hand into the ice cube, so the hand cooled and the ice melted.
kinetic energyThe energy an object or particle has because it is moving. The faster a particle of a given mass moves, the more kinetic energy it has.As the soup warmed, its water molecules gained kinetic energy and moved faster on average.
state changeA change of a substance from one state (solid, liquid or gas) to another. The particles stay the same; only their motion and spacing change. Also called a change of state or phase change.Ice melting into water is a state change, because both are made of the same water molecules.
melting pointThe temperature at which a pure solid turns into a liquid. The liquid freezes at this same temperature. For water it is 0 °C at normal air pressure.Gallium's melting point is about 30 °C, so a piece of it can melt in a warm hand.
boiling pointThe temperature at which a liquid boils, forming bubbles of its own vapor throughout. It depends on air pressure: water boils at 100 °C at sea level and at a lower temperature high in the mountains.Rubbing alcohol boils at a lower temperature than water, since its molecules attract one another less strongly.
evaporationThe change from liquid to gas at a liquid's surface, as the most energetic particles escape. It happens at many temperatures, not only at the boiling point, and it cools the liquid left behind.Evaporation of sweat from your skin carries energy away and cools you, even though the sweat never boils.
condensationThe change from gas to liquid, as gas particles lose energy and their attractions hold them together when they collide. It releases energy to the surroundings.Condensation of water vapor from the air formed the drops on the outside of the cold can.
sublimationThe change from solid straight to gas without becoming a liquid first. Dry ice (solid carbon dioxide) sublimes at normal air pressure; snow can slowly sublime on dry, sunny, windy days.Sublimation shrank the block of dry ice in the cooler, yet it left no puddle.
depositionThe change from gas straight to solid without becoming a liquid first, as when water vapor turns into ice crystals on a surface colder than 0 °C. It releases energy.Deposition of water vapor from the air coated the car windshield with feathery frost overnight.
insulatorA material that slows the transfer of thermal energy. Many insulators, such as foam, wool and bubble wrap, work by trapping still air, which carries energy poorly.The foam cooler is a good insulator, so the ice inside gained energy from the hot beach air very slowly.

Standards alignment

California NGSS, Grade 7 Preferred Integrated Course Model. Each entry says whether this chapter's work assesses the performance expectation, gives practice toward it, or supports it as background; the resource lists below repeat this for every worksheet and lab.

MS-PS1-4Assesses: the whole PE: a qualitative particle model that predicts and describes how a pure substance's particle motion, temperature and state change as thermal energy is added or removedCA Grade 7

Develop a model that predicts and describes changes in particle motion, temperature, and state of a pure substance when thermal energy is added or removed.

Students build and use particle models of solids, liquids and gases for all six state changes, and in Lab 1 they predict, measure and model a melting curve, drawing what the particles are doing before, during and after melting and explaining why the temperature holds at 0 °C. The chapter stays inside the clarification statement: models are drawings and diagrams, and no task calculates energy.

MS-PS3-4Supports: the relationships among energy transferred, mass and temperature change, used as background onlyCA Grade 6

Plan an investigation to determine the relationships among the energy transferred, the type of matter, the mass, and the change in the average kinetic energy of the particles as measured by the temperature of the sample.

This is a California Grade 6 PE, so seventh graders are revisiting it. Lab 2 (which cup can melt the most ice) and the bath data in Lab 1 lean on its core idea that the energy a sample can transfer depends on its mass as well as its temperature, but students do not plan the full investigation the PE describes, and nothing calculates the total thermal energy transferred.

Assessment boundary: Assessment does not include calculating the total amount of thermal energy transferred.

MS-PS3-3Practice toward: designing, building and testing a device that minimizes thermal energy transferCA Grade 6

Apply scientific principles to design, construct, and test a device that either minimizes or maximizes thermal energy transfer.

This is a California Grade 6 PE. Lab 3 revisits it: students design, build and test an insulating container that slows the energy flowing from the room into an ice cube. The chapter treats the lab as practice of the Grade 6 PE in a Grade 7 context, connected to melting as a state change, and does not calculate energy transferred.

Assessment boundary: Assessment does not include calculating the total amount of thermal energy transferred.

MS-ETS1-3Assesses: analyzing test data from several designs to combine their best characteristics into a new design, through Lab 3CA Grade 6-8

Analyze data from tests to determine similarities and differences among several design solutions to identify the best characteristics of each that can be combined into a new solution to better meet the criteria for success.

In Lab 3 groups post their first-round melt data, compare the features of the best and worst designs across the class, and build a second version that combines the most effective characteristics, then retest it. The class data table and the written redesign rationale are direct evidence for this PE.

MS-ETS1-1Practice toward: stating criteria and constraints precisely, with the relevant scienceCA Grade 6-8

Define the criteria and constraints of a design problem with sufficient precision to ensure a successful solution, taking into account relevant scientific principles and potential impacts on people and the natural environment that may limit possible solutions.

Lab 3 gives students a design brief and asks them to restate its criteria and constraints as measurable targets (percent of ice lost, budget, size, access time) and to name the scientific principle each design choice relies on. The criteria are supplied rather than developed by students, so the role is practice.

MS-ETS1-2Practice toward: evaluating competing solutions against criteria and constraints with a systematic process, through W9CA Grade 6-8

Evaluate competing design solutions using a systematic process to determine how well they meet the criteria and constraints of the problem.

In W9 students score five frost-protection plans for a vineyard against stated criteria and constraints in a decision table, using the test data and the particle model of freezing and evaporation, before recommending one plan. The plans and their results are supplied rather than designed by students, so the role is practice.

Science and engineering practices

  • Developing and Using Models. Students draw particle models of each state and each state change, add energy arrows to a six-change model, and in Lab 1 draw what the particles are doing before, during and after melting to explain a measured temperature curve.
  • Planning and Carrying Out Investigations. Students measure a melting curve with two thermometers (Lab 1), gather mass and temperature evidence before testing which cup melts the most ice (Lab 2), and run fair tests of insulated containers against a bare control (Lab 3).
  • Analyzing and Interpreting Data. Students graph and interpret heating and cooling curves, identify where a state change happens from a flat stretch, compare grams of ice melted across cups, and compute percent of an ice cube lost for each design.
  • Constructing Explanations and Designing Solutions. Students explain the sweating glass and the stubborn thermometer with particles and energy transfer, and design and improve an insulating container within criteria and constraints.
  • Engaging in Argument from Evidence. In Lab 2 students argue which cup had the most thermal energy available to melt ice, using measured evidence to rebut the claim that the hottest cup always wins.

Disciplinary core ideas

  • PS1.A Structure and Properties of Matter. In solids particles vibrate in fixed positions, in liquids they slide past one another, and in gases they move freely and far apart; changes of state happen as temperature (or pressure) changes, at temperatures set by how strongly a substance's particles attract.
  • PS3.A Definitions of Energy. Temperature tracks how much kinetic energy particles have on average and does not directly measure total thermal energy, which also depends on the amount of matter and its state; in science, heat means only energy transferred because of a temperature difference.
  • PS3.B Conservation of Energy and Energy Transfer. Energy moves as heat from warmer to cooler matter until temperatures are equal; how much energy a sample can give depends on its mass and how far it can cool (Lab 2); insulators slow the transfer (Lab 3). This idea is developed in Grade 6 in California and revisited here.
  • ETS1.B Developing Possible Solutions. Students test competing insulating designs, compare results across the class, and combine the best features of several designs into an improved version (Lab 3); in W9 they evaluate five frost-protection plans against criteria and constraints in a decision table before choosing one.

Crosscutting concepts

  • Cause and Effect. Adding or removing thermal energy causes predictable changes in particle motion, temperature and state; students use these cause-and-effect links to predict which change happens in a new situation.
  • Energy and Matter. Students track energy across a system boundary: the warm bath cools while the ice water holds at 0 °C (Lab 1), and the energy that melts ice comes from water that cools (Lab 2) or from the room (Lab 3).
  • Scale, Proportion, and Quantity. A thermometer reading is a property of the whole sample that reflects the average behavior of an enormous number of particles; doubling the amount of matter at the same temperature doubles its thermal energy but not its temperature.
  • Systems and System Models. In each lab students name the system (the ice and its meltwater), its surroundings (bath, cup of water or room) and the boundary energy crosses, and they state what their particle drawings leave out.

Presentation 26 slides

Heat, Temperature, and State Changes: where the energy goes. Original, editable slides with speaker notes: a phenomenon opener, learning targets, the chapter's concepts with diagrams, vocabulary in context, 3 checks for understanding, 2 discussion prompts, an application task, a misconception check, a synthesis and an exit ticket.

Worksheets 10 of 10

Ten different tasks, one per instructional blueprint. Each has a student PDF (low ink, US Letter), an editable DOCX, an HTML preview, and a separate teacher answer key with reasoning.

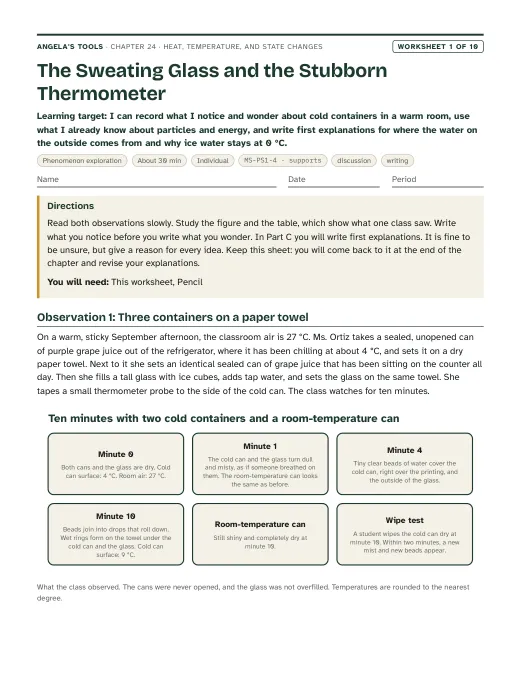
First page of The Sweating Glass and the Stubborn Thermometer
Worksheet 1 · Phenomenon exploration

The Sweating Glass and the Stubborn Thermometer

I can record what I notice and wonder about cold containers in a warm room, use what I already know about particles and energy, and write first explanations for where the water on the outside comes from and why ice water stays at 0 °C.

30 minindividualActivates prior knowledgeDiscussionWriting MS-PS1-4 · supports
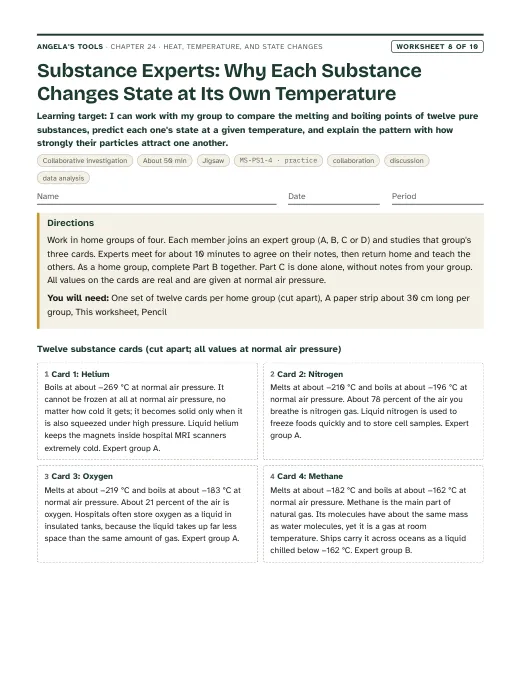
First page of Substance Experts: Why Each Substance Changes State at Its Own Temperature
Worksheet 8 · Collaborative investigation

Substance Experts: Why Each Substance Changes State at Its Own Temperature

I can work with my group to compare the melting and boiling points of twelve pure substances, predict each one's state at a given temperature, and explain the pattern with how strongly their particles attract one another.

50 minjigsawPracticeCollaborationDiscussionData analysis MS-PS1-4 · practice
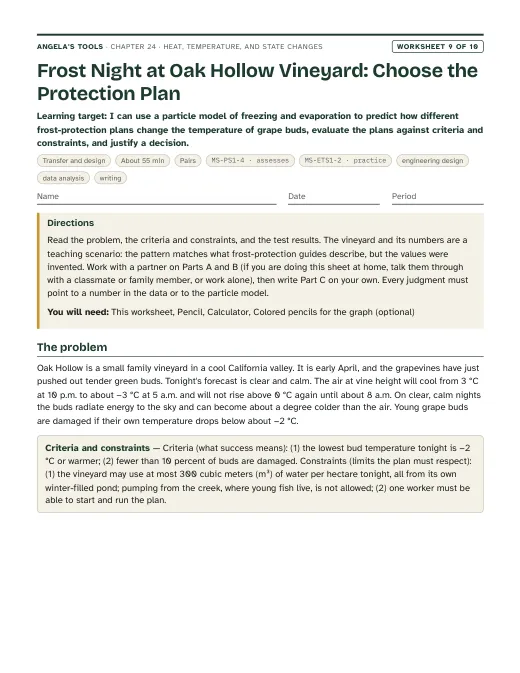
First page of Frost Night at Oak Hollow Vineyard: Choose the Protection Plan
Worksheet 9 · Transfer and design

Frost Night at Oak Hollow Vineyard: Choose the Protection Plan

I can use a particle model of freezing and evaporation to predict how different frost-protection plans change the temperature of grape buds, evaluate the plans against criteria and constraints, and justify a decision.

55 minpairsExtensionEngineering designData analysisWriting MS-PS1-4 · assessesMS-ETS1-2 · practice
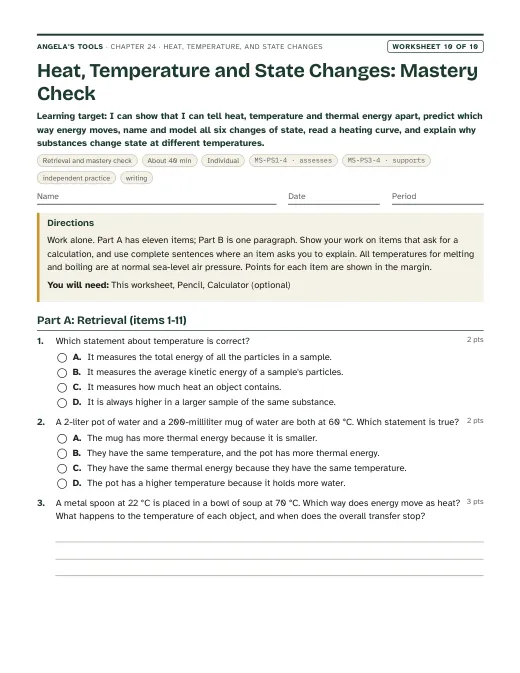
First page of Heat, Temperature and State Changes: Mastery Check
Worksheet 10 · Retrieval and mastery check

Heat, Temperature and State Changes: Mastery Check

I can show that I can tell heat, temperature and thermal energy apart, predict which way energy moves, name and model all six changes of state, read a heating curve, and explain why substances change state at different temperatures.

40 minindividualAssessmentIndependent practiceWriting MS-PS1-4 · assessesMS-PS3-4 · supports

Collaborative labs 3 of 3

Three different investigation approaches. Each has a teacher guide (purpose, materials with quantities, estimated cost, prep, safety, procedure, expected observations, debrief, answer key, assessment criteria, accessibility adaptations, low-cost alternative) and a student recording sheet.

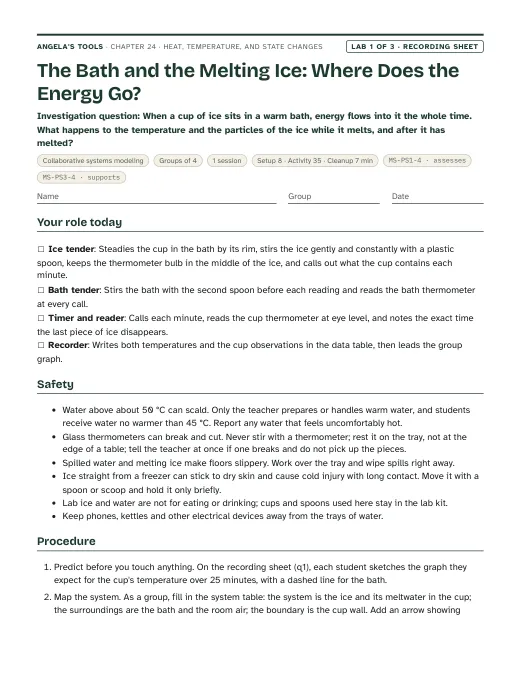
First page of the The Bath and the Melting Ice: Where Does the Energy Go? recording sheet
Lab 1 · Collaborative systems modeling

The Bath and the Melting Ice: Where Does the Energy Go?

When a cup of ice sits in a warm bath, energy flows into it the whole time. What happens to the temperature and the particles of the ice while it melts, and after it has melted?

Groups of 41 session35 min activityEst. About 5 per class with thermometers on hand; about 30 to 70 if alcohol thermometers must be bought (more for digital probes)Crushed ice straight from a freezerThin clear plastic cup, 9 to 12 oz (270 to 350 mL)Plastic tub or mixing bowl holding at least 3 L MS-PS1-4 · assessesMS-PS3-4 · supports
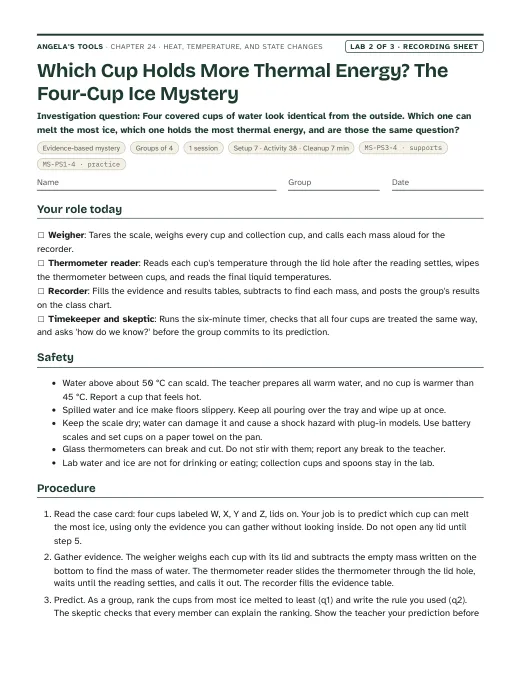
First page of the Which Cup Holds More Thermal Energy? The Four-Cup Ice Mystery recording sheet
Lab 2 · Evidence-based mystery

Which Cup Holds More Thermal Energy? The Four-Cup Ice Mystery

Four covered cups of water look identical from the outside. Which one can melt the most ice, which one holds the most thermal energy, and are those the same question?

Groups of 41 session38 min activityEst. About 15 to 25 per class with scales on hand; about 50 to 80 if scales must be bought16-oz (about 470 mL) foam cups with lids that have a sip hole, labeled W, X, Y and Z, empty mass written on the bottomClear plastic collection cups, labeled W to Z, empty mass written on eachIce cubes or crushed ice held at 0 °C in an ice-water cooler, drained before use MS-PS3-4 · supportsMS-PS1-4 · practice
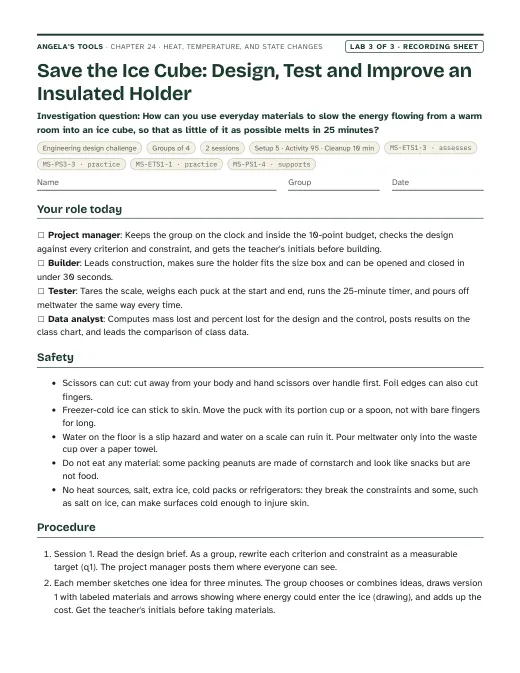
First page of the Save the Ice Cube: Design, Test and Improve an Insulated Holder recording sheet
Lab 3 · Engineering design challenge

Save the Ice Cube: Design, Test and Improve an Insulated Holder

How can you use everyday materials to slow the energy flowing from a warm room into an ice cube, so that as little of it as possible melts in 25 minutes?

Groups of 42 sessions95 min activityEst. About 10 to 20 per class with scales on hand; about 40 to 70 if pocket scales must be boughtIce pucks: 15 g (15 mL) of tap water frozen overnight in 1-oz (30 mL) portion cups3-oz (about 90 mL) clear plastic cups to hold the puck during each testPocket digital scale reading to 0.1 g MS-ETS1-3 · assessesMS-PS3-3 · practiceMS-ETS1-1 · practiceMS-PS1-4 · supports

Teacher guidance

Suggested sequence (8 steps)
  1. Period 1: Presentation slides 1-10 (the sweating glass, targets, temperature, thermal energy, heat as energy moving across a temperature difference, the heat-direction check, the camper discussion). W1 phenomenon worksheet as the opener alongside slide 2 (Parts A and B in class, Part C for homework if time runs short); students keep it to revise in Period 7 or 8.
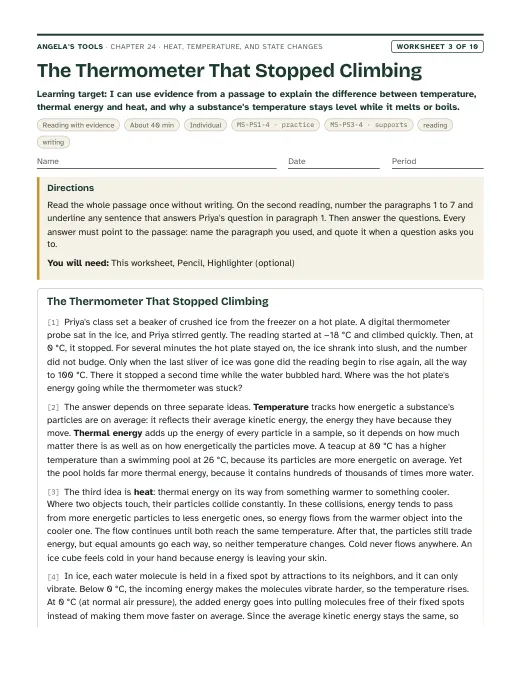
  2. Period 2: Lab 1, The Bath and the Melting Ice. Groups predict the shape of the curve, then measure the temperature of melting ice and of the warm bath around it every minute, and graph both. Leave the flat stretch unexplained in class. W3 reading (The Thermometer That Stopped Climbing) for homework.
  3. Period 3: Slides 11-15 (states and the six changes, the particle panels, the six-change map with energy directions, vocabulary, the name-the-change check). Optional frost demonstration: a steel can of crushed ice and salt grows frost on its outside. W2 vocabulary word webs in class.
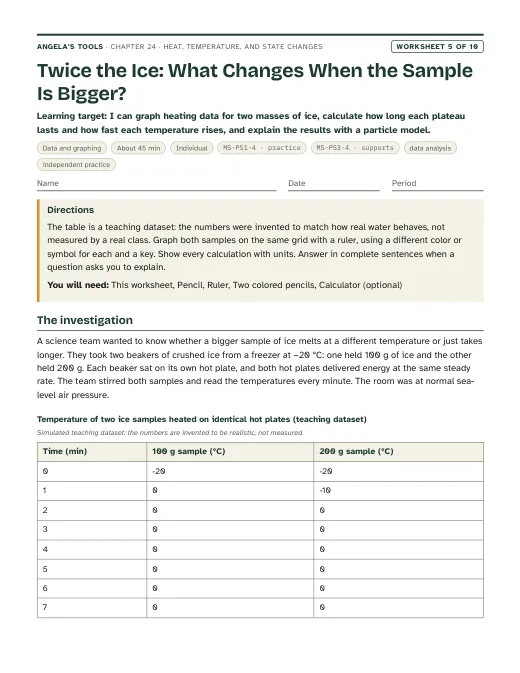
  4. Period 4: Lab 2, Which Cup Holds More Thermal Energy? Groups measure four covered cups, predict which can melt the most ice, test with equal masses of ice, and argue from the grams melted; close by revisiting the slide 10 camper discussion. W5 data worksheet (Twice the Ice) for homework.
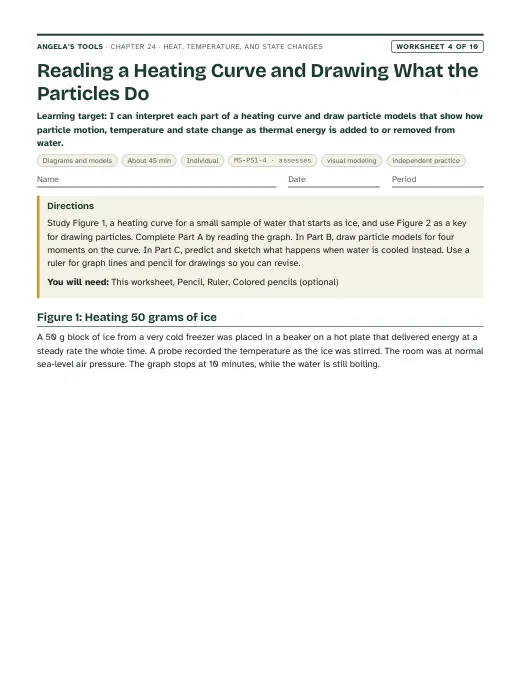
  5. Period 5: Slides 16-21 (why the temperature holds steady, the idealized heating curve, the curve check, evaporation versus boiling, attractions and melting and boiling points, the California frost-protection connection). Students annotate the flat stretch on their Lab 1 graphs. W4 diagram worksheet begun in class and finished at home.
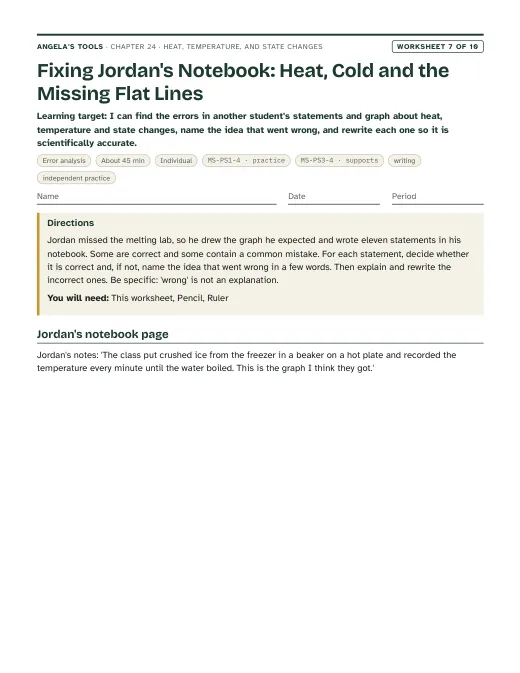
  6. Period 6: Lab 3 session 1, Save the Ice Cube: criteria and constraints, design, budget, build, and the first 25-minute test against a bare control. W7 misconception repair for homework.
  7. Period 7: Lab 3 session 2: post class data, compare features, redesign and retest. During the round 2 test wait, run the slide 22 discussion and the slide 23 bath-data task at the tables. W9 transfer problem (frost-protection plans) for homework.
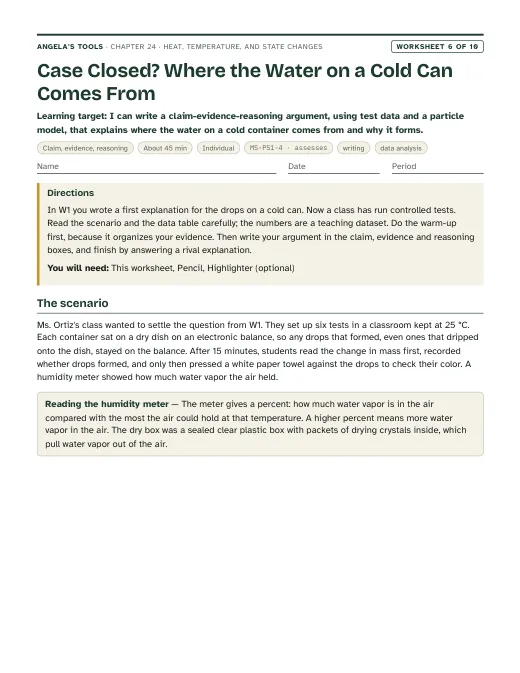
  8. Period 8: W8 Substance Experts jigsaw on why each substance changes state at its own temperature, then slides 24-26 (misconception, synthesis, exit ticket; give the exit ticket at the start of the next class if the jigsaw runs long). Students finish revising their W1 explanation. W6 CER (where the water on a cold can comes from) and W10 mastery quiz on the following assessment day or days.

Materials overview: No flames and no water above 45 °C for students; the teacher prepares any warm water and handles anything hotter than 50 °C. Lab 1 uses crushed ice, a tub of warm tap water, two thermometers per group, plastic cups and spoons. Lab 2 uses lidded foam cups of water prepared at four masses and temperatures, ice, a kitchen scale, thermometers and a strainer. Lab 3 uses small homemade ice pucks, plastic cups, everyday insulating scraps (foil, cotton balls, felt, newspaper, bubble wrap, packing peanuts, cardboard), tape and a 0.1-gram pocket scale. Optional demonstrations: a glass of ice water on a humid day, a steel can of ice and salt that grows frost, and an electric kettle (teacher only) for the boiling-point plateau. Glass thermometers must be alcohol-filled, never mercury.

Common misconceptions (7)
“Heat and temperature are the same thing, so the hotter object always has more thermal energy.”
Why it happens: Everyday speech uses 'heat' for hotness, and a thermometer is the only energy measurement most students have seen, so a bigger number seems to mean more energy.
Correction: Temperature is an average per particle; thermal energy is a total. A bathtub of warm water holds far more thermal energy than a mug of hot cocoa, since it contains many more particles. Heat is neither: it is energy moving because of a temperature difference.
“Cold flows out of ice into your hand, or into a drink.”
Why it happens: We feel cold spreading into our skin, and phrases like 'let the cold in' treat cold as a substance.
Correction: Only energy moves, and it always moves from the warmer object to the cooler one. Your hand feels cold because energy is leaving it and flowing into the ice.
“Adding heat to something always makes its temperature go up.”
Why it happens: Most heating students see (a stove, the sun on a car) raises temperature, and the textbook's own summary links gaining energy with rising temperature.
Correction: While a pure substance melts or boils at a steady pressure, its temperature stays at the melting or boiling point even though energy keeps flowing in. That energy goes into separating particles from one another, not into making them move faster on average.
“The water on the outside of a cold can leaked or soaked through from inside.”
Why it happens: The water appears right where the cold drink is, and students do not think of air as containing water.
Correction: The can is sealed; the water comes from invisible water vapor in the room air. Vapor that touches the cold surface loses energy and condenses. A can of cold juice and a cold empty can both sweat, and neither sweats much in very dry air.
“The bubbles in boiling water are air, and the white cloud above a kettle is steam (a gas).”
Why it happens: Bubbles in soda are gas from outside the liquid, and people call the visible cloud 'steam'.
Correction: The large bubbles in boiling water are water vapor formed inside the liquid. Water vapor is invisible; the white cloud is tiny droplets of liquid water that formed when the vapor cooled in the air, so it is condensation. The same is true of the fog around dry ice.
“Liquids only turn into gas when they boil.”
Why it happens: Boiling is dramatic and has a famous temperature, while evaporation is slow and invisible.
Correction: Evaporation happens at the surface at many temperatures, because some particles always have enough energy to escape; that is how puddles dry on cool days. Boiling is the special case where vapor forms throughout the liquid at the boiling point.
“A sweater or blanket makes heat, so wrapping ice in fleece will melt it faster.”
Why it happens: Students feel warm in a sweater and conclude that the fabric is a source of warmth.
Correction: Fabric produces no energy. It traps still air and slows the transfer of energy in either direction: it keeps body energy in on a cold day and keeps room energy out of an ice cube. Lab 3 tests this directly.
Differentiation suggestions (5)
  • Multilingual learners: Pre-teach the three core words with a visual anchor chart: temperature = average (one thermometer, one number), thermal energy = total (many particles added up), heat = moving (an arrow from warm to cool). Provide sentence frames such as 'Energy moved from ___ to ___ because ___ was warmer' and 'The temperature stayed at ___ because the energy was ___'. Cognates help: temperatura, energía térmica, evaporación, condensación, sublimación.
  • Students who need more support: Give a partly labeled six-change map with the states placed and the arrows drawn, so students add only names and energy signs. In Lab 1 provide graph axes already scaled and the first three data points plotted; in Lab 2 provide a prediction table with the 'more water' and 'warmer' columns already headed. Chunk the heating curve into its four segments and ask one question per segment.
  • Students ready for extension: Ask why salt water and candle wax do not show a sharp flat stretch (they are mixtures), why water boils below 100 °C in Lake Tahoe or Mammoth Lakes, or why an ice cube made from boiled water and one made from tap water melt at the same temperature. In Lab 2 invite them to design a test of whether doubling the water doubles the ice melted, without any energy calculations.
  • Students who need movement or alternative output: Run a human particle model: students stand close and sway (solid), then 'gain energy' cards let a few break away and walk slowly (melting), then jog to the walls (gas); during the 'melting' round the teacher points out that the energy cards go to breaking free, not to faster swaying. Accept a labeled photo of the human model, a spoken recording or a comic strip as the particle model for any written task.
  • Students with limited fine-motor control or low vision: Use digital thermometers with large displays and a partner who calls readings aloud; give the reader or recorder role in labs rather than handling glassware. Provide large-print graph paper and a tactile graph made with pins and string. Particle models can be built with magnets or counters on a tray instead of drawn.
Accuracy notes: where the textbook simplifies (13)
  • Temperature holds steady during a change of state: the Key Science Concept (p. 318) and the section 2 opener (p. 314) say gaining thermal energy speeds particles up and raises the temperature, and that this is what melts, evaporates or sublimes a substance. Read literally, that suggests the temperature keeps rising during melting. For a pure substance at steady pressure, the temperature stays at the melting or boiling point until the change is complete; the energy goes into overcoming attractions between particles. The book hints at this (ice held at 0 °C on p. 314) but never says it. This chapter states it plainly and tests it in Lab 1.
  • Average kinetic energy, not average speed: the margin note (p. 310) and the Lesson Summary (p. 319) say temperature measures average speed, while the vocabulary box and section 1 correctly say average kinetic energy. At the same temperature, lighter particles move faster on average than heavier ones, so speeds can be compared only within one substance. This chapter defines temperature by average kinetic energy and uses 'faster' only when comparing the same substance at two temperatures; between different objects, it speaks of more and less energetic particles.
  • State-change temperatures need conditions: 0 °C, 100 °C and −269 °C (pp. 314-319) hold at normal sea-level air pressure. Boiling points drop where the air pressure is lower, and dry ice sublimes rather than melts because liquid carbon dioxide cannot exist at ordinary pressure. Every value in this chapter says 'at normal air pressure' or 'at sea level'. The helium values are correct: it boils near −269 °C and cannot be frozen at normal pressure.
  • Molten metal freezes at its melting point, not at room temperature: section 3 (p. 317) says molten metal becomes solid as it cools to room temperature. A liquid metal freezes at its own melting point (about 660 °C for aluminum) and only then cools further as a solid. Freezing is a change of state, not a particular coldness.
  • Evaporation and condensation are not tied to the boiling point: section 2 (p. 315) says collisions can push a particle 'past the boiling point', mixing a particle's energy with a temperature that belongs to the whole liquid; section 3 (p. 316) says condensation happens at 100 °C. Water evaporates at many temperatures and water vapor in air condenses far below 100 °C, as on a cold can. This chapter teaches evaporation as surface escape at any temperature and boiling as vapor forming throughout the liquid at the boiling point.
  • Figure 3A (p. 316) labels the particles that stick together as 'fast-moving' while the text says they slow down first. Teach that gas particles lose energy and slow before their attractions can hold them together.
  • How much a sample can thaw depends on more than its thermal energy: section 1 and Figure 1 (pp. 310-311) compare a bowl of room-temperature water with a cup of boiling water and say even the cup has more thermal energy than the bag of frozen peas, without giving amounts. Total thermal energy depends on temperature, amount of matter and state, and the energy a sample can give a colder object depends on its mass and how far it can cool. Lab 2 makes this concrete; its ice-cold cup has plenty of thermal energy yet melts almost no ice because there is no temperature difference.
  • Thermal energy includes more than motion: the vocabulary box (p. 309) defines thermal energy as energy related to particle motion. The NGSS box on the same page notes that total thermal energy depends on the state of the material as well, because energy is also stored in how particles are arranged against their attractions. That stored part is what changes during melting and boiling. The same box quotes the standards' wording that temperature is proportional to average kinetic and potential energy per particle; for middle school, link temperature to average kinetic energy and keep the arrangement energy as part of thermal energy that a thermometer does not read.
  • The cooling panel of the Comparing Heat, Thermal Energy, and Temperature spread (p. 313) shows both pots reading 0 °C while heat flows from each pot into the ice packed around it. That requires ice colder than 0 °C; the page does not say so. This chapter teaches that heat flows only when there is a temperature difference.
  • The white fog in the dry-ice photo (p. 315) is not carbon dioxide, which is colorless; it is tiny droplets of liquid water condensed from the air by the cold gas. Likewise the white cloud over a kettle or a geyser is condensed droplets; true water vapor is invisible.
  • Water's attractions are strong only by comparison: section 4 (p. 319) contrasts water's 'very strong' attractions with helium's weak ones. Compared with the forces holding table salt (melting point 801 °C) or iron (1,538 °C) together, the attractions between water molecules are modest. Keep the comparison relative.
  • Gold-coated insects (p. 317) are real: scientists coat specimens with a metal film far thinner than paint so they can be imaged in a scanning electron microscope. In the usual method gold atoms are knocked loose from a gold target in a low-pressure chamber rather than boiled off, and they collect as a solid on the specimen. It is a fair example of gas-to-solid deposition, but frost on a cold window is the clearer everyday case, and the gold example is not assessed.
  • Word forms: the lesson uses 'sublime' and 'sublimate' (p. 314) for the same change, and switches between deposit, depositing and deposition, condense and condensation. All name the same processes. This chapter uses the noun forms (sublimation, deposition) in vocabulary and the -ing forms on the six-change map.

Review status: reviewed · 2026-10-19 · Verified the earlier link fixes are in place: slides 5 and 10 point to Lab 2, W5 and W3 (not W6); slides 13 and 15 point to W2 for the six-change sort; slide 20 points to the W8 Substance Experts jigsaw; slide 22 points to the W1 revision and the W6 cold-can CER; evidenceOfLearning names W2 and the slide 15 check for the six-change model and W4 for heating-curve particle drawings. Every slide, period and lab cross-reference was checked against the files as written. Added MS-ETS1-2 (caGrade 6-8, practice) to chapter standards and to the ETS1.B dimension, because W9 has students score five frost-protection plans in a decision table; caGrade checked on every standards entry (MS-PS1-4 7; MS-PS3-4 and MS-PS3-3 6, each labeled as a California Grade 6 PE). Science and numbers re-solved: the slide 17 heating curve (1.25 : 8 : 10 minutes) and the W5 dataset (1 : 8 : 10) match water's real ratios for warming ice from −25 or −20 °C, melting and warming the liquid to 100 °C; W4's 0.5 : 2.5 : 3 is approximate and captioned as such. The slide 5 snow figures (0.25 kg and 75 kg) and the slide 23 bath data are consistent. Lab 2's four cups give ideal melts of about 22, 55, 88 and 2 g (W, X, Y, Z), so the Y, X, W, Z ranking holds and every cup keeps leftover ice; the thermal-energy ranking Y, X, Z, W is sound. Frost-protection claims (latent heat released, ice-water coat near 0 °C, run sprinklers until the ice melts, about 3 mm of water per hour) match the FAO guide. Every melting and boiling point checks out at normal pressure. Fixed: the slide 10 notes said a pot of 30 °C water with several times the mug's water melts several times as much ice (it needs more than three times the water just to tie); the W8 q7 premise that air cooled to −190 °C at normal pressure would hold liquid oxygen (real air does not start to liquefy until a little below −191 °C; it now uses two tanks of pure gas); the W6 scenario had students blot the drops before weighing; the Lab 2 teacher notes pointed to the W6 CER as a cup-data follow-up; the W2 q6 key mentioned a 'fuzzy coating' that is not on that sheet; slide 21 now says young salmon and steelhead; the Lab 1 thermometer cost range now matches its own basis. Pacing: Period 1 (slides 1-10 plus W1) and Period 8 (the W8 jigsaw plus slides 24-26) ran past 55 minutes, so the sequence now lets W1 Part C and the exit ticket move to homework or the next class; W6 and W10 together need about 85 minutes, so the plan now allows one or two assessment periods; W9's directions now cover doing it as homework. Originality: no six-word run from the lesson text outside cited section titles. All labs state that they have not been physically tested.

Source references

Verified against the student edition of Bring Science Alive! 7th Grade Integrated (Student Edition). Printed page numbers appear in the book; PDF pages are the physical pages of the 524-page scan (printed + 36). The textbook is not reproduced on this site.

SectionPrinted pagesPDF pagesUsed for
Introduction: the winter geyser, the lesson question, vocabulary and the NGSS box308, 309344, 345Lesson question, vocabulary terms, the publisher's standards box and its note that total thermal energy depends on temperature, amount and state (accuracy notes, slide 1).
1. Thermal Energy, Temperature, and Heat310, 311346, 347Temperature as average kinetic energy, thermal energy depending on the number of particles, heat as energy transferred from warmer to cooler by collisions, equal exchange at the same temperature (slides 4-10, Lab 2).
Spread: Comparing Heat, Thermal Energy, and Temperature312, 313348, 349Two pot sizes at the same temperature with different thermal energy, heat arrows from flame to pot and pot to ice (slide 5 compare diagram; the cooling-panel issue in accuracy notes).
2. Objects Gain Thermal Energy: melting, evaporating, subliming314, 315350, 351Particle descriptions of melting at 0 °C, evaporation at the surface versus boiling throughout, dry ice subliming (slides 11-16, 19, Lab 1).
3. Objects Lose Thermal Energy: condensing, freezing, depositing316, 317352, 353Condensation on a cooler lid, freezing as particles lock into place, deposition of frost and the gold-coating example (slides 11-15, 21-22; accuracy notes).
Key Science Concept: Gaining or Losing Thermal Energy Causes State Changes318354The six-arrow model with energy added or removed, rebuilt as the slide 13 map; the steady-temperature gap noted in accuracy notes.
4. Attractions Between Particles319355Different melting and boiling points from different strengths of attraction, helium versus water (slide 20).
Lesson Summary319355Checking that every summary idea is covered by a target, a slide and a lab; the 'average speed' wording corrected in accuracy notes.

External references used for accuracy checks

Related chapters