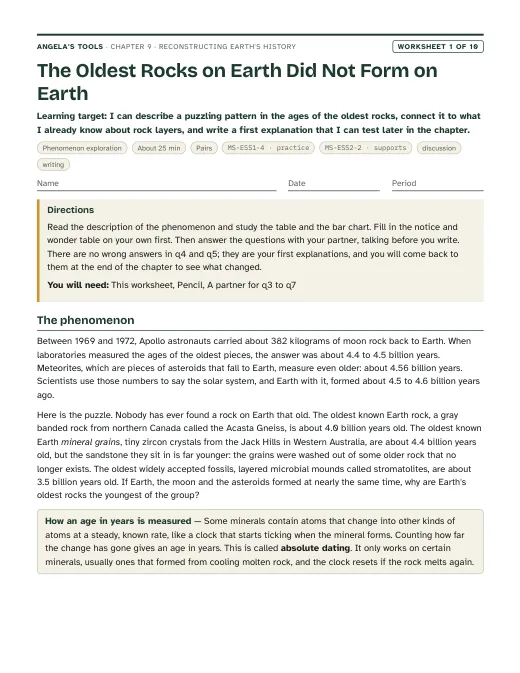
The Oldest Rocks on Earth Did Not Form on Earth
I can describe a puzzling pattern in the ages of the oldest rocks, connect it to what I already know about rock layers, and write a first explanation that I can test later in the chapter.
Chapter 09 · Unit 3: Earth Processes Through Geologic Time · Segment 1
How do scientists use rocks, fossils and dated materials to reconstruct and organize a history that no one was there to see?
Students figure out how geologists reconstruct a 4.54-billion-year history that nobody witnessed. They start from a puzzle: the oldest rocks on Earth are far younger than Earth itself, so the planet's first chapter has to be read from meteorites, moon rocks and tiny mineral grains. They learn to stitch rock sequences from different places into one longer record, to recognize that the boundaries on the geologic time scale sit where the fossils change most, and to use a scaled timeline to feel how little of Earth's history belongs to animals, let alone to people. Along the way they trace the origin of the core, the moon, the oceans, oxygen, mass extinctions, drifting continents and the ice age we live in now.
Estimated class time: presentation about 143 minutes · worksheets about 395 minutes in total · labs 4 sessions. Seven 50-minute periods: one for the phenomenon and reading strata; one for the time scale and the string model (Lab 1); one for Earth's origins and oxygen; two for the strata-correlation mystery (Lab 2) and the extinction story; one for the fossil-group decision lab (Lab 3), continents and ice; one for synthesis, the CER and the mastery check.
Geologists have dated rocks from every continent. The oldest whole rock found so far, a gneiss in northern Canada, is about 4.0 billion years old. A few sand-sized zircon crystals in Western Australia are older, about 4.4 billion years, but the rock they sit in is much younger. Meteorites that fall from space give ages of about 4.57 billion years, and the oldest rocks the Apollo astronauts carried back from the moon give 4.4 to 4.5 billion. So the solar system is clearly older than any rock Earth has kept. If Earth's own record is missing its first chapter, how do scientists know how old the planet is, and how do they rebuild the rest of the story?
Notice and wonder prompts
California NGSS, Grade 7 Preferred Integrated Course Model. Each entry says whether this chapter's work assesses the performance expectation, gives practice toward it, or supports it as background; the resource lists below repeat this for every worksheet and lab.
Construct a scientific explanation based on evidence from rock strata for how the geologic time scale is used to organize Earth’s 4.6-billion-year-old history.
This is a California Grade 8 performance expectation in the Preferred Integrated sequence, so in a Grade 7 class it is an early encounter with the idea, not the year's assessed standard. Even so, Lab 2 asks students to build a composite rock sequence from three sites and locate the levels where fossils change, and Lab 2, W6 and W10 ask them to explain in writing how such strata evidence organizes Earth's history, which is evidence toward the PE as written. In line with the assessment boundary, no task asks students to recall the names of periods or epochs.
Assessment boundary: Assessment does not include recalling the names of specific periods or epochs and events within them.
Construct an explanation based on evidence for how geoscience processes have changed Earth’s surface at varying time and spatial scales.
The lesson's events run from an asteroid impact that reshaped the surface in a day to the 50-million-year collision that is still raising the Himalayas and the ice sheets that carved the Great Lakes basins over thousands of years. Slides 23-24 and W9 have students explain these changes at their proper time scales, which builds this Grade 7 PE without yet assessing it.
Analyze and interpret data for patterns in the fossil record that document the existence, diversity, extinction, and change of life forms throughout the history of life on Earth under the assumption that natural laws operate today as in the past.
A California Grade 8 performance expectation; this lesson supplies background for it. Lab 3 and W5 have students count fossil groups layer by layer in a simulated sequence and find where the biggest losses fall, which is the pattern-finding half of the PE. Names of species and eras are not assessed, in keeping with its assessment boundary.
Assessment boundary: Assessment does not include the names of individual species or geological eras in the fossil record.
Reconstructing Earth's History: reading a story no one watched. Original, editable slides with speaker notes: a phenomenon opener, learning targets, the chapter's concepts with diagrams, vocabulary in context, 3 checks for understanding, 2 discussion prompts, an application task, a misconception check, a synthesis and an exit ticket.

Ten different tasks, one per instructional blueprint. Each has a student PDF (low ink, US Letter), an editable DOCX, an HTML preview, and a separate teacher answer key with reasoning.
I can describe a puzzling pattern in the ages of the oldest rocks, connect it to what I already know about rock layers, and write a first explanation that I can test later in the chapter.
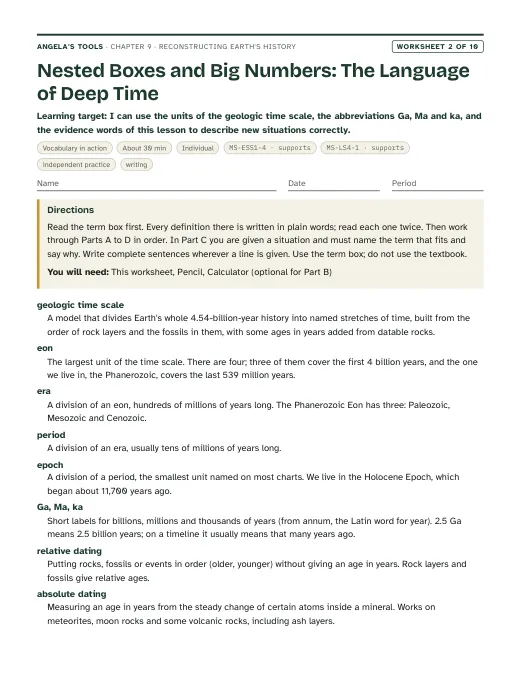
I can use the units of the geologic time scale, the abbreviations Ga, Ma and ka, and the evidence words of this lesson to describe new situations correctly.
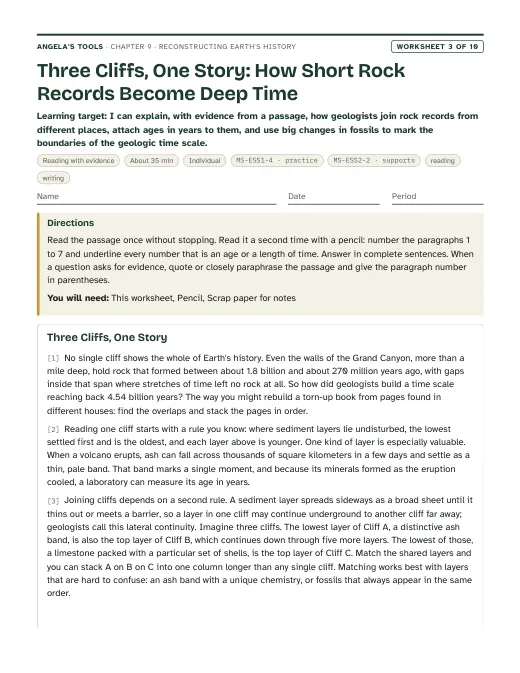
I can explain, with evidence from a passage, how geologists join rock records from different places, attach ages in years to them, and use big changes in fossils to mark the boundaries of the geologic time scale.
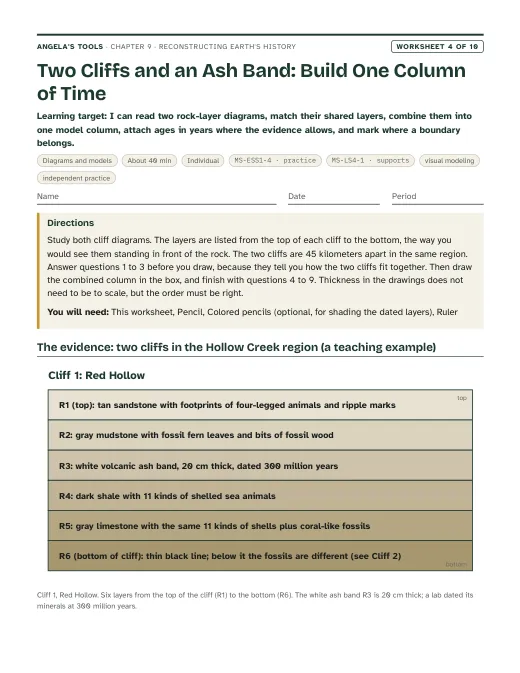
I can read two rock-layer diagrams, match their shared layers, combine them into one model column, attach ages in years where the evidence allows, and mark where a boundary belongs.
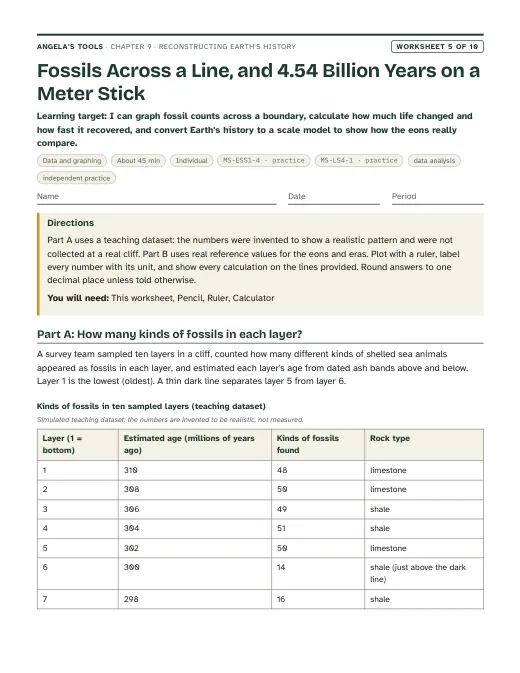
I can graph fossil counts across a boundary, calculate how much life changed and how fast it recovered, and convert Earth's history to a scale model to show how the eons really compare.
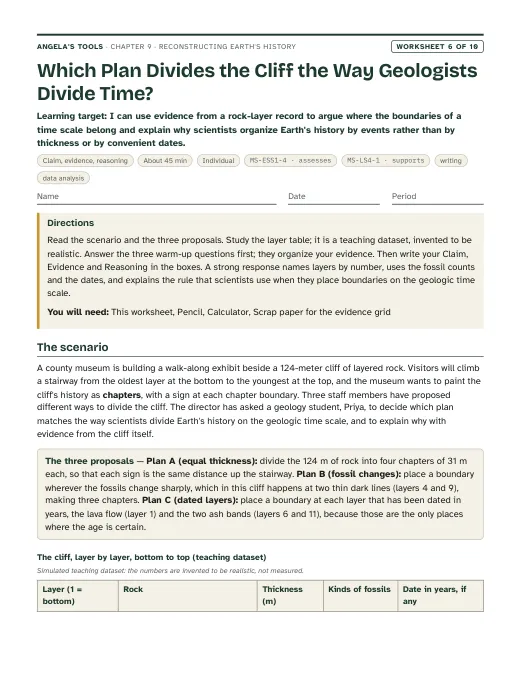
I can use evidence from a rock-layer record to argue where the boundaries of a time scale belong and explain why scientists organize Earth's history by events rather than by thickness or by convenient dates.
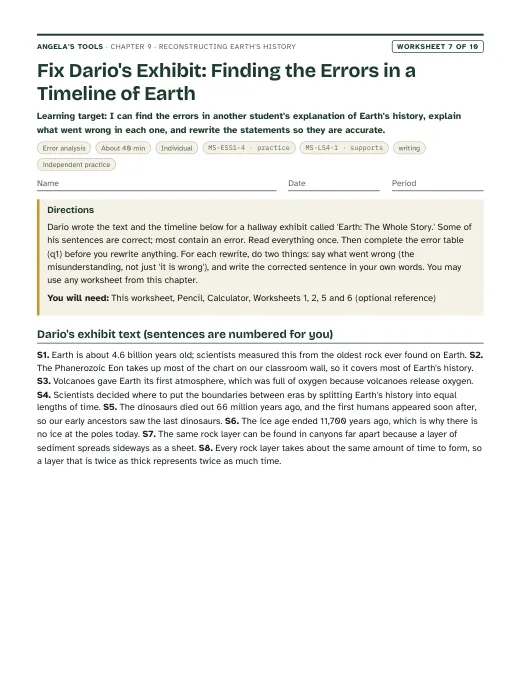
I can find the errors in another student's explanation of Earth's history, explain what went wrong in each one, and rewrite the statements so they are accurate.
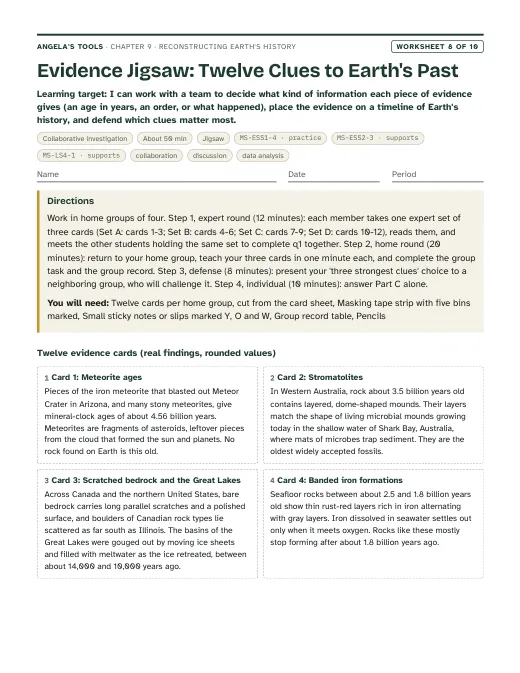
I can work with a team to decide what kind of information each piece of evidence gives (an age in years, an order, or what happened), place the evidence on a timeline of Earth's history, and defend which clues matter most.
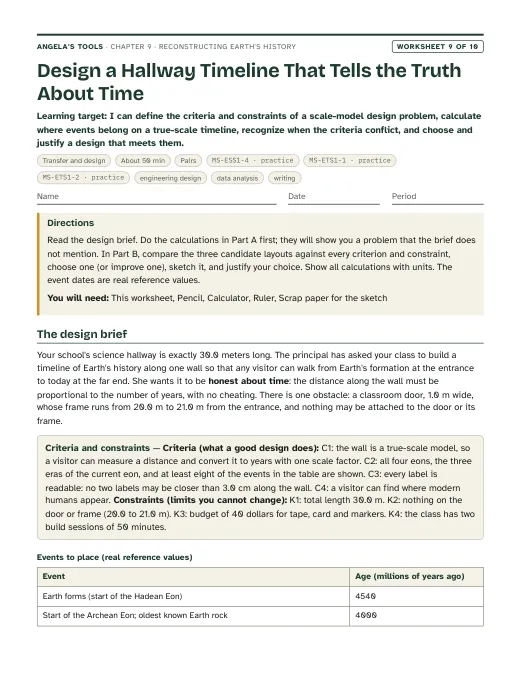
I can define the criteria and constraints of a scale-model design problem, calculate where events belong on a true-scale timeline, recognize when the criteria conflict, and choose and justify a design that meets them.
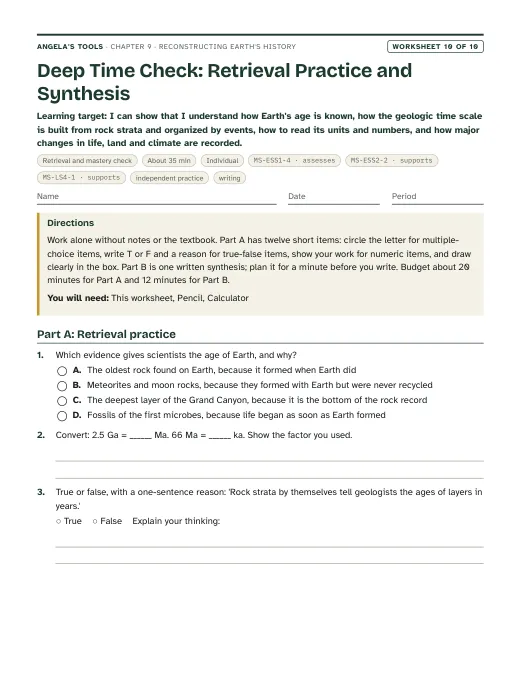
I can show that I understand how Earth's age is known, how the geologic time scale is built from rock strata and organized by events, how to read its units and numbers, and how major changes in life, land and climate are recorded.
Three different investigation approaches. Each has a teacher guide (purpose, materials with quantities, estimated cost, prep, safety, procedure, expected observations, debrief, answer key, assessment criteria, accessibility adaptations, low-cost alternative) and a student recording sheet.
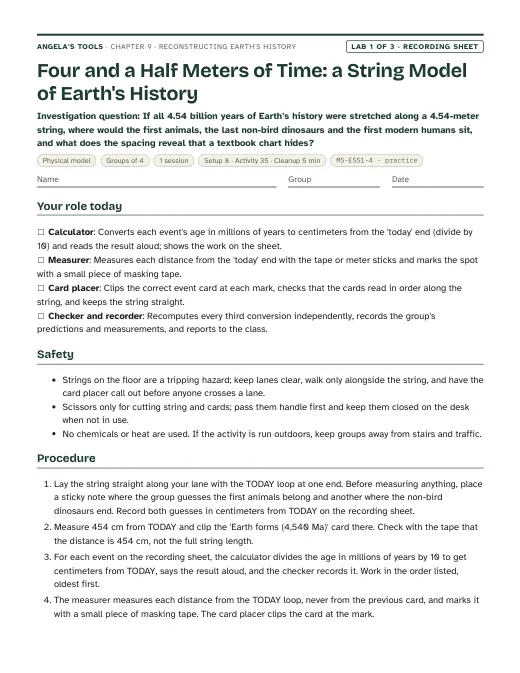
If all 4.54 billion years of Earth's history were stretched along a 4.54-meter string, where would the first animals, the last non-bird dinosaurs and the first modern humans sit, and what does the spacing reveal that a textbook chart hides?
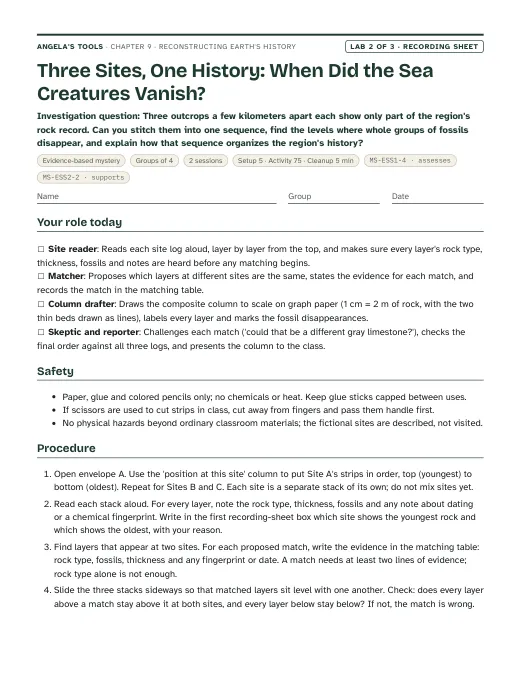
Three outcrops a few kilometers apart each show only part of the region's rock record. Can you stitch them into one sequence, find the levels where whole groups of fossils disappear, and explain how that sequence organizes the region's history?
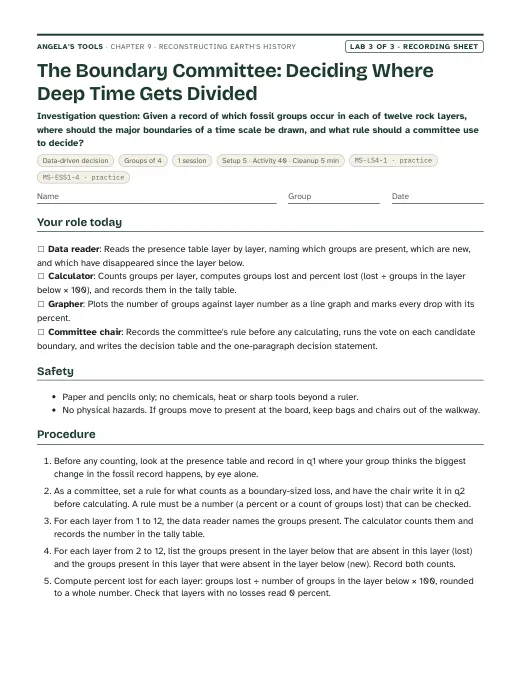
Given a record of which fossil groups occur in each of twelve rock layers, where should the major boundaries of a time scale be drawn, and what rule should a committee use to decide?
Materials overview: No chemicals, no heat. Lab 1 needs string or cord (4.6 meters per group), a tape measure or meter sticks, clothespins or binder clips, index cards and calculators. Lab 2 needs printed site-log cards (one set per group), colored pencils, rulers and graph paper. Lab 3 needs the printed fossil-presence table, graph paper and calculators. A real sample of fossil-bearing limestone or a photo of a crinoid slab makes a strong opener but is not required.
Review status: reviewed · 2026-10-19 · Re-solved every numeric and multiple-choice item in W1-W10 and Labs 1-3 (about 60 items); keys agree except as fixed below. W5 teacher note: Cenozoic zoom-strip position of the first primates was reversed; now 16.7 cm from the left end (83.3 cm from today). W9 q4 key: oxygen-buildup event at 2,400 Ma sits about 14.1 m from the entrance, not 13.9 m. W9 Layout 3 could not fit the 30.0 m wall as written (4,474 Myr at 0.661 cm/Myr plus 66 Myr at ten times that is 33.9 m); reworded with a reduced main scale of about 0.58 cm/Myr and updated the q6 key positions (humans about 1.8 cm, ice-age cycles about 15 cm). W10 scoring note double-counted q13; Part A is 15 points and Part B 6 points, 21 total. W6 cliff layers summed to 123.7 m, not the stated 124 m; layer 12 thickness set to 10.3 m. W3 passage trimmed from 717 to 700 words to meet the 450-700 word contract; no cited sentence changed. Slide 18 notes: microbe stretch on the Lab 1 string corrected to about 3 m before the roughly half-meter animal stretch (was 3.5 m and centimeter-scale). Slide 17 and W1: living Shark Bay stromatolites are in the same state as, not at the site of, the Pilbara fossils; Earth has about 200 confirmed impact craters, not a few hundred. Phenomenon (chapter and slide 2): oldest moon rocks given as 4.4 to 4.5 Ga and meteorites as about 4.57 Ga, consistent with W1, W8 and USGS. Chapter MS-ESS1-4 note no longer credits W6 with a three-site composite column (that is Lab 2); Lab 1 evidence-of-learning threshold aligned to the lab's 18 of 20. caGrade added to every lab standard (MS-ESS1-4 and MS-LS4-1 as 8, MS-ESS2-2 as 7). W2 interglacial definition reworded further from the textbook's. Originality: 6-word overlap scan against ch09.txt found only generic phrases, section titles and standards wording; no textbook sentences or definitions reproduced. Slide limits, diagram specs, standards codes and assessment boundaries verified; no item requires recall of period or epoch names. Labs have not been physically tested; see each lab's modelLimitations.
Verified against the student edition of Bring Science Alive! 7th Grade Integrated (Student Edition). Printed page numbers appear in the book; PDF pages are the physical pages of the 524-page scan (printed + 36). The textbook is not reproduced on this site.
| Section | Printed pages | PDF pages | Used for |
|---|---|---|---|
| Introduction: crinoid fossils and the lesson question | 104, 105 | 140, 141 | Essential question, the crinoid-slab image used in W1, vocabulary list, the publisher's standards box. |
| 1. Organizing Geologic Time: comparing rock sequences and the time scale | 106, 107 | 142, 143 | Lateral continuity and composite sequences (Lab 2), time-scale units and Ga/Ma/ka (slides 8-9), the not-to-scale point (misconception slide, Lab 1). |
| 2. The Origins of Earth and the Moon | 108, 109 | 144, 145 | Meteorite dating, nebular hypothesis, core formation, giant impact hypothesis (slides 12-14, W3). |
| 3. The Origins of the Atmosphere, Oceans, and Life | 110, 111 | 146, 147 | Early atmosphere, stromatolites, banded iron formations, Cambrian explosion and Burgess Shale (slides 15-18, W4). |
| 4. Pangaea and the Age of the Dinosaurs | 112, 113 | 148, 149 | Pangaea assembly and breakup, the end-Permian, end-Triassic and end-Cretaceous extinctions (slides 19-20, Lab 3, W6). |
| 5. Moving Continents and the Rise of Mammals | 114, 115 | 150, 151 | Mammal diversification, India-Eurasia collision, East African Rift, Antarctic ice (slide 23, W9). |
| Key Science Concept: Organizing Time on the Geologic Scale | 116, 117 | 152, 153 | Nesting of eons, eras, periods and epochs; the five mass-extinction dates used in Lab 1 (updated to the current chart). |
| 6. The Current Ice Age and Lesson Summary | 118, 119 | 154, 155 | Ice age, glacial and interglacial periods, Great Lakes, human ancestors (slide 24, connection slide, W10). |