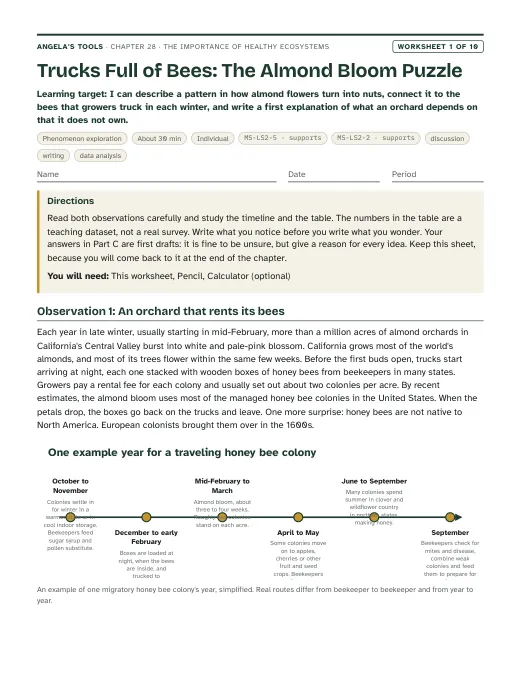
Trucks Full of Bees: The Almond Bloom Puzzle
I can describe a pattern in how almond flowers turn into nuts, connect it to the bees that growers truck in each winter, and write a first explanation of what an orchard depends on that it does not own.
Chapter 28 · Unit 10: Humans and Changing Ecosystems · Segment 4
What do healthy ecosystems do for people, and how should a community decide whether to protect an ecosystem or pay to replace the services it provides?
Students figure out that the clean water, fertile soil, crops and flood protection a community counts on come from the everyday work of living things: pollinators carrying pollen, decomposers rebuilding soil, forest soils filtering rain, dune plants holding sand, scavengers clearing carcasses, and wild populations storing a variety of traits. They model almond pollination with cotton swabs to see why California orchards rent honey bees, trace how a cattle drug that killed India's vultures spread to human health, build and improve a water filter and compare it with a forested watershed, and then sit as a town council deciding whether to protect an ecosystem or pay to replace what it does. The chapter turns Lesson 27's biodiversity ideas into decisions and sets up Lesson 29's engineering solutions.
Estimated class time: presentation about 137 minutes · worksheets about 435 minutes in total · labs 5 sessions. Eight 50- to 55-minute periods (nine with the optional W8 jigsaw): one for the phenomenon and the idea of ecosystem services; one for the pollination lab; one for pollination and almonds; one for bananas, vultures and coastlines; two for the New York City case and the filter design challenge; and two for the council decision lab, the closing task, synthesis and assessment.
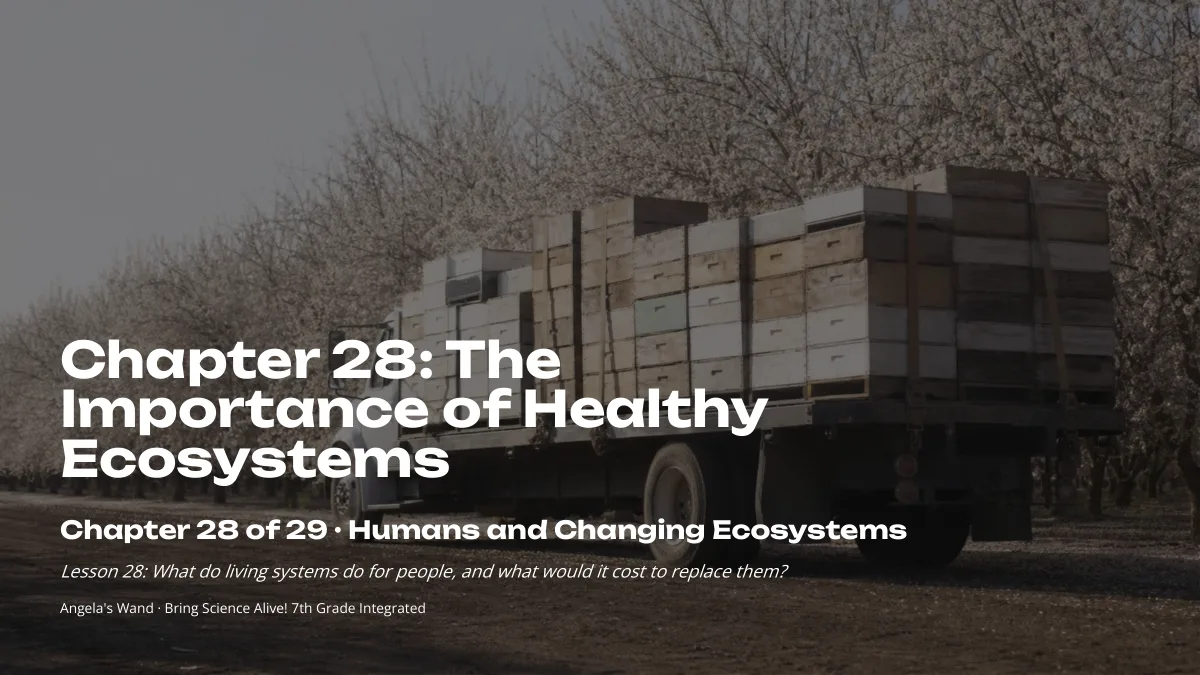
Every winter, flatbed trucks stacked with beehives roll into California's Central Valley from states as far away as Florida, Texas and North Dakota. When the almond trees bloom, usually starting in mid-February, growers rent millions of honey bee colonies; one 2025 estimate put the 2024 demand at about 2.7 million colonies, close to every managed colony counted in the United States that January. Growers pay rent for every hive, and a few weeks later the trucks drive away again. Honey bees are not even native to North America. Why would farmers pay to haul in tens of billions of insects, and what did the land do for free before orchards covered it?
Notice and wonder prompts
California NGSS, Grade 7 Preferred Integrated Course Model. Each entry says whether this chapter's work assesses the performance expectation, gives practice toward it, or supports it as background; the resource lists below repeat this for every worksheet and lab.
Evaluate competing design solutions for maintaining biodiversity and ecosystem services.
In Lab 3 students compare protect-or-replace options for three ecosystem services in a fictional town, calculate 30-year costs, weigh effects on biodiversity and on stakeholders, and defend a recommendation, which is direct evidence toward this PE; the slide 25 task does the same for an orchard. Lab 1 (pollination solutions) and Lab 2 (filter versus watershed) give practice with the same reasoning.
Define the criteria and constraints of a design problem with sufficient precision to ensure a successful solution, taking into account relevant scientific principles and potential impacts on people and the natural environment that may limit possible solutions.
The lesson's New York City case shows how precise criteria and constraints shaped a water-supply solution. Students sort criteria from constraints (slide 24), work to stated criteria in Lab 2, and choose criterion weights in Lab 3. The criteria are mostly supplied, so this is practice.
Evaluate competing design solutions using a systematic process to determine how well they meet the criteria and constraints of the problem.
Lab 3 requires students to score seven competing options on weighted criteria and a budget and to use the totals in their recommendation; Lab 2 compares filter designs on a criteria table as practice.
Analyze data from tests to determine similarities and differences among several design solutions to identify the best characteristics of each that can be combined into a new solution to better meet the criteria for success.
In Lab 2 every team posts its filter design and test results, then uses the class table to identify features that gave the clearest and fastest water and combines them in a second round. Only one redesign cycle is run, so the chapter treats this as practice.
Apply scientific principles to design a method for monitoring and minimizing a human impact on the environment.
MS-ESS3-3 is a Grade 6 performance expectation in the California integrated sequence, so here it is background, not assessed. Lab 2 q11 and the Lab 3 monitoring question ask students to propose how a town could monitor and reduce mud from construction or loss of a watershed, revisiting the Grade 6 idea.
The Importance of Healthy Ecosystems: what nature does for us, and what it would cost to replace. Original, editable slides with speaker notes: a phenomenon opener, learning targets, the chapter's concepts with diagrams, vocabulary in context, 4 checks for understanding, 2 discussion prompts, an application task, a misconception check, a synthesis and an exit ticket.

Ten different tasks, one per instructional blueprint. Each has a student PDF (low ink, US Letter), an editable DOCX, an HTML preview, and a separate teacher answer key with reasoning.
I can describe a pattern in how almond flowers turn into nuts, connect it to the bees that growers truck in each winter, and write a first explanation of what an orchard depends on that it does not own.
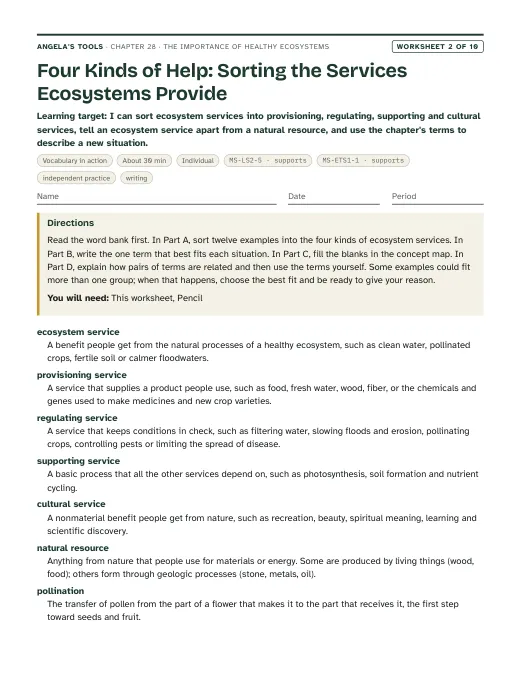
I can sort ecosystem services into provisioning, regulating, supporting and cultural services, tell an ecosystem service apart from a natural resource, and use the chapter's terms to describe a new situation.
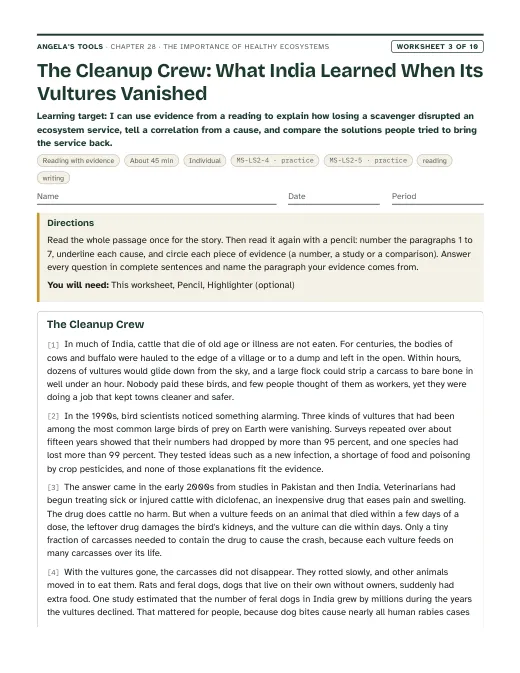
I can use evidence from a reading to explain how losing a scavenger disrupted an ecosystem service, tell a correlation from a cause, and compare the solutions people tried to bring the service back.
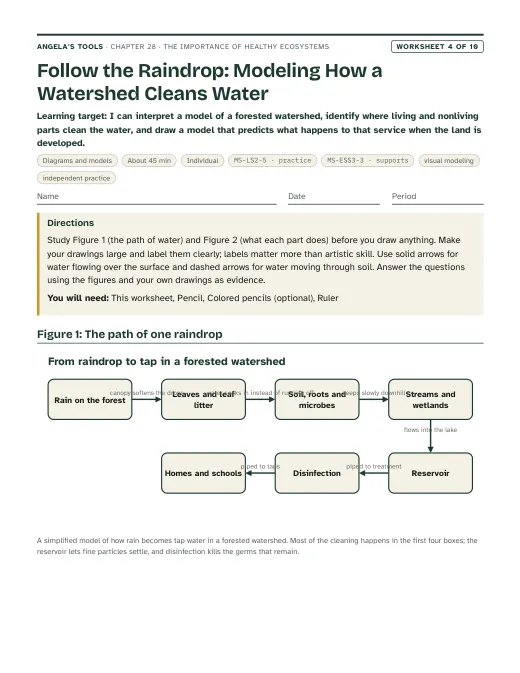
I can interpret a model of a forested watershed, identify where living and nonliving parts clean the water, and draw a model that predicts what happens to that service when the land is developed.
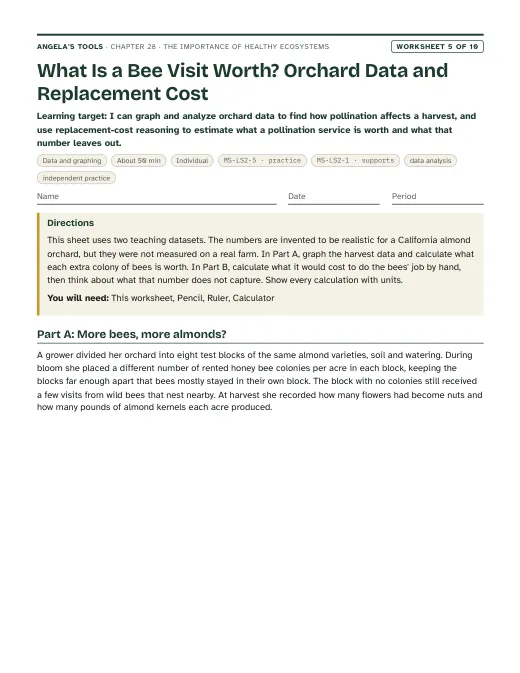
I can graph and analyze orchard data to find how pollination affects a harvest, and use replacement-cost reasoning to estimate what a pollination service is worth and what that number leaves out.
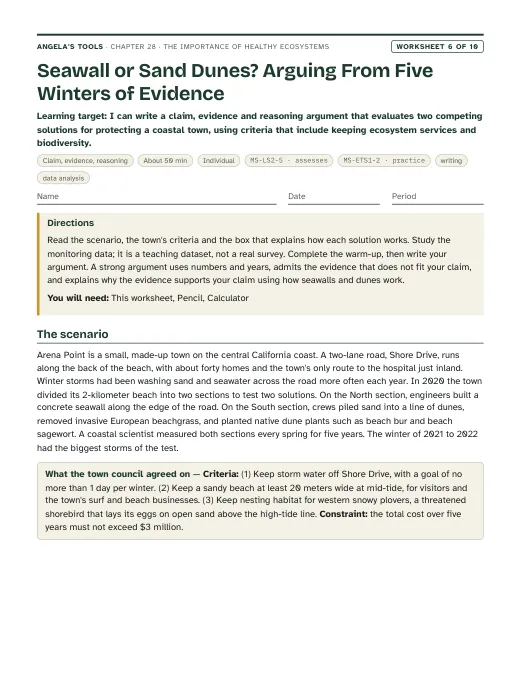
I can write a claim, evidence and reasoning argument that evaluates two competing solutions for protecting a coastal town, using criteria that include keeping ecosystem services and biodiversity.
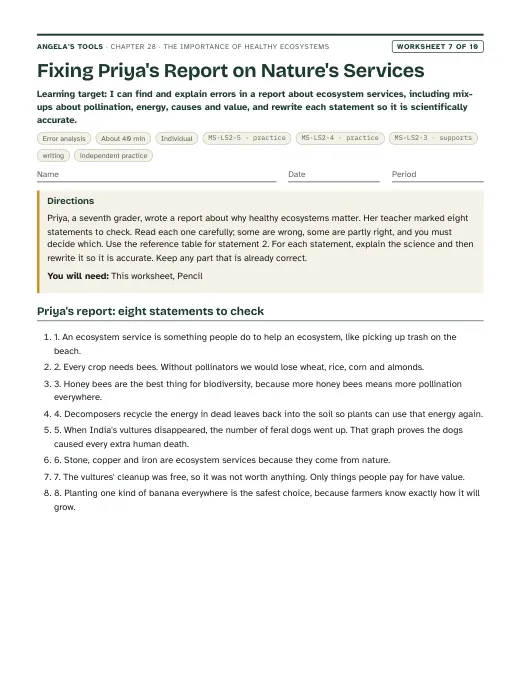
I can find and explain errors in a report about ecosystem services, including mix-ups about pollination, energy, causes and value, and rewrite each statement so it is scientifically accurate.
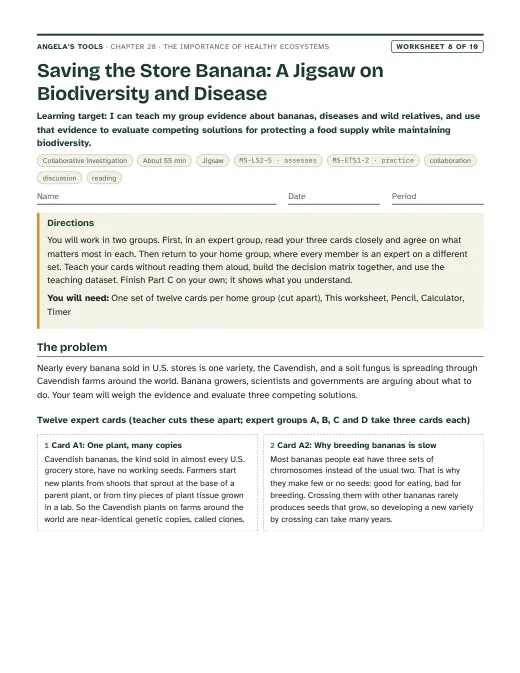
I can teach my group evidence about bananas, diseases and wild relatives, and use that evidence to evaluate competing solutions for protecting a food supply while maintaining biodiversity.
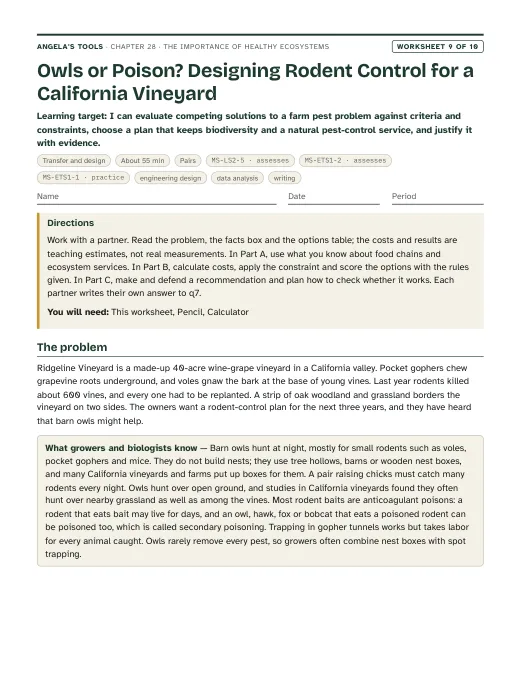
I can evaluate competing solutions to a farm pest problem against criteria and constraints, choose a plan that keeps biodiversity and a natural pest-control service, and justify it with evidence.
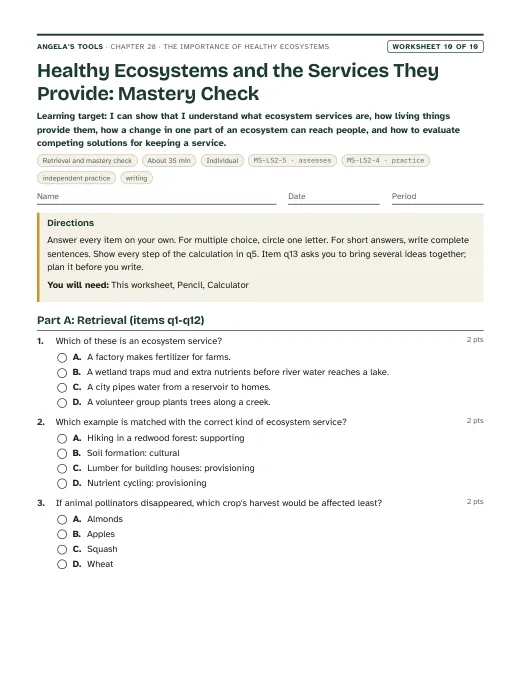
I can show that I understand what ecosystem services are, how living things provide them, how a change in one part of an ecosystem can reach people, and how to evaluate competing solutions for keeping a service.
Three different investigation approaches. Each has a teacher guide (purpose, materials with quantities, estimated cost, prep, safety, procedure, expected observations, debrief, answer key, assessment criteria, accessibility adaptations, low-cost alternative) and a student recording sheet.
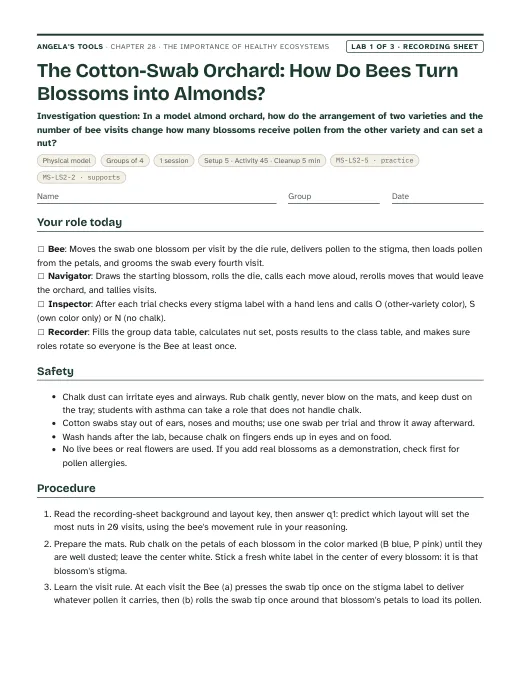
In a model almond orchard, how do the arrangement of two varieties and the number of bee visits change how many blossoms receive pollen from the other variety and can set a nut?
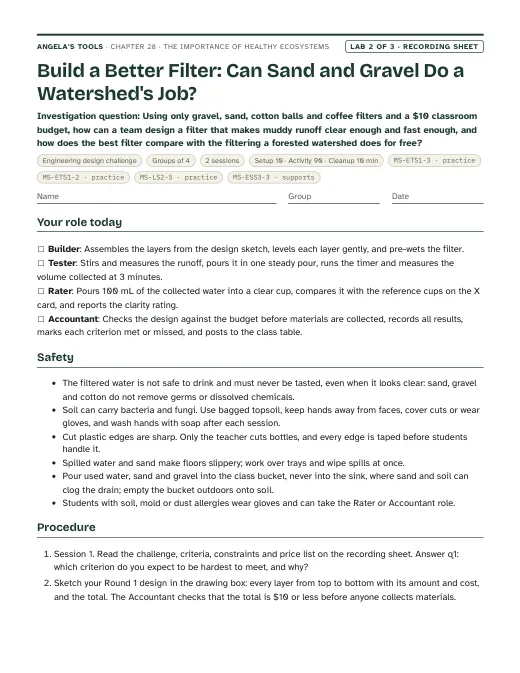
Using only gravel, sand, cotton balls and coffee filters and a $10 classroom budget, how can a team design a filter that makes muddy runoff clear enough and fast enough, and how does the best filter compare with the filtering a forested watershed does for free?
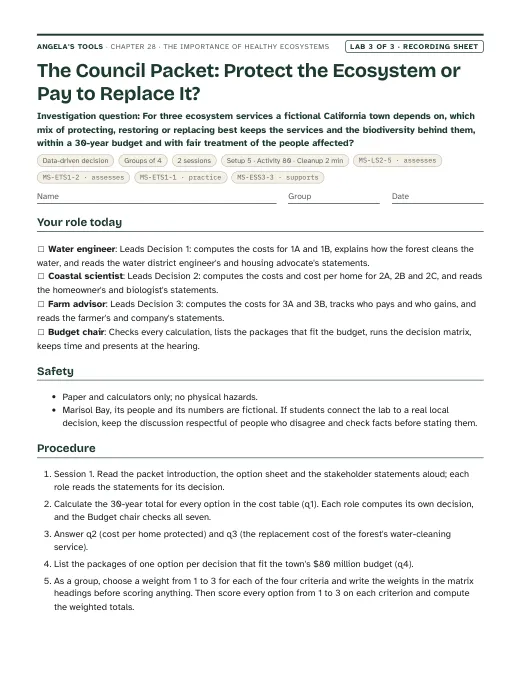
For three ecosystem services a fictional California town depends on, which mix of protecting, restoring or replacing best keeps the services and the biodiversity behind them, within a 30-year budget and with fair treatment of the people affected?
Materials overview: Lab 1 uses printed orchard mats, blue and pink sidewalk chalk, cotton swabs, small round white labels as stigmas, a die and numbered slips per group. Lab 2 uses recycled 2-liter bottles cut by the teacher, play sand, pea gravel, cotton balls, coffee filters, bagged topsoil and dry leaves for simulated runoff, identical clear cups for teacher-made reference cups, measuring cups, timers and trays. Lab 3 is paper only: the council packet and a calculator. No flames, no heating, and no chemicals beyond soil and chalk; the filtered water in Lab 2 is never to be tasted.
Review status: reviewed · 2026-10-19 · Re-solved every numeric, multiple-choice, true/false, fill and table item in W1-W10, the three labs, the slide 25 task and the exit ticket (W1 1.3%/32.0%; W5 500%, net +$400/+$50/-$150, $5,650, 14.1x, 184 workers, extension 3.1 years; W6 -57%/+3%, 6 vs 4 flood days; W8 94%/16%/64%; W9 totals $22,500/$42,000/$27,000/$31,200/$54,000, matrix 18/22/24/14 and both extension weightings; W10 $120M/$30M/$90M; Lab 1 300 colonies, $60,000, $75,000; Lab 2 87.5%/93.75%, $18/L, $180M; Lab 3 135/36/40/25.5/54/9/3.9, per-home $114,286/$72,857/$154,286, all six budget packages and the sample matrix 17/22/19/22/11/16/22). All keys were correct. Lab 1 expected percentages checked by simulating the stated die, deliver-then-load and grooming rules (20,000 runs per condition): with moderate chalk carryover, blocks about 16 percent, alternating rows about 35 percent, mixed rows about 47 percent and alternating with 10 visits about 19 percent, matching the expected observations; about one move in three is vertical, as the q6 key says. Verified against sources: farmdoc daily (Feb 2025) for about 2.7 million colonies in 2024, 99 percent of U.S. colonies on January 1, 2024, two colonies per acre (one for self-fertile), over $200 per colony, mid-February bloom of 3-4 weeks; CalAg January 2026 report for 1.40 million bearing acres in 2025 and over 80 percent of world almonds; NRC (2000) for the city's up-to-$6 billion and over-$300-million-a-year filtration estimates, the EPA-appointed panel's as-little-as-half dispute and about $1.5 billion over ten years for the 1997 agreement; Klein et al. (2012) abstract for wild bees only near semi-natural habitat or vegetation strips, with strip benefits at orchard edges; the Millennium Ecosystem Assessment's placement of pollination and disease regulation as regulating services. Slide 5: the concept map put pollination under 'Keeps the system running' while the notes said the grouping was the 2005 assessment's, which lists pollination as regulating and conflicts with W2; pollination moved to 'Regulates and protects', photosynthesis added to the supporting group, caption and notes now name the Millennium Ecosystem Assessment and accept other placements with reasons. Added an accuracy note on the four categories. Klein et al. 2012 describes strips of semi-natural vegetation, not planted strips: wording corrected in the Lab 1 information card, slide 12 bullet and notes, and the accuracy note. New York City cost framing: Lab 2 debrief and Lab 3 q10 key quoted the city's $6 billion estimate without the EPA-appointed panel's dispute; both now say the panel argued filtration could cost as little as half. Lab 3: the budget rule said costs paid by homeowners do not count, which could let students exclude 1A and 1B (paid by water customers); the packet now states that water-customer costs count toward the budget, and the q1 key names water customers for 1B. The debrief and expected observations no longer call 1B 'usually near-unanimous' when the budget forces it. Smaller accuracy fixes: slide 16 caption no longer says every link was tested (experiments confirmed the drug-to-vulture links; the dog and human links rest on counts and district comparisons); slide 15 says Cavendish grows from shoots of parent plants, not cuttings; scavenger example and slide 16 notes now agree with W3 that a large flock strips a carcass in under an hour; W1 timeline moves colony splitting to spring and gives September to mite checks, combining and winter feeding. Links and references: every W1-W10 and Lab reference in chapter.json, the slide links and the worksheet and lab teacher notes was checked against the files (W3 vultures, W4 watershed, W5 orchard data, W6 seawall versus dunes, W8 banana jigsaw, W9 vineyard rodent control). Fixed slide 3 (W8 belongs to target 5, not target 1), evidenceOfLearning item 6 (now cites slide 8, W2 q9 and W7 for geological resources, since W10 does not test that), the sequence note that W9 is a pairs task, and the Lab 2 teacher note that pointed the filter class table to W9. Originality: no 6-word run shared with the lesson text outside titles and citations. Standards: every code exists with matching caGrade; MS-ESS3-3 is labeled Grade 6 and supports-only everywhere. Text limits, diagram fields, W3 passage length (684 words) and pacing total (137 minutes) all pass. Labs remain untested in a classroom, as each modelLimitations says.
Verified against the student edition of Bring Science Alive! 7th Grade Integrated (Student Edition). Printed page numbers appear in the book; PDF pages are the physical pages of the 524-page scan (printed + 36). The textbook is not reproduced on this site.
| Section | Printed pages | PDF pages | Used for |
|---|---|---|---|
| Introduction: clean water and the lesson question | 374, 375 | 410, 411 | Lesson question, vocabulary list (ecosystem service, disease resistance, scavenger), the standards the publisher lists, and the water-cleaning idea behind Lab 2. |
| 1. Healthy Ecosystems Provide Services | 376, 377 | 412, 413 | Definition of ecosystem service and natural resource, the meadow's soil and nutrient cycling, pollination (slides 4, 6, 7, 9-11; Lab 1). Grain, mineral and energy wording corrected in accuracy notes. |
| Key Science Concept: Humans Rely on Ecosystem Services | 378 | 414 | The range of services on the wheel, regrouped in the slide 5 concept map and the slide 8 check. |
| 2. Ecosystem Change Impacts Human Food Supplies: Bananas | 379 | 415 | Biodiversity and disease resistance in crops (slide 15), with the disease names corrected. |
| 3. Ecosystem Change Impacts Human Health: Vultures and Rabies | 380, 381 | 416, 417 | Scavengers, the diclofenac chain and the two-trend graph (slides 16-18), extended with the district-comparison research. |
| 4. Ecosystem Change Impacts Human Environments: Flooding | 382, 383 | 418, 419 | Dunes, marshes and beach grasses as flood buffers, restoration (slides 19-21; Lab 3 Decision 2). |
| 5. Clean Drinking Water for New York City (Engineering Design) | 384, 385 | 420, 421 | Criteria and constraints, the watershed-protection solution (slides 22-24; Lab 2 comparison; Lab 3 Decision 1). |
| Lesson Summary | 385 | 421 | Check that every summary idea is covered by a target, a slide and at least one lab. |