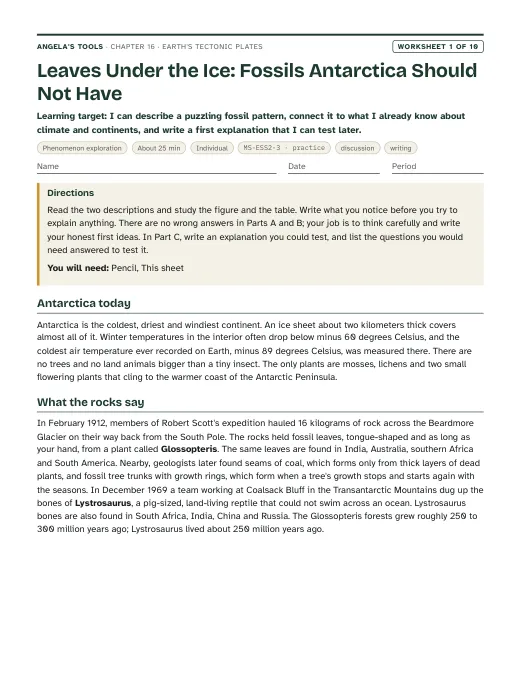
Leaves Under the Ice: Fossils Antarctica Should Not Have
I can describe a puzzling fossil pattern, connect it to what I already know about climate and continents, and write a first explanation that I can test later.
Chapter 16 · Unit 6: Processes that Shape Earth · Segment 3
What evidence convinced scientists that the continents move, and how did that evidence turn a hypothesis into the theory of plate tectonics?
Students figure out how a strange idea, that whole continents move, went from a mapmaker's hunch to one of the best-supported theories in science. They weigh the clues Alfred Wegener gathered in 1912 (matching fossils, matching rock belts, continents that fit like torn pieces) and see why scientists still set his idea aside. Then they follow the new evidence of the 1900s: earthquake waves that revealed a rigid lithosphere over a slowly flowing mantle, belts of earthquakes and volcanoes that outline giant plates, sonar maps of a world-circling ridge and deep trenches, and drill cores showing that the seafloor gets older with distance from the ridge. Students practice the heart of MS-ESS2-3: reading fossil, rock, shape and seafloor data as evidence of past plate motion, and using rates to see how centimeters a year become oceans over millions of years.
Estimated class time: presentation about 145 minutes · worksheets about 400 minutes in total · labs 3 sessions. Seven 50-minute periods: one for the phenomenon and Wegener's evidence, one for the landmass-fit mystery, one for Earth's interior, earthquake belts and the seafloor, one for the paper seafloor model, one for drill-core data and the theory, one for boundaries, the California connection and the CER, and one for synthesis and mastery.
In the Transantarctic Mountains, about 85 degrees south, field teams have dug up fossil tree trunks with growth rings, broad fossil leaves of an extinct seed plant called Glossopteris, and bones of Lystrosaurus, a pig-sized land animal that could not swim across an ocean. The rocks are about 250 million years old. Today the site is buried in ice and spends months of every year in total darkness. The very same plant and the very same animal turn up in rocks of the same age in India, more than 10,000 kilometers away, and in southern Africa. How did a forest and a land-dwelling animal get to a place where nothing grows, and how did the same species end up on three continents separated by oceans?
Notice and wonder prompts
California NGSS, Grade 7 Preferred Integrated Course Model. Each entry says whether this chapter's work assesses the performance expectation, gives practice toward it, or supports it as background; the resource lists below repeat this for every worksheet and lab.
Analyze and interpret data on the distribution of fossils and rocks, continental shapes, and seafloor structures to provide evidence of the past plate motions.
This is the lesson's performance expectation. Lab 1, Lab 3, W5, W6 and W8 ask students to read distributions of fossils and rock belts, the fit of simplified landmass shapes, and simulated seafloor age-distance data, and to argue from that data that plates have moved. Paleomagnetic stripes are mentioned only as history (teacher notes, the timeline slide and the W3 passage) and never assessed, in line with the assessment boundary.
Assessment boundary: Paleomagnetic anomalies in oceanic and continental crust are not assessed.
Construct an explanation based on evidence for how geoscience processes have changed Earth’s surface at varying time and spatial scales.
Plate motion of a few centimeters a year is the slowest, largest process on the time-and-space scale this PE describes. The rate-times-time calculations in the deck and W9 build the idea that small yearly motions open oceans over millions of years, but the full explanation of surface change at many scales belongs to Lesson 11 and Lesson 17.
Define the criteria and constraints of a design problem with sufficient precision to ensure a successful solution, taking into account relevant scientific principles and potential impacts on people and the natural environment that may limit possible solutions.
The lesson's engineering spread on the research drill ship gives students a real case for telling requirements (criteria) from limits (constraints). The presentation (for a seafloor-sampling tool) and W9 (for a drilling voyage) have students sort and write both; this practices the PE rather than fully assessing it because the design problem is given to students rather than defined from scratch.
Earth's Tectonic Plates: the evidence that moved the continents. Original, editable slides with speaker notes: a phenomenon opener, learning targets, the chapter's concepts with diagrams, vocabulary in context, 3 checks for understanding, 2 discussion prompts, an application task, a misconception check, a synthesis and an exit ticket.

Ten different tasks, one per instructional blueprint. Each has a student PDF (low ink, US Letter), an editable DOCX, an HTML preview, and a separate teacher answer key with reasoning.
I can describe a puzzling fossil pattern, connect it to what I already know about climate and continents, and write a first explanation that I can test later.
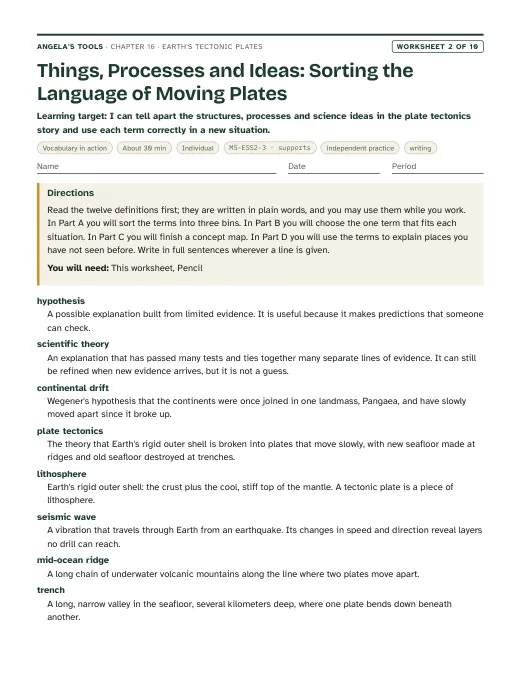
I can tell apart the structures, processes and science ideas in the plate tectonics story and use each term correctly in a new situation.
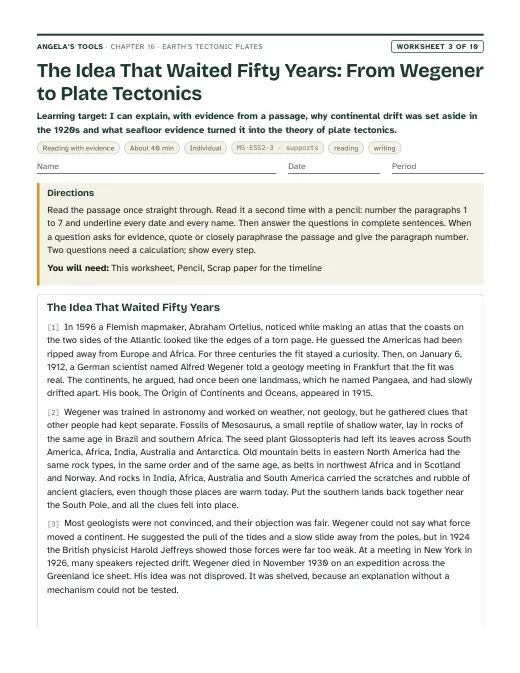
I can explain, with evidence from a passage, why continental drift was set aside in the 1920s and what seafloor evidence turned it into the theory of plate tectonics.
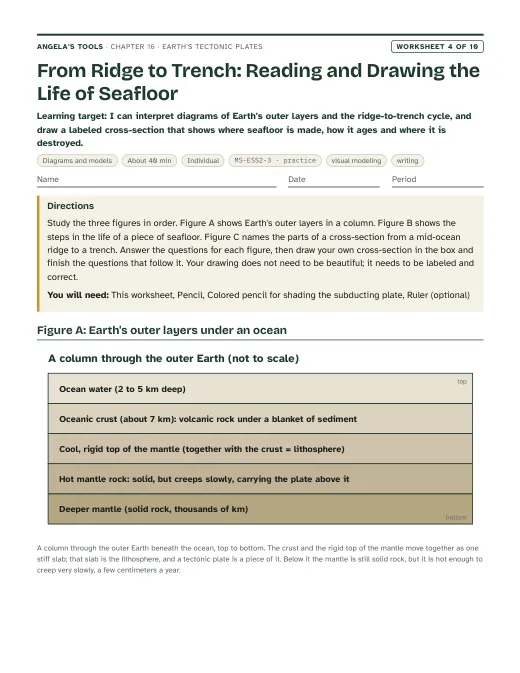
I can interpret diagrams of Earth's outer layers and the ridge-to-trench cycle, and draw a labeled cross-section that shows where seafloor is made, how it ages and where it is destroyed.
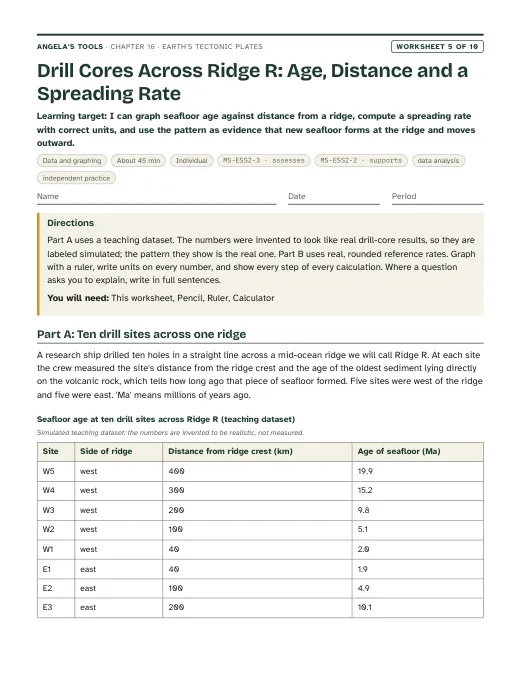
I can graph seafloor age against distance from a ridge, compute a spreading rate with correct units, and use the pattern as evidence that new seafloor forms at the ridge and moves outward.
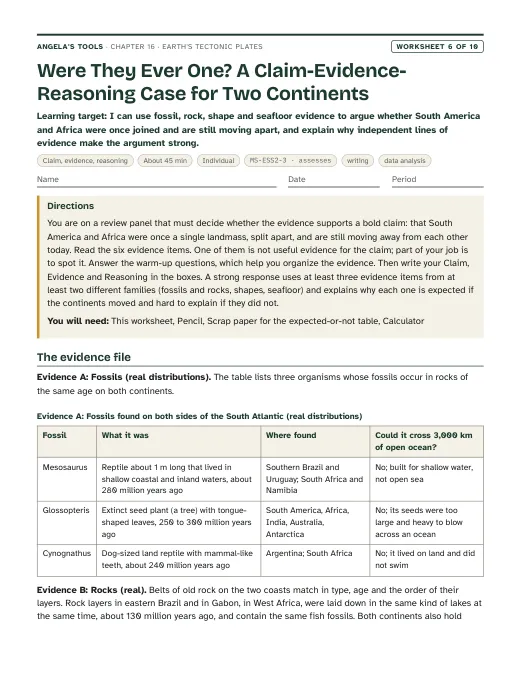
I can use fossil, rock, shape and seafloor evidence to argue whether South America and Africa were once joined and are still moving apart, and explain why independent lines of evidence make the argument strong.
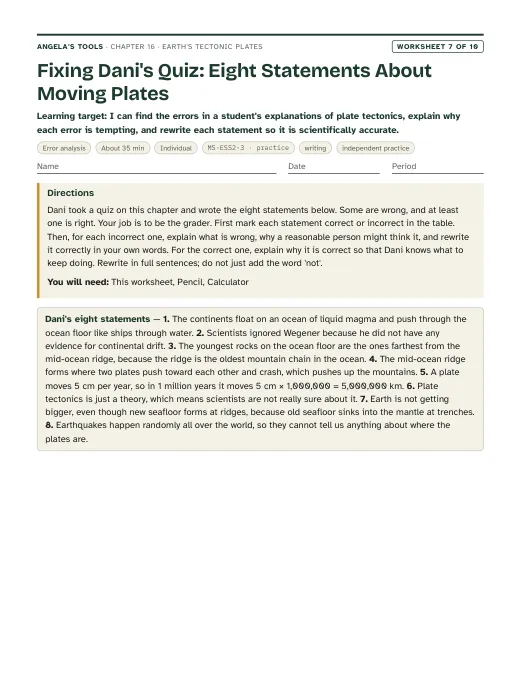
I can find the errors in a student's explanations of plate tectonics, explain why each error is tempting, and rewrite each statement so it is scientifically accurate.
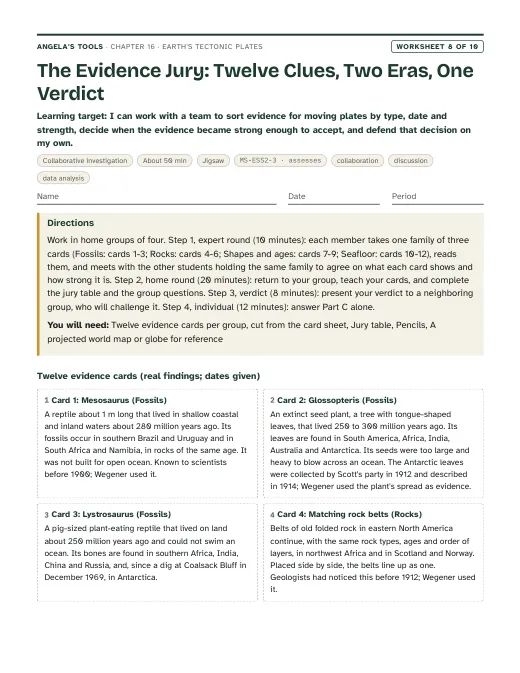
I can work with a team to sort evidence for moving plates by type, date and strength, decide when the evidence became strong enough to accept, and defend that decision on my own.
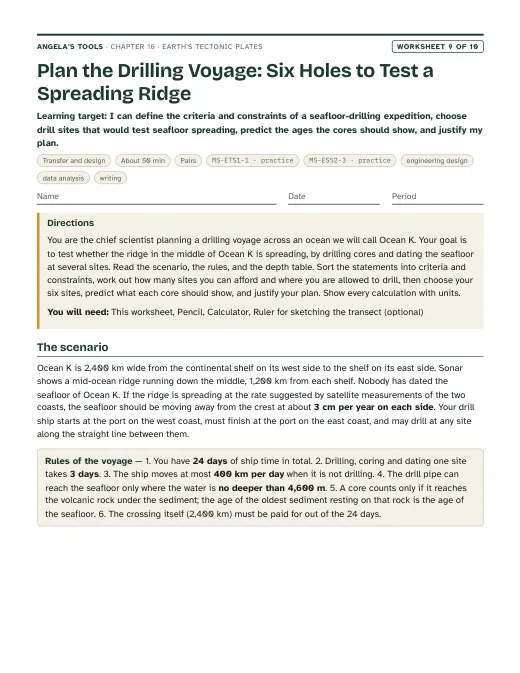
I can define the criteria and constraints of a seafloor-drilling expedition, choose drill sites that would test seafloor spreading, predict the ages the cores should show, and justify my plan.
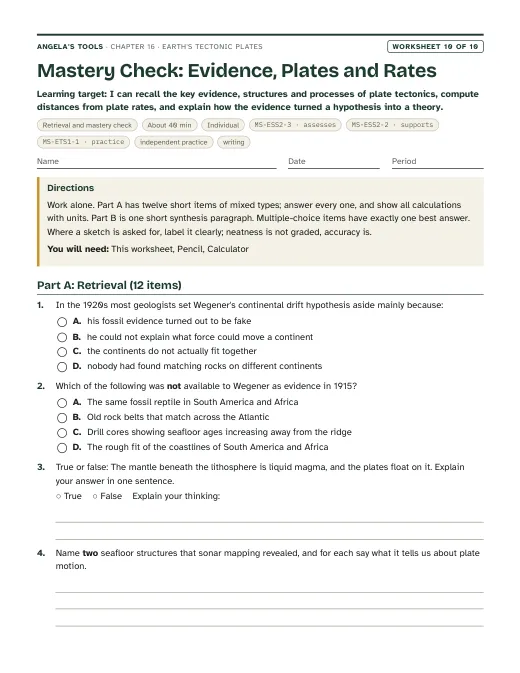
I can recall the key evidence, structures and processes of plate tectonics, compute distances from plate rates, and explain how the evidence turned a hypothesis into a theory.
Three different investigation approaches. Each has a teacher guide (purpose, materials with quantities, estimated cost, prep, safety, procedure, expected observations, debrief, answer key, assessment criteria, accessibility adaptations, low-cost alternative) and a student recording sheet.
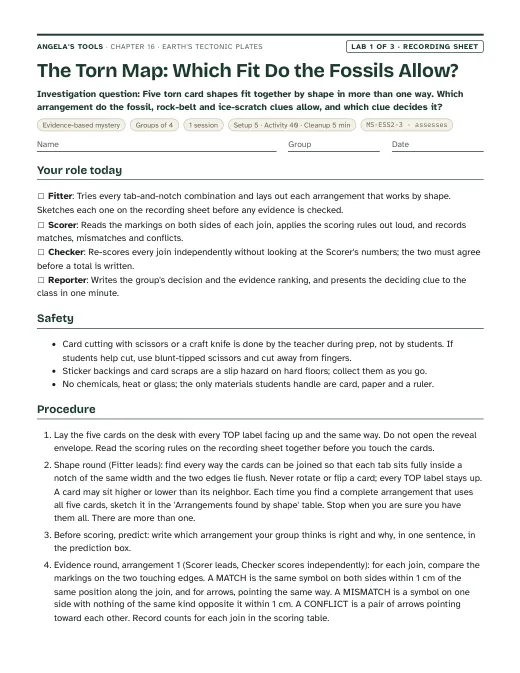
Five torn card shapes fit together by shape in more than one way. Which arrangement do the fossil, rock-belt and ice-scratch clues allow, and which clue decides it?
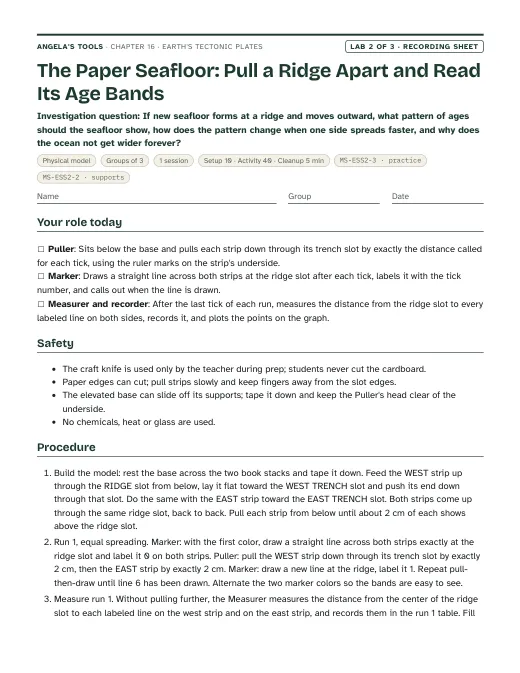
If new seafloor forms at a ridge and moves outward, what pattern of ages should the seafloor show, how does the pattern change when one side spreads faster, and why does the ocean not get wider forever?
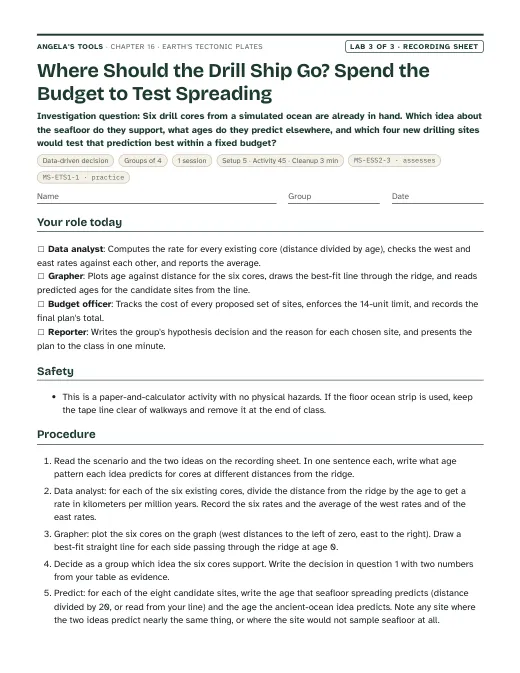
Six drill cores from a simulated ocean are already in hand. Which idea about the seafloor do they support, what ages do they predict elsewhere, and which four new drilling sites would test that prediction best within a fixed budget?
Materials overview: No chemicals, no heat, no sharp tools beyond scissors. Lab 1 uses card stock, colored dot stickers and a printed evidence key. Lab 2 uses adding-machine paper, a cardboard sheet with slots, markers and rulers. Lab 3 is paper and calculator only. A wall map or globe and a projected plate map help every period. If a 'fossil' prop is wanted for the phenomenon, a photo of Glossopteris leaves and of a Lystrosaurus skull works; no specimens are needed.
Review status: reviewed · 2026-10-19 · Both interrupted edits confirmed complete: the W3 passage is 696 words (450-700) and every slide bullet is 110 characters or fewer. Glossopteris consistency: W1 (q4 key, q7 model, extension) and W8 q7 argued that forests could not grow at a dark pole, contradicting the chapter's own correction. They now say the forests grew near the pole in a milder, ice-free climate, and that climate alone cannot explain the shared fossils or the glacial pattern. Vine-Matthews: 1963 was the proposal; the mirror-image stripes were shown in 1965-66 (Vine and Wilson; Pitman and Heirtzler). Corrected in the W3 passage, slide 16 notes, the timeline and the accuracy notes, and the paleomagnetic notes no longer claim the stripes appear only in teacher notes. Still never assessed. History: the 1926 New York symposium was not a vote (slide 9, W3). Slide 1 now says about 370 years to match the timeline. The timeline is in chronological order. The Meteor expedition bullet is limited to the South Atlantic. The San Andreas creeping section is given as San Juan Bautista to Parkfield, with Parkfield as a transition zone. Arithmetic and units, all items re-solved: estimatedMinutes 150 to 145 (sum of pacing). Slide 19 now separates the one-side and full widening. Lab 2's real one-side spreading rates now read 0.5-8 cm per year to match W5. W1 q6's comparison distance is fixed. W8 q2's total range is 16-18. W9's teacher note says a faster ship buys no extra site. Lab 1's decoy has 7 matches (not 8). Lab 1's E-to-B green dots were moved from the 1 cm tolerance edge to an exact match; scores are unchanged (11 and 1). Lab 3: shelf site S7 was 1,050 km west, inland of the 1,000 km west shore; it is now 980 km west. The model-limitations note now names the west-margin versus trench age inconsistency. W6 no longer says the 70 Ma sites are at the shelves. Contract and consistency: caGrade added to all five lab standards entries. Chapter vocabulary trimmed from 13 to 12 by removing Pangaea, which stays on vocab slide 6. W2's third bin is redefined so continental drift and plate tectonics fit it. The chapter text now describes W9 as a drilling-voyage plan. The sequence, SEP and differentiation now match slide 9 (1926), Lab 2 (one uneven run) and Lab 3 (six cores). The plate-onset range is broadened to more than 4 to less than 1 billion years ago. Originality: remaining 6-word overlaps with the lesson are section titles in sourceReferences, textbook claims quoted in accuracyNotes so they can be corrected, a proper noun, and one generic phrase. Echoing sentences in the deck, W3, W7 and W10 were reworded. Labs remain physically untested; see each lab's modelLimitations.
Verified against the student edition of Bring Science Alive! 7th Grade Integrated (Student Edition). Printed page numbers appear in the book; PDF pages are the physical pages of the 524-page scan (printed + 36). The textbook is not reproduced on this site.
| Section | Printed pages | PDF pages | Used for |
|---|---|---|---|
| Introduction: the seafloor without its oceans | 202, 203 | 238, 239 | Lesson question, the world-circling ridge, the vocabulary list and the publisher's standards box. |
| 1. Wegener's Hypothesis: Ortelius, Pangaea and the fossil, rock and mountain evidence | 204, 205 | 240, 241 | Wegener's four lines of evidence, Lab 1 evidence overlays, slides 4-9, the 'no mechanism' problem. |
| 2. Discovering Earth's Interior: seismic waves and the lithosphere | 206 | 242 | The layers diagram, the solid-but-flowing mantle, the plates-are-lithosphere idea. |
| 3. Observing Patterns of Volcanoes and Earthquakes | 207 | 243 | Earthquake and volcano belts as plate outlines, the Ring of Fire, slide 11-12 check. |
| 4. Discovering Features of the Seafloor: sonar, structures and seafloor spreading | 208, 209 | 244, 245 | The four seafloor structures, the age-pattern prediction, Lab 2 and Lab 3, the recycling of seafloor at trenches. |
| 5. Designing a Drill Ship: criteria, constraints and testing for seafloor spreading | 210, 211 | 246, 247 | The criteria versus constraints compare diagram, the Glomar Challenger core evidence, Lab 3's drilling-program scenario, W9. |
| Key Science Concept: Evidence for Moving Continents | 212, 213 | 248, 249 | The three evidence families (land, earthquakes and volcanoes, seafloor) used to organize the synthesis slide, W6 and W8. |
| 6. The Theory of Plate Tectonics: from hypothesis to theory, the plates, mantle convection | 214, 215 | 250, 251 | Hypothesis versus theory, the plate map, the seafloor life-cycle flow diagram (mechanism in notes only). |
| 7. Tracking Plate Motion: convergent, divergent and transform boundaries; rate times time | 216, 217 | 252, 253 | Boundary table, plate speeds, the rate-times-time check, the San Andreas connection, lesson summary. |