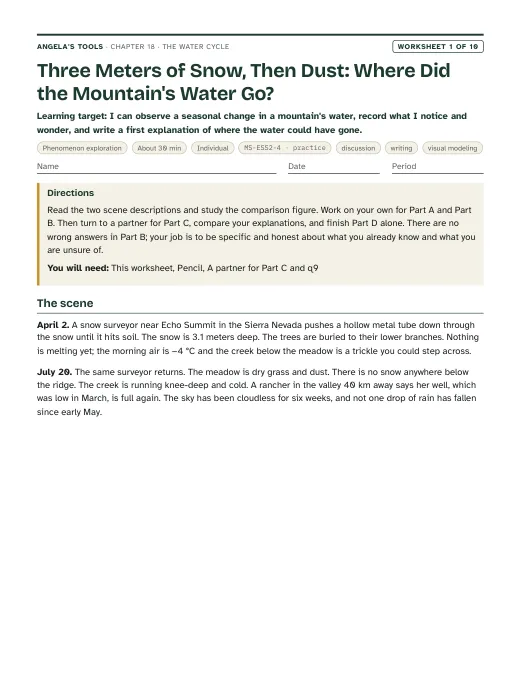
Three Meters of Snow, Then Dust: Where Did the Mountain's Water Go?
I can observe a seasonal change in a mountain's water, record what I notice and wonder, and write a first explanation of where the water could have gone.
Chapter 18 · Unit 6: Processes that Shape Earth · Segment 3
What moves Earth's water from place to place, what makes it change between solid, liquid and gas, and why can the same water end up in so many different places?
Students figure out that Earth's water is never used up and never created: the same water moves between the ocean, the air, the land, the ground and living things, changing state as it goes. They work out which moves need water to gain energy from the Sun (evaporation, transpiration, melting, sublimation), which happen when water gives energy off as it cools (condensation, freezing, deposition), and which are powered by gravity (precipitation, runoff, infiltration, groundwater flow). They build and test a solar distiller, measure evaporation and transpiration in the schoolyard, and run a dice-driven model of water's many routes. The chapter closes the loop on Lesson 17's rock cycle: the Sun, not Earth's interior, does most of the work here, and it sets up Lesson 19's question of why water, including groundwater, is spread so unevenly.
Estimated class time: presentation about 127 minutes · worksheets about 415 minutes in total · labs 6 sessions. Seven class periods of about 50 minutes: two for the presentation and the first worksheets, three lab days (Lab 2 spans two short sessions on consecutive days and Lab 1 spans three short sessions), and two for synthesis, transfer and assessment. Lab 1 needs sunny windows or warm lamps, so check the weather and the room before scheduling. The sequence is tight: not every worksheet fits in class time, so assign W2, W3 or W5 as homework and choose W8 or W9 (or add an eighth period) as time allows.
In early April the Sierra Nevada is buried under a snowpack that can be several meters deep. By late August the same slopes are bare granite and dry grass, and almost none of that snow is left. Yet in August, hundreds of kilometers away, canals in the Central Valley still carry water to farms, and wells in valley towns still pump water from hundreds of meters underground. The snow did not vanish. Something moved it, in stages, from the mountain tops to the valley floor, to the air, to the sea and to deep below the ground.
Notice and wonder prompts
California NGSS, Grade 7 Preferred Integrated Course Model. Each entry says whether this chapter's work assesses the performance expectation, gives practice toward it, or supports it as background; the resource lists below repeat this for every worksheet and lab.
Develop a model to describe the cycling of water through Earth’s systems driven by energy from the sun and the force of gravity.
This is a California Grade 6 performance expectation in the Preferred Integrated model, so seventh graders are revisiting it; the textbook places it here. Students develop conceptual models (W4, the W10 synthesis, Lab 3) and work with a physical model and field evidence (Lab 1, Lab 2) of water changing state and moving through Earth's systems, and explain which moves the Sun powers and which gravity powers. Quantitative latent heat is not assessed.
Assessment boundary: A quantitative understanding of the latent heats of vaporization and fusion is not assessed.
Develop a model to generate data for iterative testing and modification of a proposed object, tool, or process such that an optimal design can be achieved.
In Lab 1 students build a working solar distiller, measure its output, change one feature, retest and record the result over two rounds; the design log and output data are evidence for this PE. Elsewhere in the chapter the PE is practiced, not assessed.
Analyze data from tests to determine similarities and differences among several design solutions to identify the best characteristics of each that can be combined into a new solution to better meet the criteria for success.
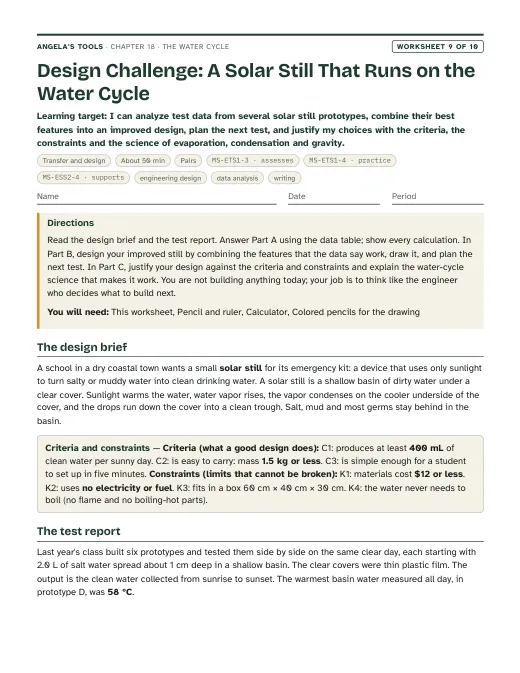
W9 assesses this PE: students analyze side-by-side test data from six solar still prototypes, identify the best characteristic of each, and combine them into a new design. The Lab 1 class results table and the slide 22 design-data task practice the same move.
Construct a scientific explanation based on evidence for how the uneven distributions of Earth’s mineral, energy, and groundwater resources are the result of past and current geoscience processes.
Aquifers, infiltration and the California connection slides give students the background they need for Lesson 19's explanation of why groundwater resources are distributed unevenly; this chapter does not assess the explanation itself.
The Water Cycle: the Sun lifts it, gravity brings it back. Original, editable slides with speaker notes: a phenomenon opener, learning targets, the chapter's concepts with diagrams, vocabulary in context, 3 checks for understanding, 2 discussion prompts, an application task, a misconception check, a synthesis and an exit ticket.

Ten different tasks, one per instructional blueprint. Each has a student PDF (low ink, US Letter), an editable DOCX, an HTML preview, and a separate teacher answer key with reasoning.
I can observe a seasonal change in a mountain's water, record what I notice and wonder, and write a first explanation of where the water could have gone.
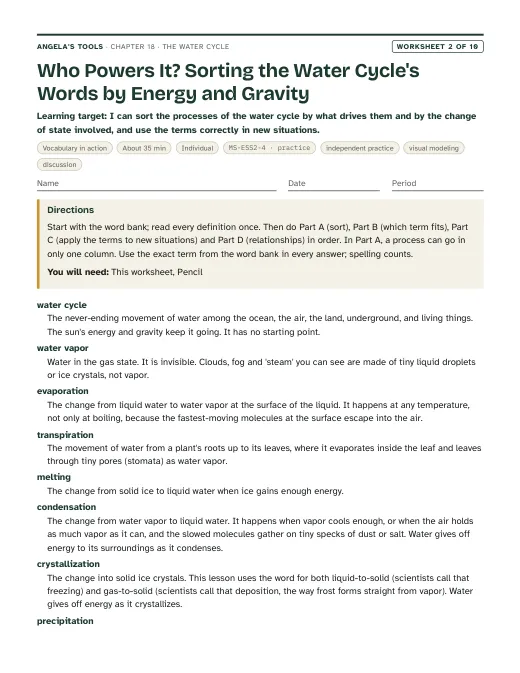
I can sort the processes of the water cycle by what drives them and by the change of state involved, and use the terms correctly in new situations.
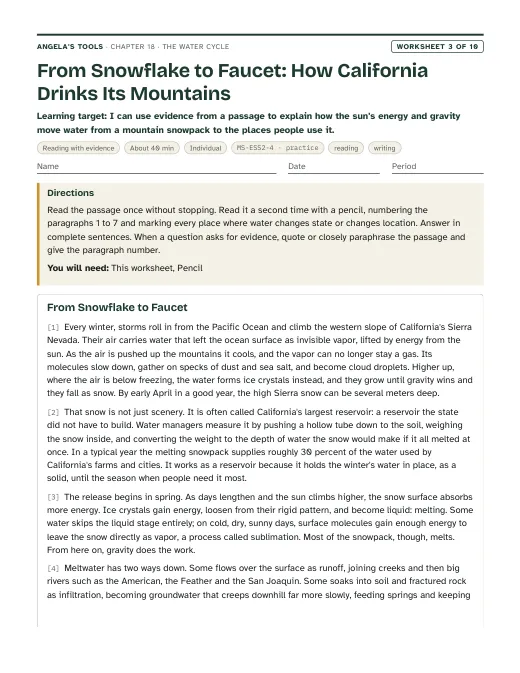
I can use evidence from a passage to explain how the sun's energy and gravity move water from a mountain snowpack to the places people use it.
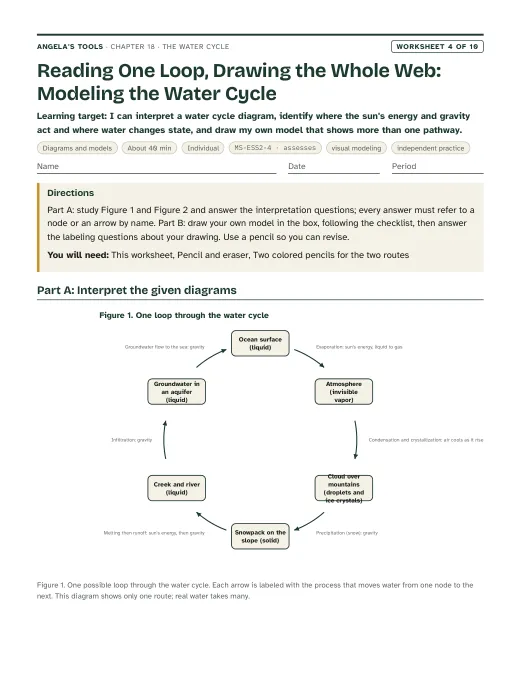
I can interpret a water cycle diagram, identify where the sun's energy and gravity act and where water changes state, and draw my own model that shows more than one pathway.
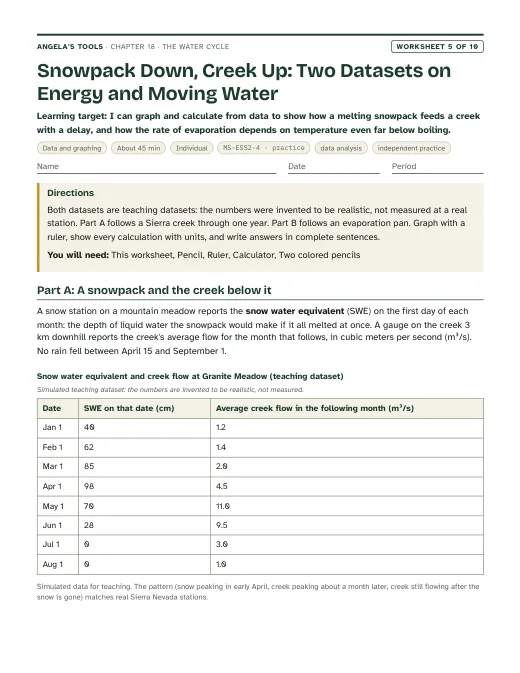
I can graph and calculate from data to show how a melting snowpack feeds a creek with a delay, and how the rate of evaporation depends on temperature even far below boiling.
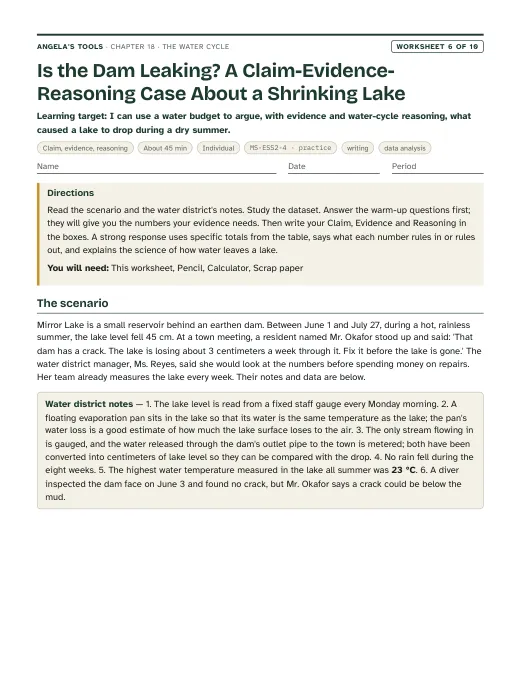
I can use a water budget to argue, with evidence and water-cycle reasoning, what caused a lake to drop during a dry summer.
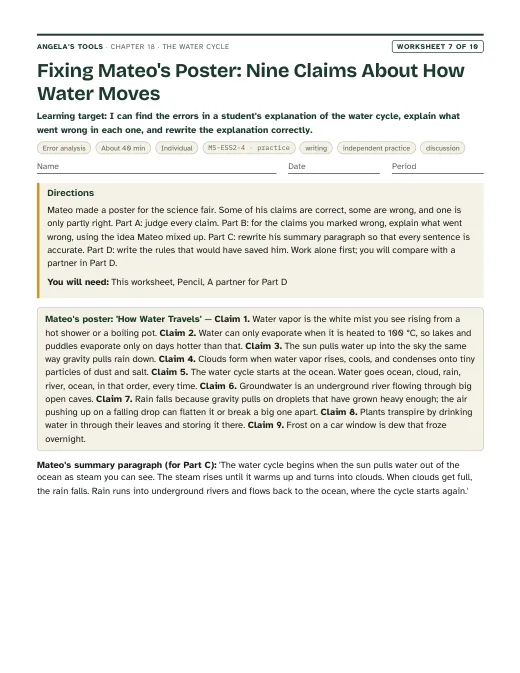
I can find the errors in a student's explanation of the water cycle, explain what went wrong in each one, and rewrite the explanation correctly.
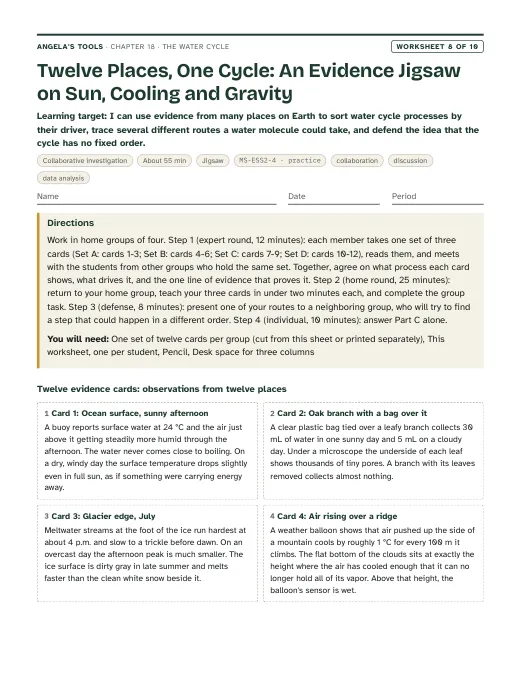
I can use evidence from many places on Earth to sort water cycle processes by their driver, trace several different routes a water molecule could take, and defend the idea that the cycle has no fixed order.
I can analyze test data from several solar still prototypes, combine their best features into an improved design, plan the next test, and justify my choices with the criteria, the constraints and the science of evaporation, condensation and gravity.
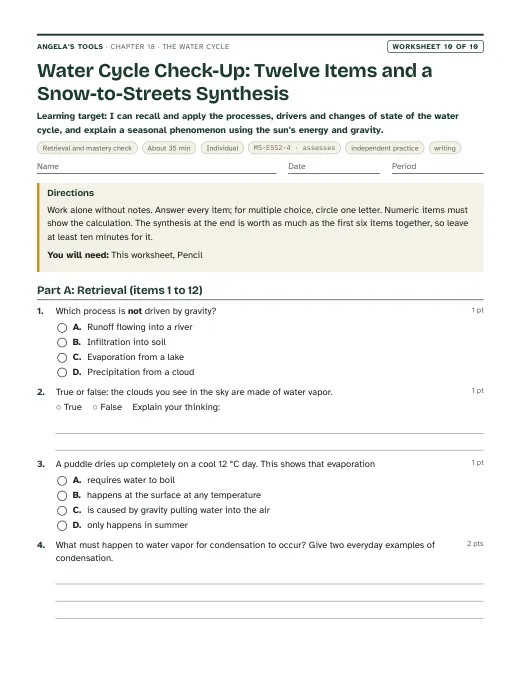
I can recall and apply the processes, drivers and changes of state of the water cycle, and explain a seasonal phenomenon using the sun's energy and gravity.
Three different investigation approaches. Each has a teacher guide (purpose, materials with quantities, estimated cost, prep, safety, procedure, expected observations, debrief, answer key, assessment criteria, accessibility adaptations, low-cost alternative) and a student recording sheet.
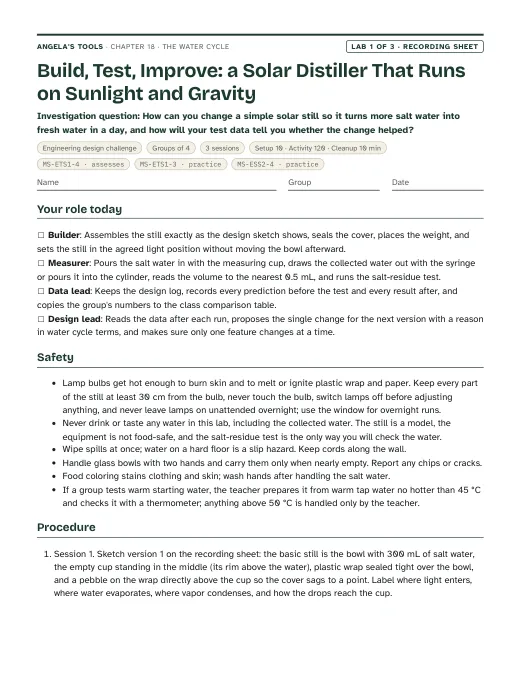
How can you change a simple solar still so it turns more salt water into fresh water in a day, and how will your test data tell you whether the change helped?
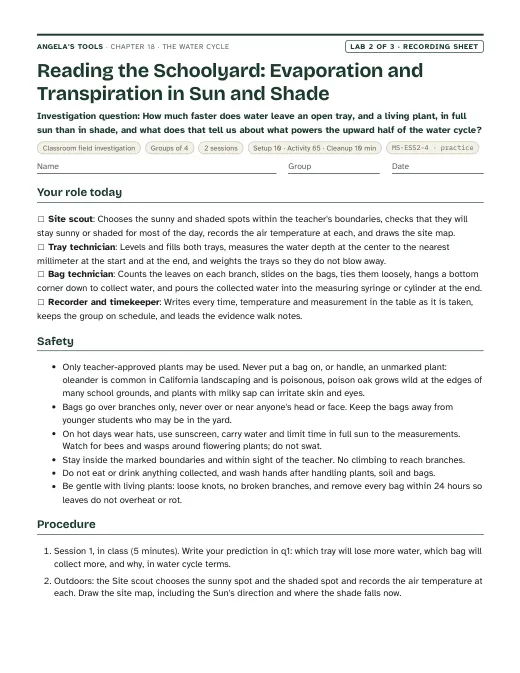
How much faster does water leave an open tray, and a living plant, in full sun than in shade, and what does that tell us about what powers the upward half of the water cycle?
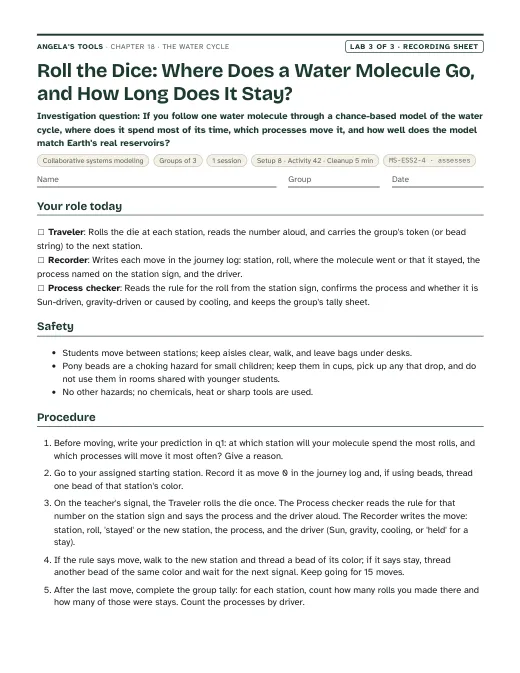
If you follow one water molecule through a chance-based model of the water cycle, where does it spend most of its time, which processes move it, and how well does the model match Earth's real reservoirs?
Materials overview: Clear bowls or food containers, small cups, plastic wrap, rubber bands, small pebbles or coins, table salt, food coloring, a desk lamp with a warm (incandescent or halogen) bulb if the room lacks sun, shallow trays, zip-top bags, string, rulers, a 10 mL syringe or small graduated cylinder, dice, printed station cards, and optional colored beads. Everything is available from a grocery or hardware store; the three labs together cost an estimated 20 to 50 dollars per class, mostly in reusable items.
Review status: reviewed · 2026-10-19 · Resumed after both authors were interrupted: W8 q2's example routes broke the sheet's own rule (two pairs shared four cards); rewrote it with three routes that share at most two cards per pair, one avoiding the ocean. Presentation estimatedMinutes (127) equals the pacing sum and every bullet is within 110 characters. Science fixes: slide 4 bar and caption (lakes, rivers, soil, air and living things hold about 0.02 percent of Earth's water, not 0.1); lake residence time is years to centuries (slide 20, Lab 3 table and key, accuracy notes); slide 19 no longer credits condensation for mild cloudy nights; slide 23 fog forms from moist air chilled over a cold ocean; W3 calls the sun and gravity two drivers rather than two forces, says evaporated water returns to the air rather than 'to the sea', and says pumps lift water uphill rather than only over ridges; W7 rule no longer says gravity never heats. Keys and arithmetic re-solved for all ten worksheets and three labs; distiller data in slide 22, W9 and Lab 1 checked. Fixed: W10 points (synthesis now 8, equal to items 1-6; total 25); W5 q10 ratio (3.3 to 4.4 times); W9 basin described as about 1 cm of water so its outputs are physically realistic, and the 58 C water is no longer called safe to touch; Lab 1 q9 example (the basic still already has the pebble, and 6 to 11 mL is not a doubling) and q5 scale range; Lab 3 driver and roll-share statements recomputed from the rule probabilities; W4 Route 2 no longer sends groundwater from the field uphill to the spring on the far side. Originality: a 6-word scan against the lesson text found echoes in ten strings (including the W10 snowy-city scene, which repeated the textbook opener's wording); all rewritten. W3 passage trimmed from 734 to 685 words. Standards: caGrade added to every lab standards entry (6 for MS-ESS2-4, 6-8 for ETS1); chapter role for MS-ETS1-3 raised to assesses to match W9, which meets the PE as written; MS-ESS2-4 notes state the Grade 6 placement throughout. Consistency: evidenceOfLearning, threeDimensions and fourteen slide links corrected to describe the worksheets as written (W6 is a lake water-budget CER, not the Sierra phenomenon; W5 has no reservoir shares; W8 has no contrail card); lab cost total corrected to an estimated 20 to 50 dollars; pacing now says not every worksheet fits seven periods. Safety: Lab 1 adds a teacher-only rule for warm water above 50 C; Lab 2 plant warning made accurate and the soil-drying suggestion no longer uses an oven. Labs remain physically untested, as their model limitations say; all datasets are labeled simulated.
Verified against the student edition of Bring Science Alive! 7th Grade Integrated (Student Edition). Printed page numbers appear in the book; PDF pages are the physical pages of the 524-page scan (printed + 36). The textbook is not reproduced on this site.
| Section | Printed pages | PDF pages | Used for |
|---|---|---|---|
| Introduction: the kayaker, Sun energy versus Earth's interior, the four spheres | 232, 233 | 268, 269 | Framing that the Sun, not Earth's interior, supplies most of the energy; the NGSS box listing MS-ESS2-4 and MS-ETS1-4. |
| 1. Heating and the Water Cycle: evaporation and transpiration | 234, 235 | 270, 271 | Particle model of evaporation, no starting point, transpiration and stomata, the 90/10 estimate, the sweat analogy; slides 6-9 and Lab 2. |
| 2. Cooling and the Water Cycle: condensation and crystallization | 236, 237 | 272, 273 | Condensation onto particles, energy released, the cold-window example, crystallization and frost; slides 10-14. |
| 3. Gravity and the Water Cycle: precipitation, runoff, infiltration, groundwater | 238, 239 | 274, 275 | Droplet growth and air resistance, runoff, infiltration, pores, aquifers and groundwater flow to the ocean; slides 15-18 and the aquifer layers diagram. |
| Key Science Concept: Global Processes in the Water Cycle | 240, 241 | 276, 277 | The nine named processes including melting and groundwater flow; the basis for Lab 3's stations and the energy-accounting slide. |
| 4. Designing a Fog Catcher: Atacama fog nets and iterative testing | 242, 243 | 278, 279 | Fog as a ground-level cloud, droplets merging and draining by gravity, iterative testing with input and output data; slide 23, Lab 1 and W9. |
| Lesson Summary | 243 | 279 | Checking that every summary idea is covered by a target; identified the muddled 'crystallized water vapor that has condensed' sentence recorded in accuracyNotes. |