Chapter 19 · Unit 6: Processes that Shape Earth · Segment 3

Earth's Natural Resources

Why are mineral, energy and groundwater resources concentrated in some places and missing from others, and what happens to that pattern as people use them?

MS-ESS3-1 · assessesMS-ETS1-2 · assessesMS-ESS2-4 · supportsMS-ESS2-1 · supports Textbook pp. 244–259 1 presentation · 10 worksheets · 3 labs

Overview

Students figure out why Earth's resources are lumpy: gold runs in a narrow belt through the Sierra foothills, oil clusters under Kern County, geothermal steam rises north of San Francisco, and the biggest groundwater store in California sits under the Central Valley. Each resource formed only where a particular set of geoscience processes came together, often long ago, so a resource map is really a map of Earth's history. Students learn to read geologic clues as evidence, to sort resources by how fast nature replaces them compared with a human lifetime, and to see that pumping, drilling, mining and logging now redraw the map. The engineering strand uses Hoover Dam to show how a team weighs competing designs against criteria and constraints.

Estimated class time: presentation about 138 minutes · worksheets about 400 minutes in total · labs 4 sessions. Seven 50-minute periods: one for the phenomenon and the renewable/nonrenewable idea, two for groundwater and the aquifer decision lab, one for petroleum and ores with the treasure-map mystery, one for the cookie mine and the human-change idea, one for geothermal, soil, wood and the Hoover Dam engineering strand, and one for synthesis and mastery. Lab 3 spans two sessions; its second session can be homework-style data work if time is short.

Phenomenon

California's buried treasure map is lumpy

Lay four maps of California on top of each other. The big historic gold mines form a thin stripe along the western foothills of the Sierra Nevada, with only scattered mines elsewhere. Oil wells crowd into the southern San Joaquin Valley around Kern County. Geothermal power plants cluster in a few spots, the largest at The Geysers north of San Francisco and in the Imperial Valley near the Salton Sea. The largest groundwater store lies under the flat Central Valley. None of these treasures is spread evenly, and the four patterns do not overlap. Something about each place made its resource form there and not next door. What was it?

Notice and wonder prompts

  • What do you notice about the shape of each resource pattern: a stripe, a cluster, a flat sheet?
  • Why would gold follow a mountain range while oil sits under a flat valley?
  • Could the places that have a resource today run out, and could the map look different in 100 years?
  • What clues at the surface might tell a geologist what is hidden underneath?

Learning targets

  • I can explain, with evidence, how past and present geoscience processes concentrated a mineral, energy or groundwater resource in one place and not another.
  • I can describe the conditions needed to form an ore deposit, a petroleum reservoir, a geothermal field and an aquifer.
  • I can classify a resource as renewable or nonrenewable by comparing how fast nature replaces it with a human lifetime, and explain why renewable does not mean unlimited.
  • I can use data on recharge and pumping to decide whether a use of groundwater is sustainable.
  • I can evaluate competing design solutions against criteria and constraints, using Hoover Dam, a water-supply decision and an energy decision as cases.

What shows the learning happened

  • A prediction map (Lab 1) that places drill sites for four resources and, for each site, names the geologic clue and the process it points to, scored against the hidden answer map.
  • A completed mining ledger (Lab 2) with chip count, ore grade, costs, reclamation score and profit, plus a written comparison of a high-grade and a low-grade deposit.
  • A decision matrix (Lab 3) that scores three water-supply plans against criteria and constraints, with a calculation of years until an aquifer is drawn down under each plan; W9 applies the same method to four energy options with 30-year costs.
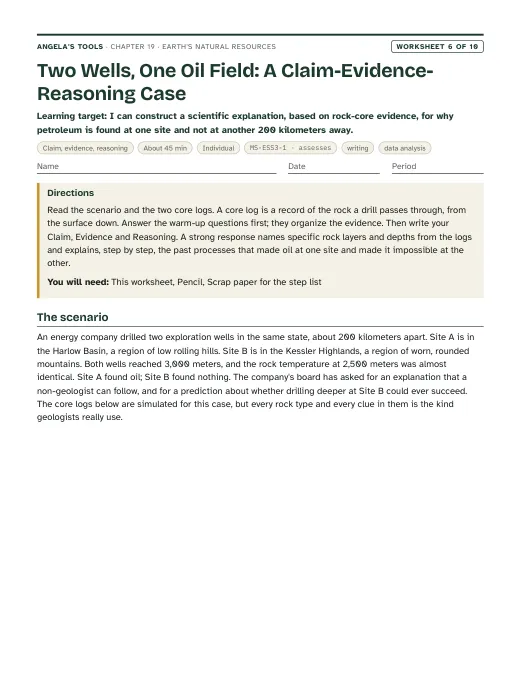
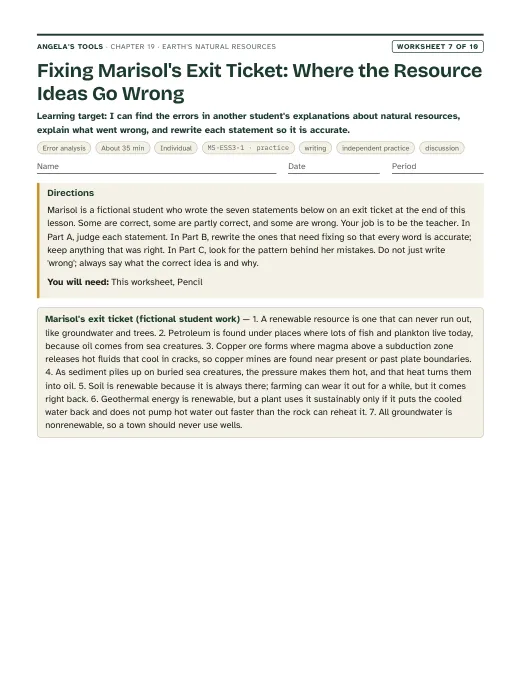
  • A Claim-Evidence-Reasoning paragraph (W6) explaining, from two core logs, why one drill site found petroleum and another 200 kilometers away found none, citing at least four pieces of rock evidence.
  • A sorted set of resources (W2, W10) labeled renewable or nonrenewable with a one-sentence justification based on replacement time, including the case of a deep desert aquifer.
  • A short answer explaining why renewable does not mean unlimited, using The Geysers or an overpumped aquifer as the example.

Key vocabulary 12 terms

natural resourceA material or energy source that people take from nature and use, such as water, oil, copper ore, soil, wood or heat from inside Earth.A geologist studying a natural resource asks first what process concentrated it there and second how fast nature can replace it.
renewable resourceA resource that natural processes replace within about a human lifetime, such as surface water, a planted forest or the steady flow of heat from Earth's interior. It can still run short in a place where people use it faster than it is replaced.A hydrologist calls river water a renewable resource but still measures whether a city is taking more each year than the river carries.
nonrenewable resourceA resource that takes far longer than a human lifetime to form, such as petroleum, copper ore or thick fertile topsoil, so the supply shrinks as people use it.Because copper ore is a nonrenewable resource, a mine's output eventually falls and companies turn to recycling for more metal.
sustainableDescribes a way of using a resource that leaves enough for future generations: the rate of use is no greater than the rate at which the resource is replaced or recovered.Pumping an aquifer is sustainable only when the amount pumped each year is no larger than the amount that soaks back in.
groundwaterWater that has soaked into the ground and fills the pores and cracks in sediment and rock below the surface.During a dry summer the stream kept flowing because groundwater was seeping into it from the gravel beneath the valley.
aquiferA body of porous rock or sediment, such as gravel, sand or sandstone, that stores groundwater and lets it flow well enough to supply a well.The well driller stopped at 60 meters because the sandstone aquifer there yields more water than the clay above it.
rechargeThe water that reaches an aquifer by soaking down from rain, snowmelt, rivers or irrigation. The recharge rate is how much arrives per year.After three wet winters the recharge was enough to raise the water table by two meters.
petroleumCrude oil: a liquid mixture of hydrocarbons that formed over millions of years when the remains of tiny marine organisms were buried, heated and chemically changed deep in sedimentary rock.Petroleum migrated upward through the porous sandstone until a layer of shale stopped it.
geologic trapAn arrangement of rock layers, such as an upward fold or a fault, where a sealing layer stops rising oil and gas and holds them in a porous reservoir rock.The drilling team mapped a geologic trap by finding where the sandstone arched up beneath a shale cap.
oreRock that holds a valuable mineral or metal in a high enough concentration that mining it can pay.A rock with 0.5 percent copper counts as ore today, while a rock with 0.05 percent copper is just rock.
hydrothermal fluidHot water, often released by cooling magma or heated by it, that dissolves metals and carries them through cracks in rock, then leaves them behind as minerals when it cools.Quartz veins in the Sierra foothills mark the paths where hydrothermal fluid once flowed and dropped its gold.
geothermal energyEnergy from the heat of Earth's interior, carried to the surface by hot water or steam and used to warm buildings or to spin turbines that make electricity.Geothermal energy is easiest to capture where magma sits close to the surface, which is why plants cluster near plate boundaries and volcanoes.

Standards alignment

California NGSS, Grade 7 Preferred Integrated Course Model. Each entry says whether this chapter's work assesses the performance expectation, gives practice toward it, or supports it as background; the resource lists below repeat this for every worksheet and lab.

MS-ESS3-1Assesses: the full PE: an evidence-based explanation of uneven distribution from past and current geoscience processesCA Grade 7

Construct a scientific explanation based on evidence for how the uneven distributions of Earth’s mineral, energy, and groundwater resources are the result of past and current geoscience processes.

Lab 1, Lab 3, W6 and W10 ask students to use geologic clues (past volcanic arcs, hydrothermal veins, buried marine sediments with traps, porous river gravels, rainfall and ancient climates) as evidence for where a resource is and is not, and to explain how pumping, drilling and mining are changing the pattern. That is the explanation the PE asks for, including its emphasis on limited supply and human removal.

MS-ETS1-2Assesses: evaluating competing solutions with a systematic processCA Grade 6-8

Evaluate competing design solutions using a systematic process to determine how well they meet the criteria and constraints of the problem.

The lesson's engineering spread tells how a team compared five dam types for the Hoover Dam site. Lab 3 has students score three competing water-supply plans in a decision matrix, and W9 has them test four competing energy plans in a pass/fail matrix with 30-year costs; both end in a choice justified against stated criteria and constraints, which is evidence toward this PE.

MS-ESS2-4Supports: infiltration and the water cycle as the source of aquifer rechargeCA Grade 6

Develop a model to describe the cycling of water through Earth’s systems driven by energy from the sun and the force of gravity.

Groundwater recharge is the water cycle seen from below: rain and snowmelt soak through soil into porous rock. This is a Grade 6 PE in the California sequence; this chapter uses it as background for recharge versus pumping and does not reteach or assess the whole cycle.

Assessment boundary: A quantitative understanding of the latent heats of vaporization and fusion is not assessed.

MS-ESS2-1Supports: melting, crystallization, weathering and sedimentation as the processes that concentrate oresCA Grade 7

Develop a model to describe the cycling of Earth’s materials and the flow of energy that drives this process.

The four ways ore forms (crystals settling in magma, hydrothermal veins, sedimentary layering and deep weathering) are rock-cycle processes from the Grade 7 rock cycle lesson. The chapter uses them as the mechanism behind resource distribution; it does not ask students to name minerals.

Assessment boundary: Assessment does not include the identification and naming of minerals.

Science and engineering practices

  • Constructing Explanations and Designing Solutions. Students build the lesson's central explanation: a resource is here and not there because a specific chain of processes happened here. Lab 1 and W6 require the explanation to cite geologic evidence; Lab 3 uses the design half of the practice to choose a water-supply solution, and W9 uses it to choose an energy source for a volcanic town.
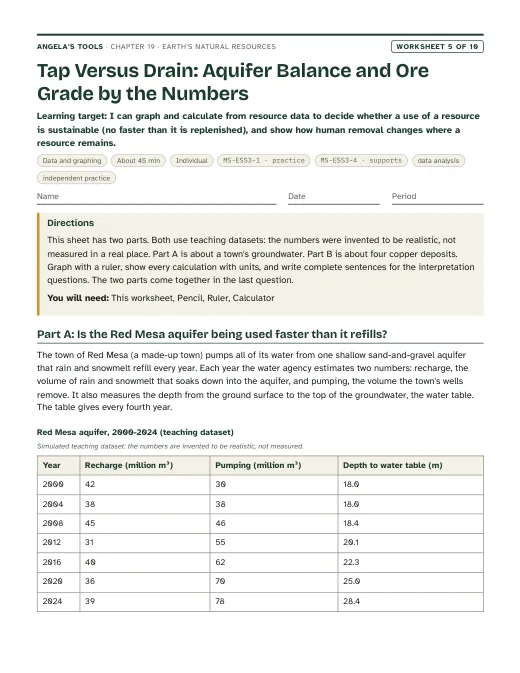
  • Analyzing and Interpreting Data. Students compare recharge and pumping rates (Lab 3, W5), compute ore grade and mining profit from their own cookie-mine measurements (Lab 2), and read simulated site data in the presentation task.
  • Engaging in Argument from Evidence. Groups defend drill-site choices before the answer map is revealed (Lab 1), and students argue whether a given use of a renewable resource is sustainable (W5 q6, W7, slide discussions).

Disciplinary core ideas

  • ESS3.A Natural Resources. People rely on Earth's land, ocean, atmosphere and biosphere for resources; many are limited and not replaceable in a human lifetime; they are distributed unevenly because of past geologic processes, and removal by humans is changing that distribution.
  • ESS2.A Earth's Materials and Systems. Magma, hydrothermal fluids, sedimentation, burial heating, weathering and infiltration are the processes that concentrate ores, petroleum, geothermal heat and groundwater, each at its own rate and timescale.
  • ETS1.B Developing Possible Solutions. A systematic comparison of competing designs against agreed criteria and constraints, modeled on the Hoover Dam decision and practiced in the water-supply decision lab.

Crosscutting concepts

  • Cause and Effect. Every slide and lab asks 'what process caused this resource to be here?' and students use cause-and-effect chains to predict where to look (volcano and hot springs predict geothermal heat; folded marine rock predicts a possible oil trap).
  • Stability and Change. A resource that took millions of years to form can be removed in decades; students compare the two rates to decide whether a use is sustainable and watch the map change under human use.
  • Scale, Proportion, and Quantity. Students compare a human lifetime with formation times from years (surface water) to millions of years (ore, oil), and compare the annual recharge of an aquifer with the annual amount pumped.

Presentation 27 slides

Earth's Natural Resources: why the treasure map is lumpy. Original, editable slides with speaker notes: a phenomenon opener, learning targets, the chapter's concepts with diagrams, vocabulary in context, 3 checks for understanding, 2 discussion prompts, an application task, a misconception check, a synthesis and an exit ticket.
Worksheets 10 of 10

Ten different tasks, one per instructional blueprint. Each has a student PDF (low ink, US Letter), an editable DOCX, an HTML preview, and a separate teacher answer key with reasoning.

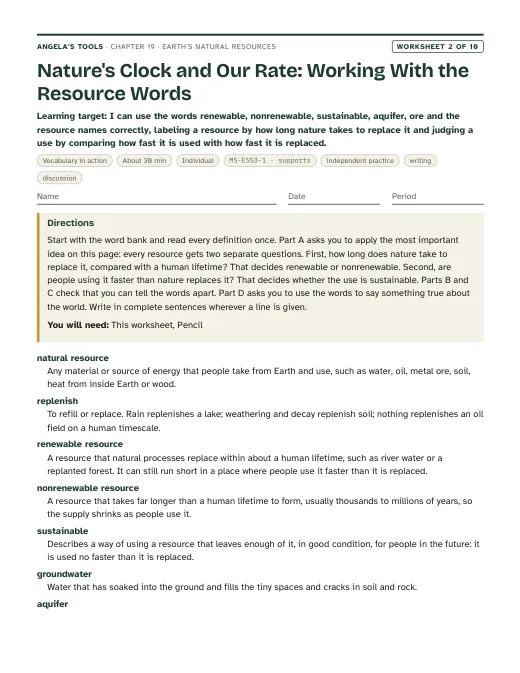
First page of Nature's Clock and Our Rate: Working With the Resource Words
Worksheet 2 · Vocabulary in action

Nature's Clock and Our Rate: Working With the Resource Words

I can use the words renewable, nonrenewable, sustainable, aquifer, ore and the resource names correctly, labeling a resource by how long nature takes to replace it and judging a use by comparing how fast it is used with how fast it is replaced.
30 minindividualBuilds understandingIndependent practiceWritingDiscussion MS-ESS3-1 · supports
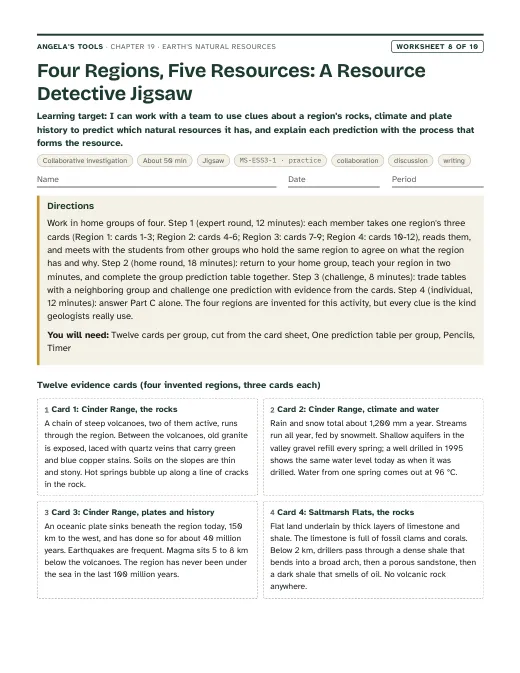
First page of Four Regions, Five Resources: A Resource Detective Jigsaw
Worksheet 8 · Collaborative investigation

Four Regions, Five Resources: A Resource Detective Jigsaw

I can work with a team to use clues about a region's rocks, climate and plate history to predict which natural resources it has, and explain each prediction with the process that forms the resource.
50 minjigsawPracticeCollaborationDiscussionWriting MS-ESS3-1 · practice
First page of Power for Cinder Ridge: Choosing an Energy Source With Criteria and Constraints
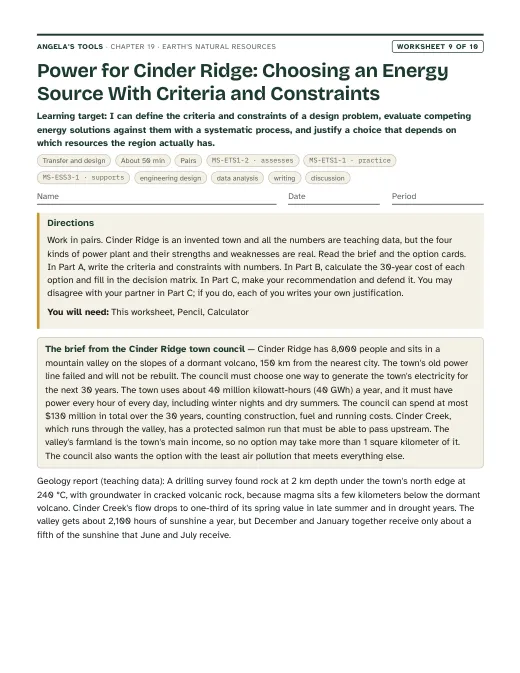
Worksheet 9 · Transfer and design

Power for Cinder Ridge: Choosing an Energy Source With Criteria and Constraints

I can define the criteria and constraints of a design problem, evaluate competing energy solutions against them with a systematic process, and justify a choice that depends on which resources the region actually has.
50 minpairsExtensionEngineering designData analysisWritingDiscussion MS-ETS1-2 · assessesMS-ETS1-1 · practiceMS-ESS3-1 · supports
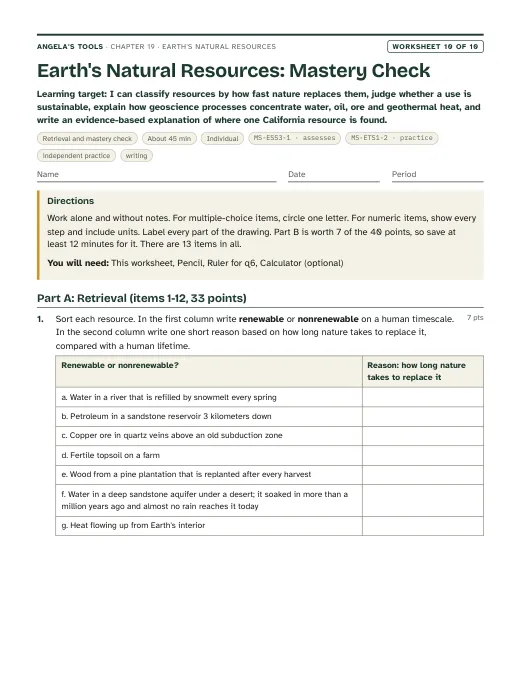
First page of Earth's Natural Resources: Mastery Check
Worksheet 10 · Retrieval and mastery check

Earth's Natural Resources: Mastery Check

I can classify resources by how fast nature replaces them, judge whether a use is sustainable, explain how geoscience processes concentrate water, oil, ore and geothermal heat, and write an evidence-based explanation of where one California resource is found.

45 minindividualAssessmentIndependent practiceWriting MS-ESS3-1 · assessesMS-ETS1-2 · practice

Collaborative labs 3 of 3

Three different investigation approaches. Each has a teacher guide (purpose, materials with quantities, estimated cost, prep, safety, procedure, expected observations, debrief, answer key, assessment criteria, accessibility adaptations, low-cost alternative) and a student recording sheet.
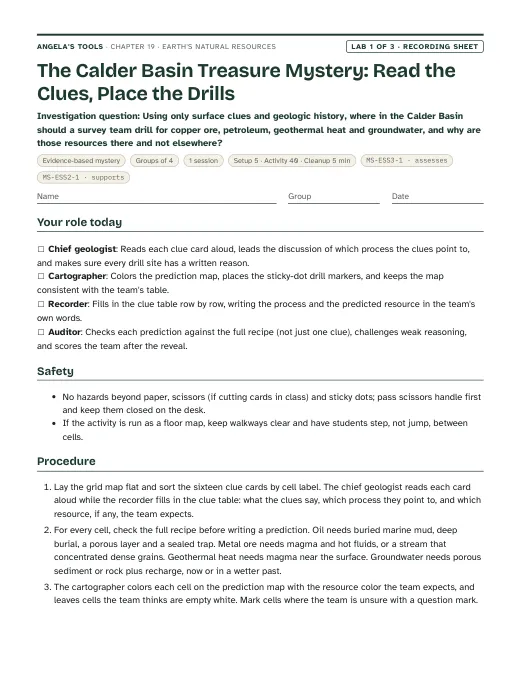
First page of the The Calder Basin Treasure Mystery: Read the Clues, Place the Drills recording sheet
Lab 1 · Evidence-based mystery

The Calder Basin Treasure Mystery: Read the Clues, Place the Drills

Using only surface clues and geologic history, where in the Calder Basin should a survey team drill for copper ore, petroleum, geothermal heat and groundwater, and why are those resources there and not elsewhere?
Groups of 41 session40 min activityEst. 3 to 6 per classCalder Basin grid map (4 columns A-D west to east, 4 rows 1-4 north to south), printed on letter or tabloid paperSet of 16 clue cards (printed from the recording sheet and cut apart)Sticky dots or small colored chips for drill markers MS-ESS3-1 · assessesMS-ESS2-1 · supports
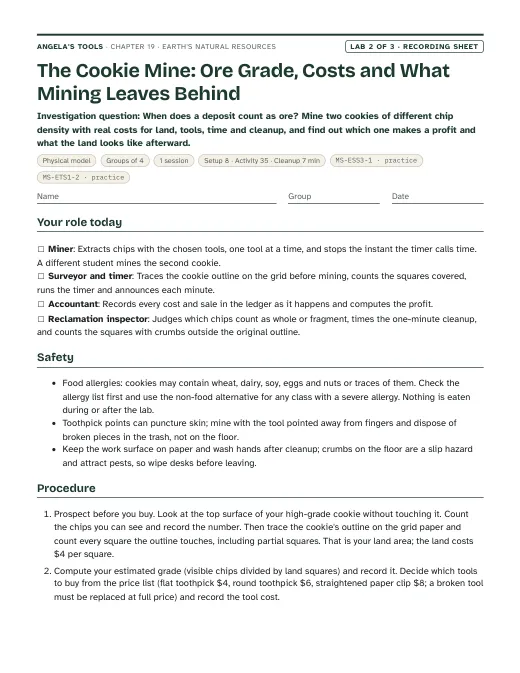
First page of the The Cookie Mine: Ore Grade, Costs and What Mining Leaves Behind recording sheet
Lab 2 · Physical model

The Cookie Mine: Ore Grade, Costs and What Mining Leaves Behind

When does a deposit count as ore? Mine two cookies of different chip density with real costs for land, tools, time and cleanup, and find out which one makes a profit and what the land looks like afterward.
Groups of 41 session35 min activityEst. 10 to 16 per classHigh-grade deposit: a small chocolate-chunk or extra-chip cookie, about 4 to 5 cm across (many visible chips)Low-grade deposit: a cookie (or half cookie) of the same size with few chips, for example an oatmeal cookie with a few chips or a plain cookie brand with sparse chipsCentimeter grid paper (the mining claim) MS-ESS3-1 · practiceMS-ETS1-2 · practice
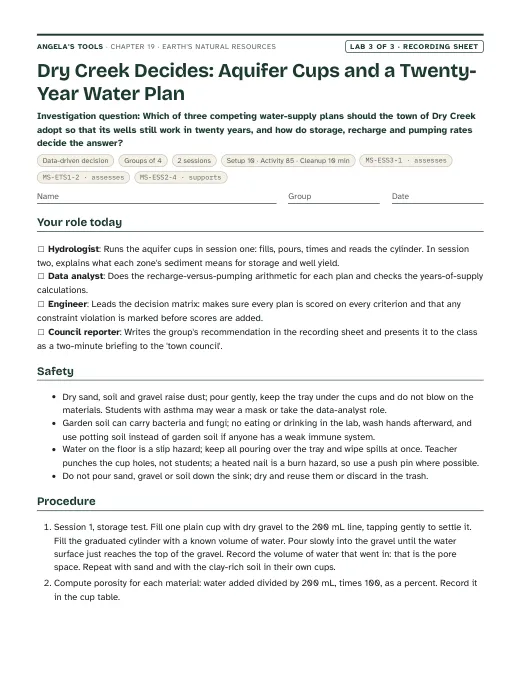
First page of the Dry Creek Decides: Aquifer Cups and a Twenty-Year Water Plan recording sheet
Lab 3 · Data-driven decision

Dry Creek Decides: Aquifer Cups and a Twenty-Year Water Plan

Which of three competing water-supply plans should the town of Dry Creek adopt so that its wells still work in twenty years, and how do storage, recharge and pumping rates decide the answer?

Groups of 42 sessions85 min activityEst. 12 to 20 per classClear plastic cups (about 300 mL), marked with a 200 mL linePea gravel or aquarium gravel, dryCoarse play sand, dry MS-ESS3-1 · assessesMS-ETS1-2 · assessesMS-ESS2-4 · supports

Teacher guidance

Suggested sequence (7 steps)
  1. Period 1: Presentation slides 1-7 (lumpy-map phenomenon, targets, what counts as a resource, nature's clock, first vocabulary set, check). W1 phenomenon worksheet records notice/wonder and a first explanation; W2 vocabulary relationships closes the period.
  2. Period 2: Slides 8-13 (Earth's water budget, aquifer layers, why groundwater is uneven, the Central Valley connection, check, discuss). Lab 3 session 1: aquifer cups (gravel, sand, clay-rich soil) to measure storage and drain time. W5 data worksheet on recharge versus pumping fits as homework.
  3. Period 3: Lab 3 session 2: the Dry Creek water-supply decision matrix. W9 transfer, the same decision-matrix method applied to an energy source for a volcanic town, can replace session 2 or extend it for groups that finish early.
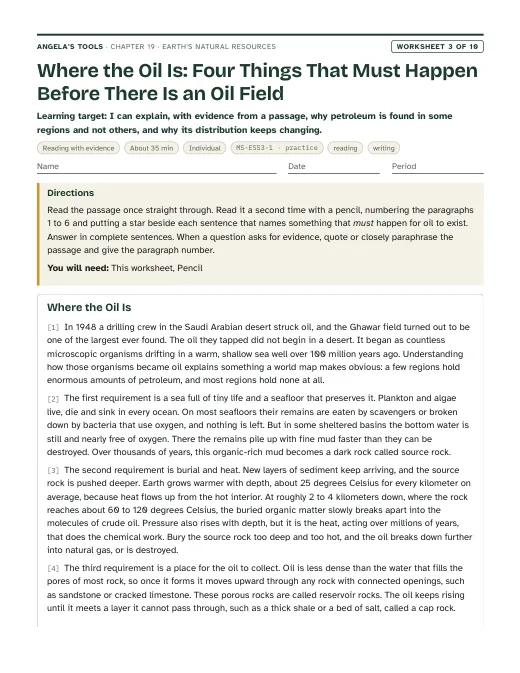
  4. Period 4: Slides 14-19 (how petroleum forms, the full oil recipe, second vocabulary set, four ways ore is concentrated, the Mother Lode connection, check). Lab 1: the buried-treasure mystery with geologic clue cards; groups commit to drill sites before the answer map is revealed. W3 reading passage for homework.
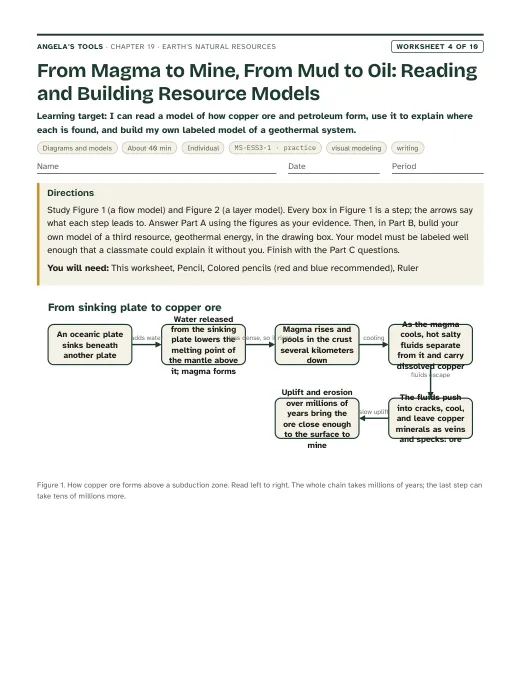
  5. Period 5: Lab 2: the cookie mine, with ore grade, costs and reclamation. Slides 20-22 (geothermal, soil and wood, the 'humans redraw the map' discussion). W4 diagram worksheet (a copper-ore flow model, an oil-trap layer model and a geothermal cross-section students draw) and W7 misconception repair follow.
  6. Period 6: Slides 23-24 (the four-site evidence task, Hoover Dam criteria and constraints). W8 collaborative evidence sort and W6 CER on why one drill site found oil and another did not.
  7. Period 7: Slides 25-27 (misconception, synthesis, exit). W10 mastery as the quiz.

Materials overview: No chemicals or flames. Lab 1 uses printed grid maps, clue cards, sticky dots and answer envelopes. Lab 2 uses store-bought cookies of two chip densities (or play dough with beads), toothpicks, paper clips, centimeter grid paper and a timer; check allergy lists first. Lab 3 uses clear cups, pea gravel, play sand, clay-rich soil, measuring cups or graduated cylinders, a timer, and printed simulated town data. A wall map of California or a projected resource map supports the phenomenon.

Common misconceptions (5)
“Renewable means the resource can never run out.”
Why it happens: The textbook's definition includes resources that exist 'in such great supply' they cannot be depleted, and it calls Earth's interior heat inexhaustible; students generalize to every renewable resource.
Correction: Renewable means nature replaces the resource within about a human lifetime; it says nothing about how fast people may use it. Use a renewable resource faster than nature replaces it and the use is unsustainable, so the supply runs down: the steam field at The Geysers lost pressure in the 1980s when more steam was taken than water returned, and a forest cut faster than it regrows shrinks. Heat from Earth's interior is effectively endless; a particular reservoir of hot water is not.
“Groundwater is always nonrenewable, or always renewable.”
Why it happens: The textbook says most groundwater is nonrenewable, while students' experience of wells refilling after rain suggests the opposite.
Correction: It depends on the aquifer. A shallow gravel aquifer under a rainy valley can refill in a few years. A deep sandstone aquifer under a desert may hold water that soaked in during a wetter climate more than a million years ago and gets almost no recharge today. How long that aquifer takes to refill decides whether its water is renewable; the pumping rate compared with the recharge rate decides whether a particular use is sustainable.
“Resources are spread evenly, so if you dig deep enough anywhere you will find oil, copper or water.”
Why it happens: Students picture Earth's interior as uniform layers, and maps in class usually show where resources are, not the far larger areas where they are absent.
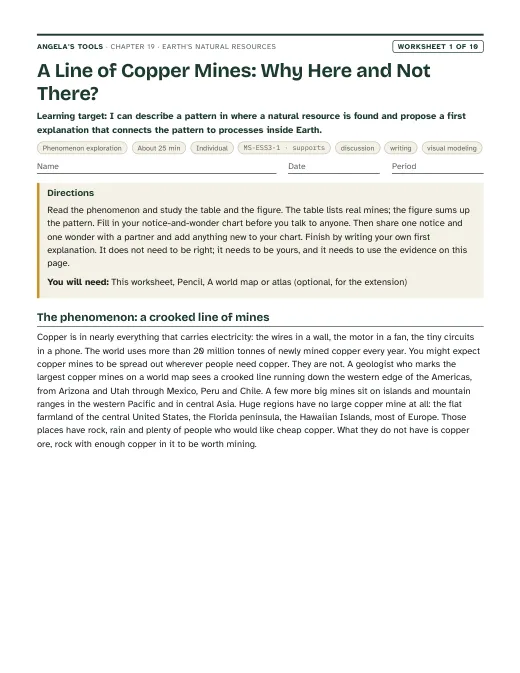
Correction: Each resource needs a specific recipe. Oil needs buried marine organic matter, the right heating, a porous reservoir and a trap. Copper ore needs magma and hot fluids, usually above a sinking plate. Most of the crust never had those ingredients together, which is why drilling is a gamble guided by evidence.
“Oil comes from dinosaurs.”
Why it happens: Popular images and the phrase 'fossil fuel' link oil to big fossils.
Correction: Nearly all petroleum formed from microscopic marine organisms, mostly plankton, that settled into oxygen-poor mud and were buried and heated over millions of years. Coal formed from land plants in swamps. Dinosaur remains contributed essentially nothing.
“Pressure alone turns buried remains into oil, and it happens wherever dead sea life piled up.”
Why it happens: The textbook says temperature rises as pressure rises, and its summary says oil deposits occur wherever marine remains collected in shallow seas.
Correction: Temperature rises with depth because rock gets hotter deeper in Earth. Organic-rich mud becomes oil only inside a temperature window of roughly 60 to 120 degrees Celsius held for a long time, and the oil must then collect in porous rock under a seal. Many ancient seas left no oil field.
Differentiation suggestions (5)
  • Multilingual learners: Pre-teach six anchor terms (resource, renewable, nonrenewable, aquifer, ore, trap) with a sketch beside each; provide the Lab 1 clue cards with a picture glossary of landscape words (vein, fold, gravel, hot spring); allow the Lab 3 justification to be drafted in the home language and summarized in English.
  • Students who need more support: Give a process-to-resource lookup strip (volcano and hot springs → geothermal; granite with quartz veins → metal ore; folded marine sandstone under shale → oil; thick river gravel → groundwater) for Lab 1 and the slide task; pre-fill the land-cost row of the Lab 2 ledger; supply the Lab 3 decision matrix with one plan already scored as a worked example.
  • Students ready for extension: Ask them to explain why bauxite (aluminum ore) forms in hot, rainy tropical regions while porphyry copper forms above subduction zones; to research why the Monterey Formation under Kern County is an unusual oil source rock; or to redesign the Lab 3 plans with a fourth option that uses recycled water.
  • Students who need movement or alternative output: Run Lab 1 as a floor map with students standing on grid cells to defend their drill sites; let the Lab 3 recommendation be presented as a two-minute spoken briefing to the 'town council'; allow the W6 CER to be recorded as audio with a written claim.
  • Students with food allergies or dietary restrictions: Lab 2 must never involve eating, and the teacher checks allergy lists before buying cookies; offer the play-dough-and-bead deposit described in Lab 2's low-cost alternative so every student can mine the same way.
Accuracy notes: where the textbook simplifies (15)
  • Renewable does not mean unlimited (pp. 245, 246, 253). The textbook's definition adds a 'such great supply' clause for resources that cannot be depleted, and it calls Earth's interior heat inexhaustible. Teach renewable as 'replaced by nature within about a human lifetime' and sustainability as a comparison of the use rate with the replacement rate. The heat flow from Earth's interior is effectively endless, but a geothermal reservoir can be drawn down: The Geysers lost steam pressure in the 1980s after decades of heavy withdrawal, and treated wastewater from Lake County (since 1997) and Santa Rosa (since 2003) is now injected to sustain it.
  • 'Most groundwater is nonrenewable' (pp. 247, 257, 259) is a generalization. Whether an aquifer's water is renewable depends on how long nature takes to refill it; whether pumping it is sustainable depends on the pumping rate compared with the recharge rate. Shallow gravel aquifers in rainy regions refill within years; deep aquifers under deserts may hold water that entered during wetter climates long ago. Teach 'it depends on the aquifer', then have students compare pumping with recharge to judge a particular use.
  • Where groundwater is found 'depends mainly on rain or snow' (p. 247 caption, p. 259) is incomplete. The textbook's own map shows major aquifers under the Sahara and central Australia. Groundwater needs porous, permeable rock or sediment to store it, plus water that soaked in either today or in a wetter past. Rainfall, rock type, depth and past climate all matter.
  • Great Artesian Basin refill time (p. 247): the book says at least 2 million years. Dating shows water in parts of the basin has been underground for more than a million years, with slow recharge still entering at the basin margins. Say 'more than a million years in parts of the basin' and 'extremely slow refilling'.
  • Fresh water share (p. 246, Figure 1A): the book's 3 percent fresh (69 percent ice, 30 percent groundwater, 1 percent surface) is rounded. USGS gives about 2.5 percent fresh, split roughly 68.7 percent ice and snow, 30.1 percent groundwater and 1.2 percent surface and other. The presentation uses the USGS values and says they are rounded estimates.
  • Petroleum formation (pp. 250, 257): the book says temperature rises as pressure rises, which suggests pressure causes the heating. Temperature rises with burial depth because rock is hotter deeper inside Earth. Oil forms within a temperature window of roughly 60 to 120 degrees Celsius sustained over a long time. The book's 'wherever marine remains piled up in shallow seas' overstates: oil also needs the right heating, a porous reservoir rock and a trap with a seal, which is why many ancient seas left no oil field.
  • 'Warm, shallow seas' (p. 251) is one common setting, not the only one. The Monterey Formation, the source of much of Kern County's oil, was deposited in deeper offshore basins rich in plankton. Teach 'seas where plankton-rich mud was buried in low-oxygen conditions'.
  • Petroleum and electricity (p. 250): the book's opening line credits oil with the bulk of our energy for both electricity and transportation. Oil dominates transportation but supplies well under 1 percent of U.S. electricity (about 0.7 percent of utility-scale generation in 2025, per EIA). Say 'most transportation fuel' rather than 'most electricity'.
  • Copper ore age at Chuquicamata (p. 256): the book says more than 300 million years. Published dating gives the copper-bearing intrusions at roughly 31 to 35 million years. The deck does not use an age for this mine; it says 'tens of millions of years' for porphyry copper in the Andes.
  • Hoover Dam physics (pp. 248-249): the arch does not reduce the water's pressure; it steers part of the water's push into the canyon walls while the wide concrete base resists by weight. Earth and rockfill dams are not weak as a class (the earth-fill Garrison Dam holds a reservoir nearly as large as Lake Mead); the team's comparison was for this canyon site. The book says the dam releases warmer water; large Colorado River dams draw deep, cold water, which has made parts of the river too cold for some native fish, and warmer surface water passes when the reservoir is low. Say 'the dam changes the river's temperature'. The 21,000 figure is the total number of workers over the project, with about 3,500 on an average day.
  • Wood renewability by species (pp. 258-259): the book calls pine renewable and cedar and redwood nonrenewable. What makes a forest nonrenewable on a human timescale is harvesting old growth that took centuries to grow; coast redwoods resprout from stumps and some living trees were seedlings about 2,000 years ago. Frame renewability as regrowth time versus harvest rate, not as a species label.
  • Dated or inconsistent figures (pp. 245, 250, 251, 252, 258, 259): the 910 liters of water per phone, oil's share of world energy in 2017, Ghawar's daily output, The Geysers' share of North Coast electricity, the '12,000 to 15,000 square kilometers' of forest lost yearly (which disagrees with the book's own '48 football fields per minute' by a factor of about ten; FAO's 2000-2010 figure was about 130,000 square kilometers a year), and Canada's three-trees-per-cut planting rate are snapshots. None is assessed; the deck uses them, if at all, as 'at the time the book was written'.
  • Soil as nonrenewable (p. 254): building a centimeter of fertile topsoil typically takes centuries, so on a human timescale thick fertile soil is nonrenewable, but soil is not a fixed stock: cover crops, reduced tillage and restored vegetation can rebuild organic matter over decades. Teach 'lost far faster than it forms' rather than 'can never come back'.
  • Ore formation beyond copper (p. 256): the book covers only hydrothermal copper. Ores also form by crystals settling in cooling magma (chromium, platinum), by sedimentary processes (iron in ancient sea-floor layers, salt and gypsum from evaporating seas, placer gold in river gravel) and by deep weathering (bauxite for aluminum). The deck teaches all four because the PE asks about mineral resources generally; students are never asked to name minerals.
  • Mother Lode gold: lode gold in the Sierra Nevada foothills sits in quartz veins deposited by hydrothermal fluids roughly 100 to 150 million years ago, during the magmatism that built the Sierra Nevada granite above a subduction zone. Placer gold, the flakes found in 1848 at Sutter's Mill on the American River, is lode gold that weathering freed and streams concentrated in gravel because gold is dense. The veins follow the Melones fault zone, a long fault left where blocks of crust were added to the edge of North America, and geologists think much of the hot water came from rock heated and squeezed deep in the crust during that mountain building rather than straight from the granite magma; the deck's wording ('hot water heated in that episode') covers both sources. Both lode and placer gold are nonrenewable.

Review status: reviewed · 2026-10-19 · Definitions unified on chapter.json: renewable or nonrenewable comes from how long nature takes to replace a resource compared with a human lifetime; sustainable or unsustainable compares the use rate with the replacement rate. W2 (title, word bank, Part A table, concept map, q1, q2, q10, q11, scaffold), W4 (q2, q8, q9, drawing key), W5 (q3, q6 now asks 'sustainable?' and then 'still renewable?'), W7 (statement 6 and every key, scaffold, notes), W8 (groundwater column, steps, q1, q3, q5, rubric, notes) and W9 q8 were rewritten from 'renewable for these users' to the two-question wording; W5 q6 and the slide 27 exit ticket now agree. Slide 27 exit item and slide 6 notes now give the aquifer's refill time so 'renewable?' is answerable from the definition; chapter misconception 2, accuracy note 2 and slides 10 and 13 no longer use recharge versus pumping to decide the label. Re-solved every numeric, multiple-choice, true/false and table item in W1-W10 and Labs 1-3. Fixed: Lab 3 q2 key (garbled drought arithmetic; Plan C loses about 4 Mm3 from Zone G, with the data-sheet cell made explicit), Lab 3 debrief (400 / 0.5 is about 800 years, not 'hundreds of centuries') and expected matrix totals (Plan C cannot exceed 13); W5 2004 water-table depth set to 18.0 m so depth agrees in direction with the net balance; W6 CER evidence item 5 no longer calls the limestone the deepest rock. Science: Mother Lode slide dated to the veins (about 150-100 million years ago) and tied to the Melones fault zone; phenomenon softened ('only scattered' gold mines elsewhere; geothermal plants in 'a few spots'); slide 8 notes corrected (groundwater is about 25 times surface water at USGS values; it supplies roughly 40 percent of world irrigation, not 'most farms'); ore enrichment 'fifty to more than a hundred times'; W8 card 4 reordered so the seal lies above the reservoir and the source rock below; W3 passage trimmed to 687 words and dated 'more than 160 years'. Lab 2 calibrated: prices assume 4-5 cm cookies (20-30 grid squares); a prep step tells teachers to halve larger cookies, and expected profits were restated. Lab 2 q7 now says recycling comes closest to renewal without making copper ore renewable. Standards: caGrade added to every lab standards entry; W9 MS-ETS1-2 raised to 'assesses' (a full systematic evaluation), matching chapter.json; chapter notes, evidence of learning, sequence and slide links corrected to describe W4, W6 and W9 as written (W9 is an energy decision, W6 is a two-well oil CER, W4 has no aquifer cross-section). Invented core logs (W6) and Lab 3 plan table moved into simulated dataset blocks. Six-word overlaps with the lesson text removed or reduced to short quoted fragments in teacher notes. California facts checked: Mother Lode and Sutter's Mill 1848, hydraulic-mining ruling 1884, Kern River field since 1899 and the Monterey Formation, San Joaquin subsidence near 9 m by 1970 and SGMA 2014, The Geysers decline and wastewater injection from 1997 and 2003. Labs remain physically untested.

Source references

Verified against the student edition of Bring Science Alive! 7th Grade Integrated (Student Edition). Printed page numbers appear in the book; PDF pages are the physical pages of the 524-page scan (printed + 36). The textbook is not reproduced on this site.

SectionPrinted pagesPDF pagesUsed for
Introduction: four resources in one phone; the lesson question244, 245280, 281Lesson question, vocabulary list, the publisher's standards box (MS-ESS3-1, MS-ETS1-2), the phone as a resource inventory.
1. Fresh Water: water budget, renewable surface water, aquifers and the Great Artesian Basin246, 247282, 283Water-budget bar diagram, aquifer layers diagram, recharge versus pumping, Lab 3 and W5 groundwater reasoning.
2. Designing Hoover Dam: evaluating five dam designs against criteria and constraints248, 249284, 285Engineering strand, criteria/constraints compare diagram, the decision-matrix method in Lab 3 and W9, environmental trade-offs.
3. Petroleum: formation, Ghawar, uneven distribution250, 251286, 287Petroleum formation flow diagram, the trap and reservoir idea, Lab 1 oil clue cards, the 'oil from dinosaurs' misconception.
4. Geothermal Energy: The Geysers, flash-steam plants, plate boundaries252, 253288, 289Geothermal content slide, the California connection, the 'renewable is not unlimited' misconception slide.
5. Soil: formation by weathering and organic matter, fertility, Ethiopia254, 255290, 291Soil and wood content slide, the biosphere resources in the renewable sort.
6. Copper Ore and Key Science Concept: hydrothermal copper above sinking plates; the distribution summary256, 257292, 293Four-ways-ore-forms diagram, Lab 1 ore clue cards, Lab 2 ore-grade idea, synthesis slide.
7. Wood and Lesson Summary: forest distribution, harvest and replanting258, 259294, 295Wood as a rate-dependent renewable resource, the summary used for the synthesis slide.

External references used for accuracy checks

Related chapters