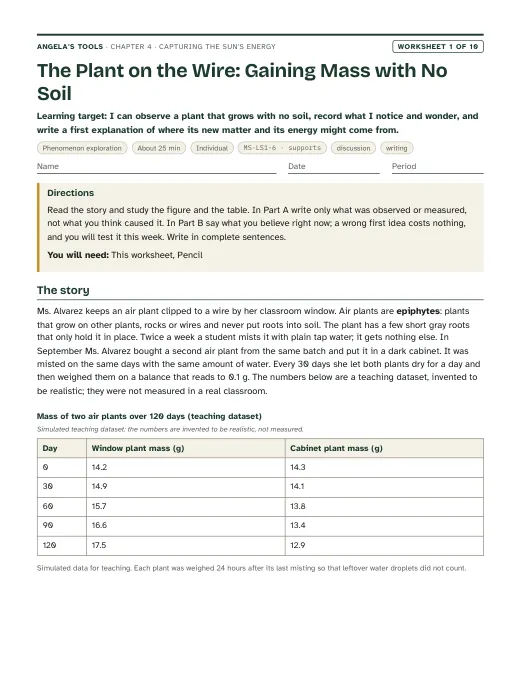
The Plant on the Wire: Gaining Mass with No Soil
I can observe a plant that grows with no soil, record what I notice and wonder, and write a first explanation of where its new matter and its energy might come from.
Chapter 04 · Unit 2: Energy and Matter in Ecosystems · Segment 1
Where do producers get the matter and the energy they use to build their bodies, and how does that supply reach every other living thing?
Students figure out where the matter and energy of living things come from. They trace a tree's mass back to carbon dioxide in the air and water from the soil, and its energy back to sunlight captured by chlorophyll inside chloroplasts. They count atoms across the photosynthesis equation to see that matter is rearranged, never created, while light energy ends up stored as chemical energy in sugar. They follow that sugar into three jobs: released for energy, stored as starch, or built into cellulose, and they see that biomass is the stored matter and energy the rest of an ecosystem lives on. The chapter closes with an engineering decision: which source of biomass should become jet fuel, judged against criteria and constraints. This lesson is the foundation for Lesson 5 (how organisms release stored energy) and Lessons 6 and 7 (food webs and matter cycles).
Estimated class time: presentation about 131 minutes · worksheets about 375 minutes in total · labs 3 sessions. Six to seven 50-minute periods: one for the phenomenon and producers, two for photosynthesis inputs, outputs and the leaf-disk lab, one for the evidence and atom-tracking model, one for storage and biomass, one for the biofuel decision, one for synthesis and mastery.
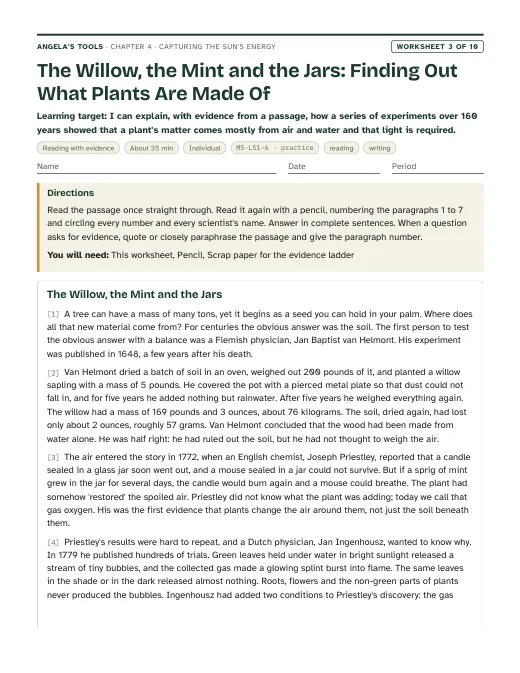
In the 1640s a Flemish physician, Jan Baptist van Helmont, dried 90 kilograms of soil, put it in a pot, and planted a willow sapling that weighed about 2 kilograms. For five years he watered it and kept dust out. Then he lifted out the tree and weighed it again: about 76 kilograms. He dried and weighed the soil: it had lost only about 60 grams. The tree had gained roughly 74 kilograms of wood, bark and leaves, but almost none of it came out of the pot. Where did all that matter come from?
Notice and wonder prompts
California NGSS, Grade 7 Preferred Integrated Course Model. Each entry says whether this chapter's work assesses the performance expectation, gives practice toward it, or supports it as background; the resource lists below repeat this for every worksheet and lab.
Construct a scientific explanation based on evidence for the role of photosynthesis in the cycling of matter and flow of energy into and out of organisms.
The whole lesson is this PE: students use experimental evidence (the willow, leaf disks in Lab 1, Ingenhousz and de Saussure) to explain that a producer's matter comes from carbon dioxide and water and its energy from light. Lab 1, W6 and the exit ticket produce written explanations that trace matter and energy into and out of the producer, within the assessment boundary (no biochemical mechanism is taught or assessed).
Assessment boundary: Assessment does not include the biochemical mechanisms of photosynthesis.
Develop a model to describe the cycling of matter and flow of energy among living and nonliving parts of an ecosystem.
Lab 2 has students build a token model with a defined system boundary showing atoms moving from air and water into a producer, then into a consumer, while energy enters as light and leaves as heat. This builds the model-making practice that Lessons 6 and 7 extend to whole ecosystems, so the role is practice rather than assesses.
Assessment boundary: Assessment does not include the use of chemical reactions to describe the processes.
Evaluate competing design solutions using a systematic process to determine how well they meet the criteria and constraints of the problem.
The lesson's engineering spread describes how engineers judged biomass sources for jet fuel. Lab 3 requires students to score several competing feedstocks in a decision matrix built from explicit criteria and constraints and to justify the winner, which is direct evidence toward this PE; the W9 transfer challenge builds the same evaluation.
Define the criteria and constraints of a design problem with sufficient precision to ensure a successful solution, taking into account relevant scientific principles and potential impacts on people and the natural environment that may limit possible solutions.
Before scoring feedstocks in Lab 3, students write the criteria and constraints in measurable terms and sort which is which. This is a step toward defining a design problem precisely, but the problem itself is given to them, so the role is practice. W9 Part A goes further: students rewrite a council brief as measurable criteria and constraints and add an impact-based constraint of their own, which W9 treats as evidence toward the PE.
Capturing the Sun's Energy: where living matter and energy come from. Original, editable slides with speaker notes: a phenomenon opener, learning targets, the chapter's concepts with diagrams, vocabulary in context, 3 checks for understanding, 2 discussion prompts, an application task, a misconception check, a synthesis and an exit ticket.

Ten different tasks, one per instructional blueprint. Each has a student PDF (low ink, US Letter), an editable DOCX, an HTML preview, and a separate teacher answer key with reasoning.
I can observe a plant that grows with no soil, record what I notice and wonder, and write a first explanation of where its new matter and its energy might come from.
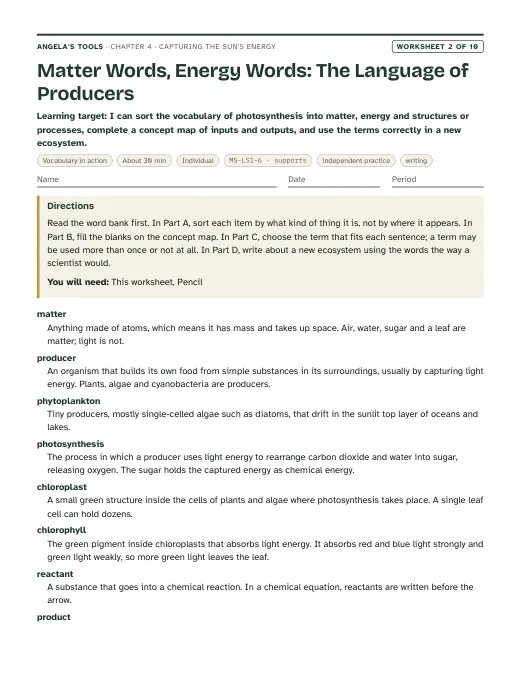
I can sort the vocabulary of photosynthesis into matter, energy and structures or processes, complete a concept map of inputs and outputs, and use the terms correctly in a new ecosystem.
I can explain, with evidence from a passage, how a series of experiments over 160 years showed that a plant's matter comes mostly from air and water and that light is required.
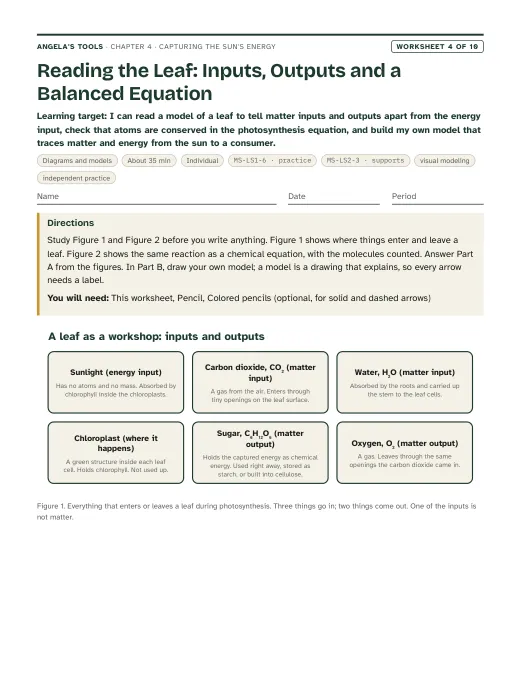
I can read a model of a leaf to tell matter inputs and outputs apart from the energy input, check that atoms are conserved in the photosynthesis equation, and build my own model that traces matter and energy from the sun to a consumer.
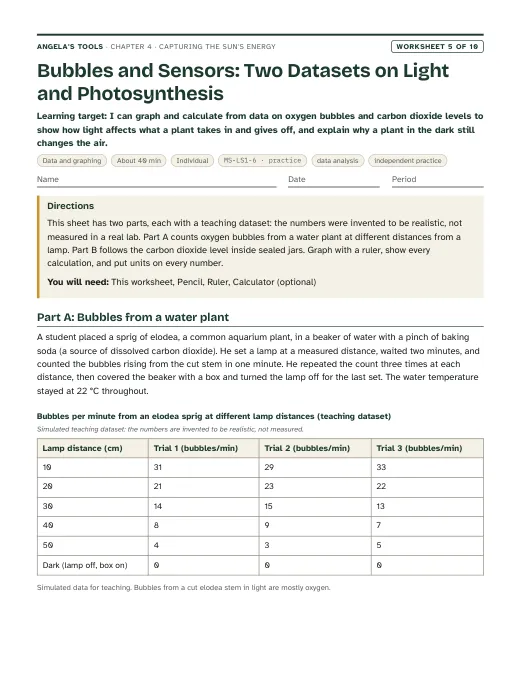
I can graph and calculate from data on oxygen bubbles and carbon dioxide levels to show how light affects what a plant takes in and gives off, and explain why a plant in the dark still changes the air.
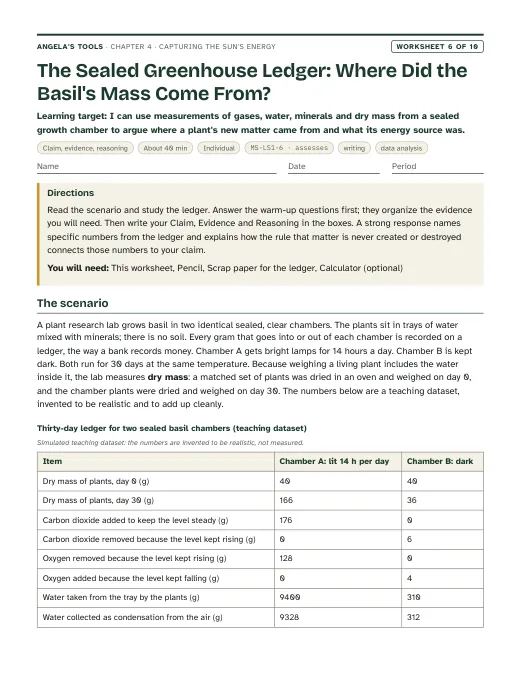
I can use measurements of gases, water, minerals and dry mass from a sealed growth chamber to argue where a plant's new matter came from and what its energy source was.
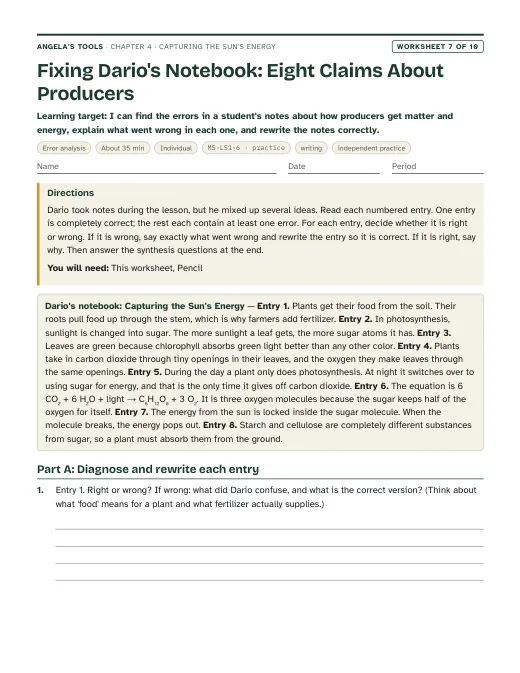
I can find the errors in a student's notes about how producers get matter and energy, explain what went wrong in each one, and rewrite the notes correctly.
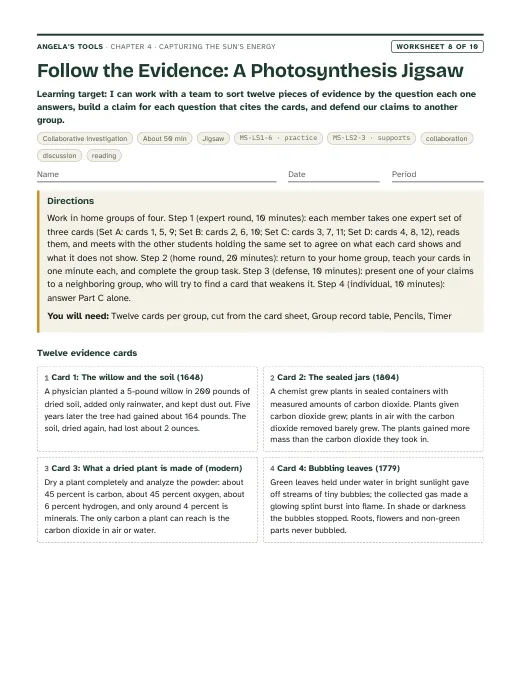
I can work with a team to sort twelve pieces of evidence by the question each one answers, build a claim for each question that cites the cards, and defend our claims to another group.
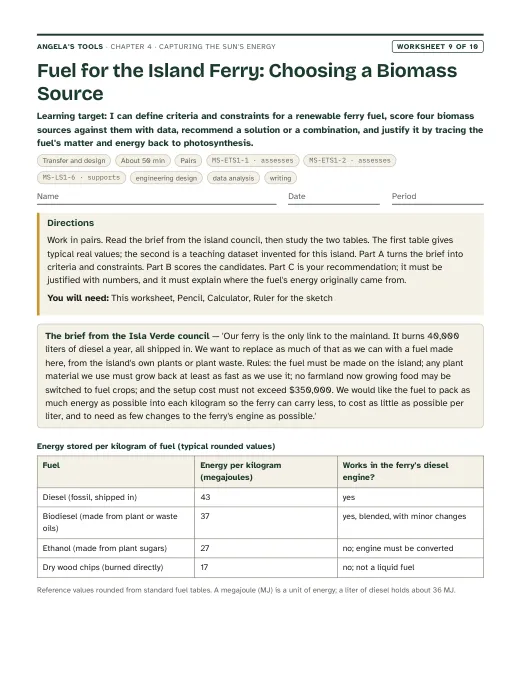
I can define criteria and constraints for a renewable ferry fuel, score four biomass sources against them with data, recommend a solution or a combination, and justify it by tracing the fuel's matter and energy back to photosynthesis.
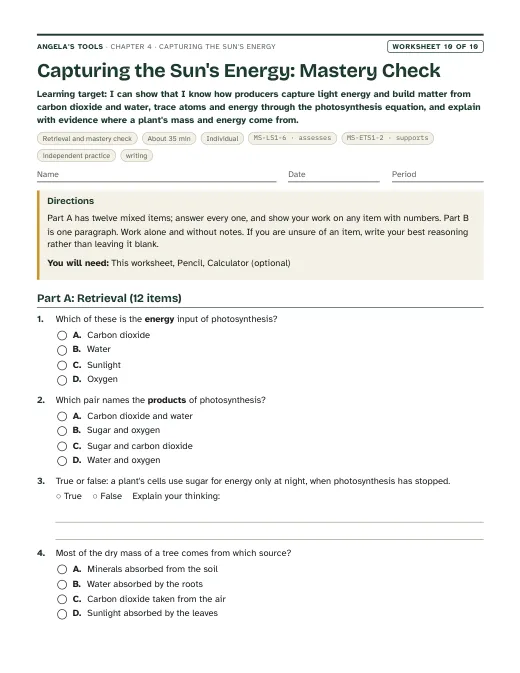
I can show that I know how producers capture light energy and build matter from carbon dioxide and water, trace atoms and energy through the photosynthesis equation, and explain with evidence where a plant's mass and energy come from.
Three different investigation approaches. Each has a teacher guide (purpose, materials with quantities, estimated cost, prep, safety, procedure, expected observations, debrief, answer key, assessment criteria, accessibility adaptations, low-cost alternative) and a student recording sheet.
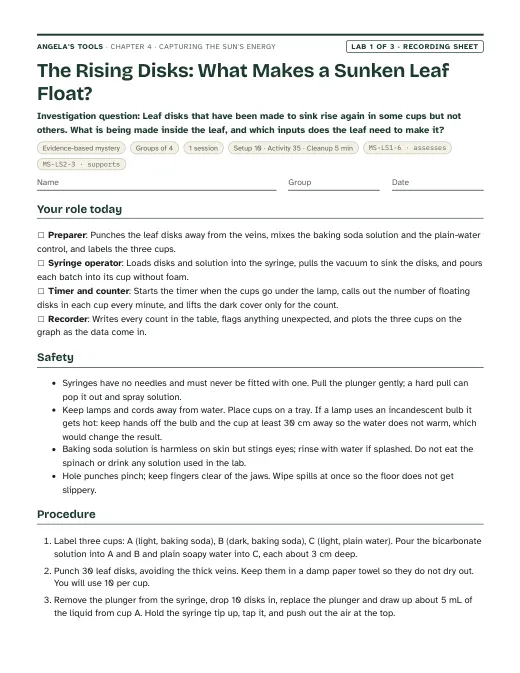
Leaf disks that have been made to sink rise again in some cups but not others. What is being made inside the leaf, and which inputs does the leaf need to make it?
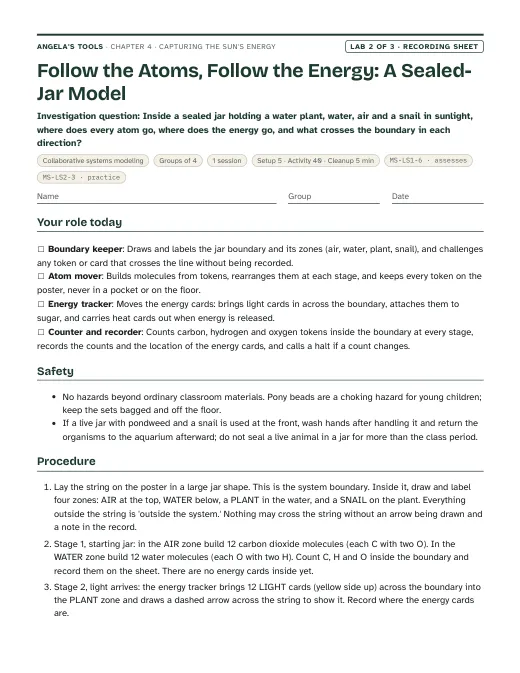
Inside a sealed jar holding a water plant, water, air and a snail in sunlight, where does every atom go, where does the energy go, and what crosses the boundary in each direction?
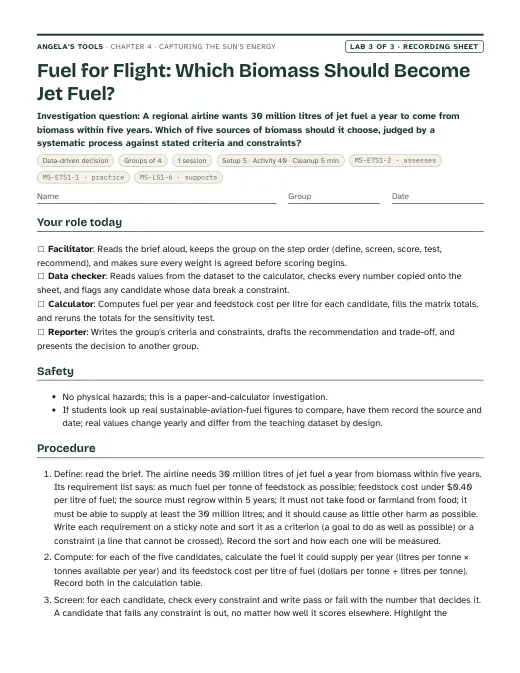
A regional airline wants 30 million litres of jet fuel a year to come from biomass within five years. Which of five sources of biomass should it choose, judged by a systematic process against stated criteria and constraints?
Materials overview: No open flames and no hazardous chemicals. Lab 1 uses fresh spinach, a hole punch, needleless plastic syringes, baking soda, a drop of dish soap, clear cups, a desk lamp or sunlight and a dark box. Lab 2 uses printed or bead atom tokens, index cards, string and poster paper. Lab 3 uses printed feedstock data cards, a decision-matrix sheet and calculators. A digital balance and a potted seedling make a good standing demonstration of the willow phenomenon across the unit.
Review status: reviewed · 2026-10-18 · Re-solved every numeric and multiple-choice item in W1-W10 and Labs 1-3 against the keys; equation atom counts, ledger balance, rate and matrix arithmetic confirmed. W5 Part A: 20 cm trials changed to 21, 23, 22 (average 22) so the drop per step shrinks at every step as the key claims; key and teacher note updated. W3: willow final mass aligned to about 76 kg and the metric ratio alternative corrected (it had used the final mass instead of the gain). Lab 3 q3: timber is fourth, not second, in fuel per tonne; prompt now cites its second-largest fuel per year and largest supply. Lab 2 stage 3: energy cards have only LIGHT and HEAT sides; 'stored' is now defined as a card inside a sugar card. Lab 1: dark-cup expectations and q6 key now fit the 10-minute observation window. W7 q4 key: W5's sealed jars measured carbon dioxide only; oxygen evidence now cited from W3. Slide 9 edge labels replaced (zoom factors were not to scale); slide 2 link corrected (W1 uses an air plant, not the willow). Originality: W2 q6 and learning target 4 rephrased; biofuel definition rewritten in chapter and W2 so no student-facing phrase matches the lesson text. Chapter MS-ETS1-1 note now reconciles the chapter's practice role with W9 Part A.
Verified against the student edition of Bring Science Alive! 7th Grade Integrated (Student Edition). Printed page numbers appear in the book; PDF pages are the physical pages of the 524-page scan (printed + 36). The textbook is not reproduced on this site.
| Section | Printed pages | PDF pages | Used for |
|---|---|---|---|
| Introduction: sequoias and the lesson question | 42, 43 | 78, 79 | Lesson question, the 'nonliving to living' idea, vocabulary list, the publisher's standards list including MS-ETS1-2. |
| 1. Producers Capture Energy and Matter: land and water producers | 44, 45 | 80, 81 | Matter and energy needs, producer definition, examples (trees, mosses, ferns, grasses, eelgrass, Volvox, diatoms, cyanobacteria) used in the producers diagram and W2. |
| 2. Producers Use Photosynthesis: chloroplasts, chlorophyll, inputs, the equation | 46, 47 | 82, 83 | Leaf-to-chloroplast zoom, why leaves look green (corrected), reactants and products, the balanced equation used in Lab 2 and the atom-count check. |
| Key Science Concept: Matter and Energy in Photosynthesis | 48 | 84 | The matter-versus-energy framing that runs through the deck and the misconception slide. |
| 3. Discovering Photosynthesis: Ingenhousz and de Saussure | 49 | 85 | Experiments timeline, Lab 1 design (light versus dark, submerged leaves), the mass-from-air evidence used in W6. |
| 4. Storing Energy and Matter: sugar, starch, cellulose, biomass | 50, 51 | 86, 87 | Sugar's three jobs concept map, storage vocabulary, biomass definition, Lab 2's storage and consumer steps. |
| 5. Biomass Is a Source of Energy for Humans: jet fuel criteria and constraints | 52, 53 | 88, 89 | Engineering strand: criteria, constraints, biofuel definition, the city-waste example used in Lab 3 and the task slide; lesson summary. |