Chapter 11 · Unit 4: Earth's Systems · Segment 2

Scales of Change on Earth's Surface

How does Earth's surface change through time, and how do scientists compare changes that are tiny or enormous, instant or almost endless?

MS-ESS2-2 · assessesMS-ESS2-1 · supportsMS-ESS3-2 · supports Textbook pp. 140–149 1 presentation · 10 worksheets · 3 labs

Overview

Students figure out that Earth's surface is never finished: rock is broken down (weathering), carried away (erosion), dropped somewhere new (deposition) and pushed up from below (uplift) by water, ice, wind, gravity, living things and chemical reactions. They learn to size up every change with two rulers, one for space (a sand grain to the whole planet) and one for time (a split second to billions of years), and discover that size and speed do not travel together. Using rates they measure themselves, students show how changes too small to watch add up to canyons, dunes and mountain ranges, and how slow build-ups end in sudden collapses, floods and eruptions. Finally they use uniformitarianism to read a landscape's past from processes they can observe today. This chapter is the surface half of the rock cycle (Lesson 17) and the calm half of the hazards story (Lessons 25 and 26).

Estimated class time: presentation about 128 minutes · worksheets about 410 minutes in total · labs 5 sessions. Seven 50-minute periods plus five-minute crystal check-ins at the start of class for a week: one period for the phenomenon and the process vocabulary; one to start the crystal clock (Lab 1) and build the space scale; one for time scales, rates and the sudden-event story; one for the valley mystery (Lab 2); one for the campus field investigation (Lab 3); one for patterns, uniformitarianism and the crystal clock's final measurements; one for synthesis and mastery.

Phenomenon

The cliff that did nothing for a century, then changed in ten seconds

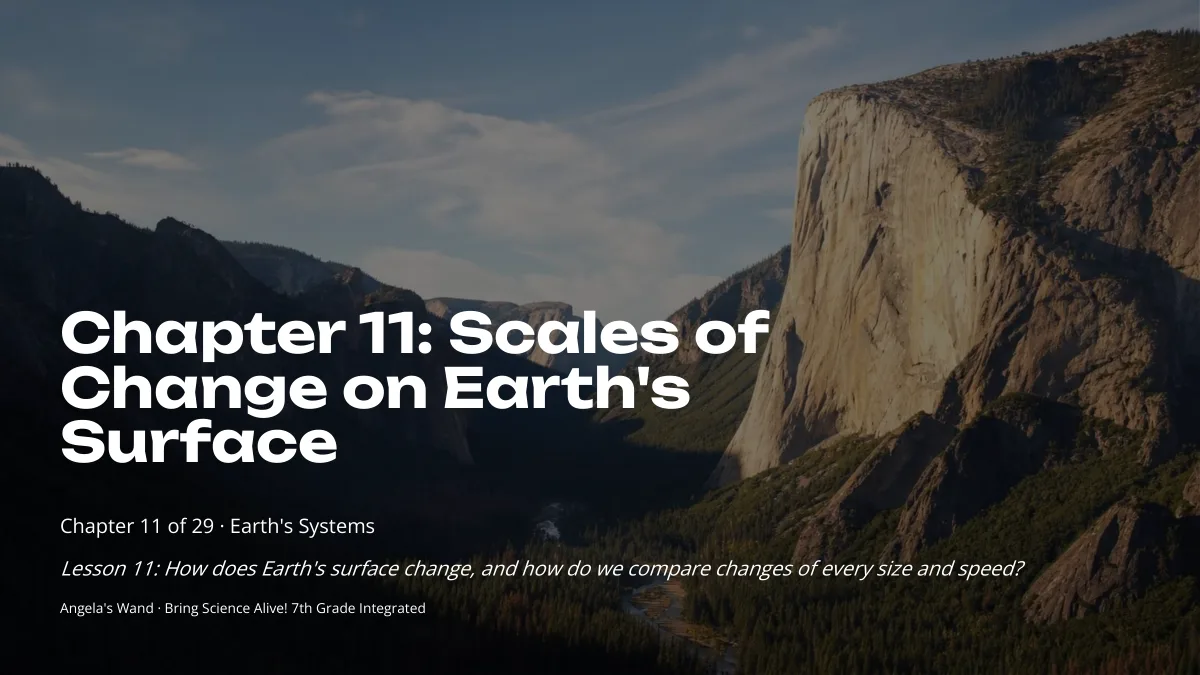
A granite cliff in Yosemite Valley looks exactly the way it does in photographs taken more than a hundred years ago. Then one afternoon a slab the size of a classroom peels off, drops to the valley floor in about ten seconds, shatters, and leaves a pale scar on the gray rock. Park geologists document dozens of these rockfalls in a typical year. Yet the valley itself, nearly a kilometer deep, was not made by rockfalls. It was carved by glaciers that filled it during several ice ages and melted away roughly fifteen thousand years ago. One change took seconds; the other took longer than humans have had writing. Both are still going on.

Notice and wonder prompts

  • If the cliff looked the same for a hundred years, was anything happening to it during that time?
  • What could weaken a slab of solid granite so slowly that nobody notices, then let go all at once?
  • How could ice, which moves slower than you can see, carve a valley hundreds of meters deep?
  • Which change was bigger, the rockfall or the carving of the valley? Which was faster? Do big and fast go together?

Learning targets

  • I can tell apart weathering, erosion, deposition and uplift and name the agents (water, ice, wind, gravity, living things, chemical reactions) that drive each one.
  • I can place a change to Earth's surface on a space scale (microscopic to global) and a time scale (seconds to billions of years) and explain why both scales are needed.
  • I can calculate a rate of change from measurements and use it to predict how long a large change takes or how far a small change adds up.
  • I can explain, using evidence, how gradual processes and sudden events together reshape a landscape, and why sudden events usually have slow-building causes.
  • I can use uniformitarianism to explain how scientists read a landscape's past, and I can state what the principle does and does not claim.

What shows the learning happened

  • A completed crystal-growth graph (Lab 1) with a calculated growth rate in millimeters per day and a reasoned estimate, with the calculation shown, of how long a one-meter crystal would take at that rate.
  • A written explanation of a fictional valley's history (Lab 2) that assigns each evidence card to a process, places it on space and time scales, and orders the slow and sudden events with justification.
  • A campus rate table (Lab 3) with at least two measured changes, each converted to a rate with units, and a prediction of how long a visible large change would take.
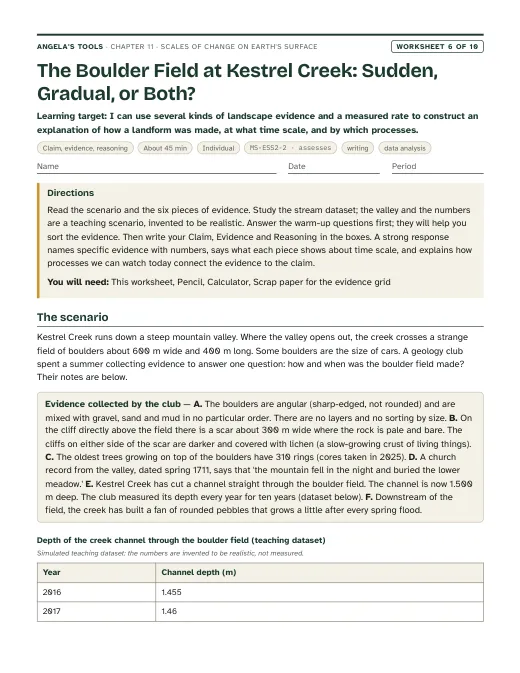
  • A Claim-Evidence-Reasoning paragraph (W6) explaining how both a ten-second rockfall and a fifteen-thousand-year glacier shaped the same valley.
  • A labeled model (W4) of a hoodoo's life from layered rock to toppled cap that marks which stages are slow and which are sudden.
  • A short answer that states what uniformitarianism claims (same kinds of processes, same laws) and what it does not claim (same rates, no sudden events).

Key vocabulary 12 terms

weatheringThe breaking down of rock where it sits, either into smaller pieces by physical forces (frost, grinding, roots) or into new substances by chemical reactions. Weathering loosens rock; it does not carry it away.Water froze in a crack each winter night, and after about two hundred freeze-thaw cycles the weathering had split the boulder in two.
erosionThe picking up and moving of loosened rock material by flowing water, wind, moving ice or gravity.The stream's erosion was easy to measure: the muddy water leaving the gully carried about two kilograms of sediment past the bridge every minute.
depositionThe settling and piling up of carried rock material in a new place when the water, wind or ice that moved it slows down or stops.Where the canyon opens onto the flat valley the stream slows, and deposition has built a fan of gravel more than a kilometer across.
upliftThe raising of a large area of Earth's crust by forces from deep inside the planet. Uplift is usually very slow, but during a large earthquake a patch of land can rise several meters in minutes.Uplift lifted this sea floor so slowly that the marine fossils in the cliff are now two thousand meters above the ocean.
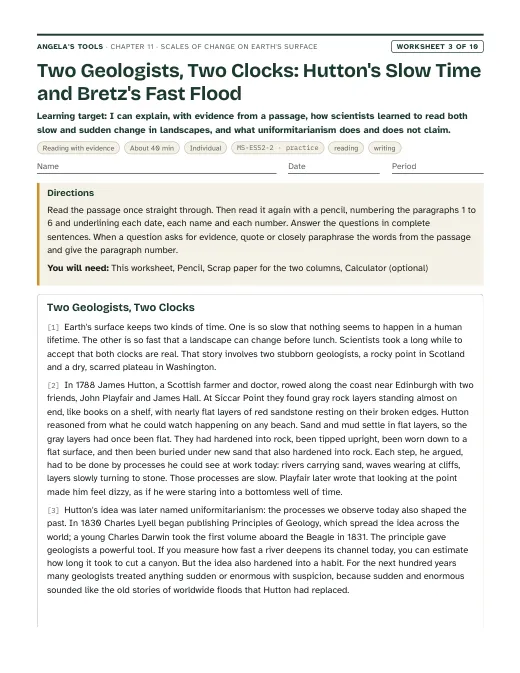
uniformitarianismThe principle that the kinds of natural processes we can observe today, following the same natural laws, also operated in the past and will operate in the future. It does not claim that every process always ran at the same speed, and it leaves room for sudden events.Using uniformitarianism, the geologist matched the ripple marks in the ancient sandstone to the ripples forming in a shallow stream today.
spatial scaleThe size range of the thing or change you are describing, from microscopic (too small to see) through human-sized to regional and global (the whole planet).At the spatial scale of one dune the wind's work is obvious, but at the scale of the whole sand sea you need a satellite to see it.
time scaleThe range of durations you are describing, from fractions of a second through years and centuries to millions and billions of years.On a time scale of minutes the hillside is stable; on a time scale of ten thousand years it has moved halfway to the river.
rate of changeHow much something changes divided by how long the change took, such as millimeters per year or centimeters per century. Rates let scientists compare slow and fast processes with numbers.A rate of change of three centimeters per year sounds tiny until you multiply by a million years and get thirty kilometers.
catastrophic eventA sudden, powerful event such as a landslide, flash flood, volcanic eruption or asteroid impact that reshapes part of Earth's surface in seconds to weeks. The conditions that make it possible usually build up over a much longer time.The catastrophic event lasted four minutes, but the fault had been storing strain for the hundred and fifty years since the previous earthquake.
chemical weatheringWeathering in which a chemical reaction changes or dissolves rock. Rainwater holding a little dissolved carbon dioxide is weakly acidic, and over long spans it dissolves limestone to open caves.Chemical weathering is why the limestone gravestone from 1850 is harder to read than the granite one beside it.
compaction and cementationTwo steps that turn loose sediment into rock: the weight of layers above squeezes the grains together (compaction), and minerals left behind by groundwater glue the grains to one another (cementation).Grains of the same sand are loose on the beach but, after compaction and cementation, hold together as sandstone in the cliff behind it.
hoodooA tall, thin pillar of rock, usually with a cap of tougher rock on top, left standing while weathering and erosion strip away the softer rock around it.Each hoodoo lasts only as long as its cap can protect the softer pillar underneath.

Standards alignment

California NGSS, Grade 7 Preferred Integrated Course Model. Each entry says whether this chapter's work assesses the performance expectation, gives practice toward it, or supports it as background; the resource lists below repeat this for every worksheet and lab.

MS-ESS2-2Assesses: constructing an evidence-based explanation of surface change at small and large, slow and fast scalesCA Grade 7

Construct an explanation based on evidence for how geoscience processes have changed Earth’s surface at varying time and spatial scales.

This is the lesson's own performance expectation. Lab 2 (the valley evidence mystery), Lab 3 (campus rates), W6 and W9 all require students to explain, with measurements or observations as evidence, how specific geoscience processes changed a surface and at what time and spatial scale, including gradual change punctuated by sudden events, which is the clarification statement in full.

MS-ESS2-1Supports: the weathering, sedimentation and crystallization pieces of the material cycleCA Grade 7

Develop a model to describe the cycling of Earth’s materials and the flow of energy that drives this process.

Weathering, deposition, compaction and cementation, and crystal growth from a cooling solution all appear here as surface processes with rates. Lesson 17 assembles them into the full rock cycle model; this chapter supplies the pieces and the sense of how long each takes.

Assessment boundary: Assessment does not include the identification and naming of minerals.

MS-ESS3-2Supports: background on sudden events as geoscience processesCA Grade 7

Analyze and interpret data on natural hazards to forecast future catastrophic events and inform the development of technologies to mitigate their effects.

Landslides, flash floods and eruptions appear here as fast changes whose conditions build slowly. Forecasting those hazards and designing mitigation, which is what MS-ESS3-2 assesses, belongs to Lessons 25 and 26; here students only learn why the events are sudden and what they do to the surface.

Science and engineering practices

  • Constructing Explanations and Designing Solutions. Students explain how a fictional valley got its features from evidence cards (Lab 2), how campus surfaces are changing from their own measurements (Lab 3), and how the Yosemite cliff and valley formed (W6 CER, W9).
  • Using Mathematics and Computational Thinking. Students compute rates in millimeters per day or per year (Lab 1, Lab 3, W5), convert between units, and multiply rates by long spans to predict large changes.
  • Analyzing and Interpreting Data. Students graph crystal growth over days (Lab 1), compare fast-cooled and slow-cooled crystals, and read a simulated dataset of rates to rank processes by speed (W5, presentation task).

Disciplinary core ideas

  • ESS2.A Earth Materials and Systems. Earth's systems interact at scales from microscopic to global and over fractions of a second to billions of years; many small, slow changes add up, and gradual change is punctuated by sudden events.
  • ESS2.C The Roles of Water in Earth's Surface Processes. Moving water, ice and weakly acidic groundwater weather and erode rock and build features such as valleys, fans and caves.

Crosscutting concepts

  • Scale, Proportion, and Quantity. Every process gets both a space and a time placement; students see why a chart of Earth processes needs axes that jump by factors of ten, and they use rates to move between human-scale measurements and geologic-scale results.
  • Stability and Change. Students explain why a landscape that looks stable is changing too slowly to notice, and why slow build-up ends in sudden change (a hoodoo topples, a fault slips).
  • Patterns. Look-alike hoodoos, arches and dune fields on different continents show the same processes acting in the same ways, which is the pattern behind uniformitarianism.

Presentation 26 slides

Scales of Change on Earth's Surface: two rulers for every change. Original, editable slides with speaker notes: a phenomenon opener, learning targets, the chapter's concepts with diagrams, vocabulary in context, 4 checks for understanding, 2 discussion prompts, an application task, a misconception check, a synthesis and an exit ticket.

Worksheets 10 of 10

Ten different tasks, one per instructional blueprint. Each has a student PDF (low ink, US Letter), an editable DOCX, an HTML preview, and a separate teacher answer key with reasoning.

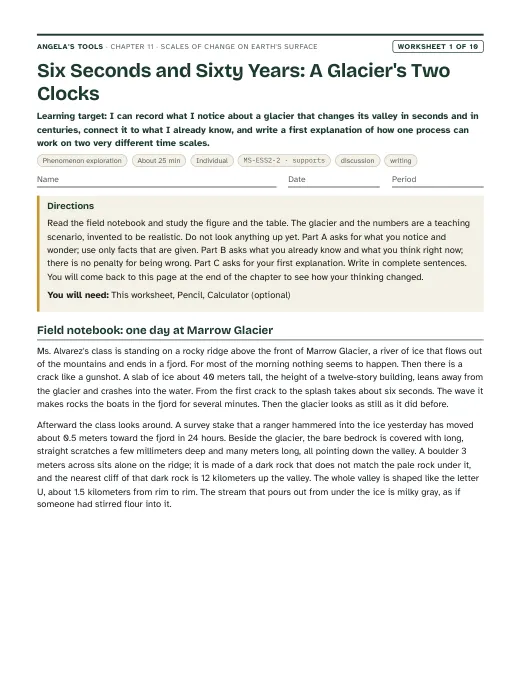
First page of Six Seconds and Sixty Years: A Glacier's Two Clocks
Worksheet 1 · Phenomenon exploration

Six Seconds and Sixty Years: A Glacier's Two Clocks

I can record what I notice about a glacier that changes its valley in seconds and in centuries, connect it to what I already know, and write a first explanation of how one process can work on two very different time scales.

25 minindividualActivates prior knowledgeDiscussionWriting MS-ESS2-2 · supports
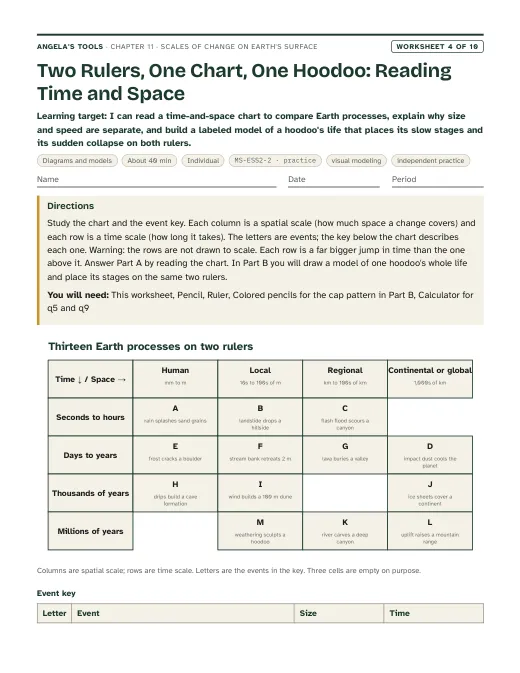
First page of Two Rulers, One Chart, One Hoodoo: Reading Time and Space
Worksheet 4 · Diagrams and models

Two Rulers, One Chart, One Hoodoo: Reading Time and Space

I can read a time-and-space chart to compare Earth processes, explain why size and speed are separate, and build a labeled model of a hoodoo's life that places its slow stages and its sudden collapse on both rulers.

40 minindividualBuilds understandingVisual modelingIndependent practice MS-ESS2-2 · practice
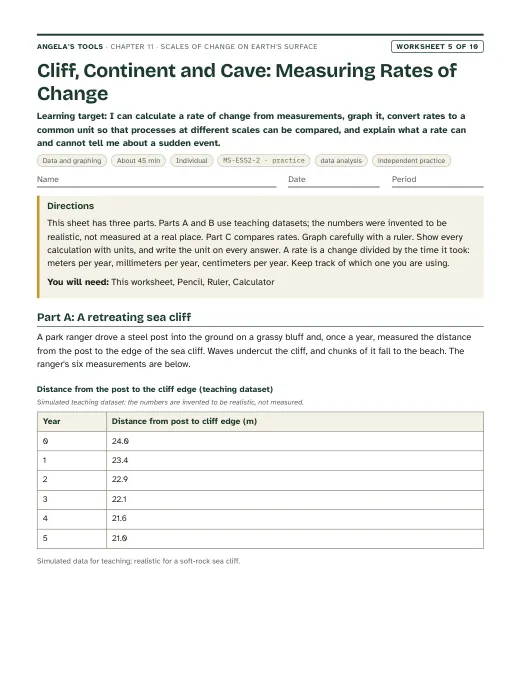
First page of Cliff, Continent and Cave: Measuring Rates of Change
Worksheet 5 · Data and graphing

Cliff, Continent and Cave: Measuring Rates of Change

I can calculate a rate of change from measurements, graph it, convert rates to a common unit so that processes at different scales can be compared, and explain what a rate can and cannot tell me about a sudden event.

45 minindividualPracticeData analysisIndependent practice MS-ESS2-2 · practice
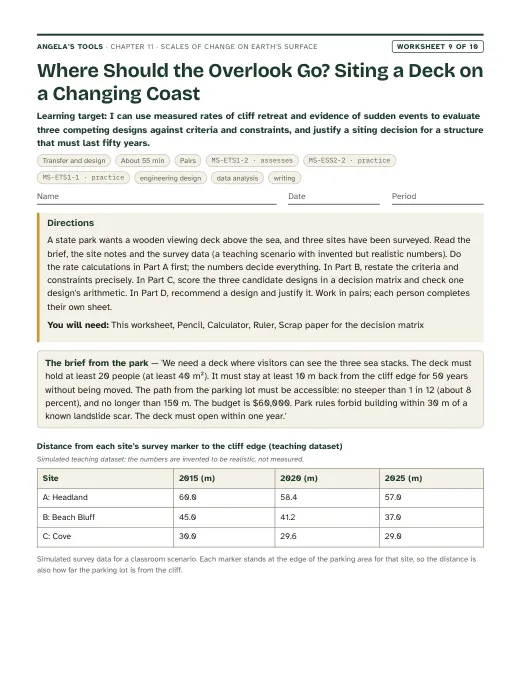
First page of Where Should the Overlook Go? Siting a Deck on a Changing Coast
Worksheet 9 · Transfer and design

Where Should the Overlook Go? Siting a Deck on a Changing Coast

I can use measured rates of cliff retreat and evidence of sudden events to evaluate three competing designs against criteria and constraints, and justify a siting decision for a structure that must last fifty years.

55 minpairsExtensionEngineering designData analysisWriting MS-ETS1-2 · assessesMS-ESS2-2 · practiceMS-ETS1-1 · practice

Collaborative labs 3 of 3

Three different investigation approaches. Each has a teacher guide (purpose, materials with quantities, estimated cost, prep, safety, procedure, expected observations, debrief, answer key, assessment criteria, accessibility adaptations, low-cost alternative) and a student recording sheet.

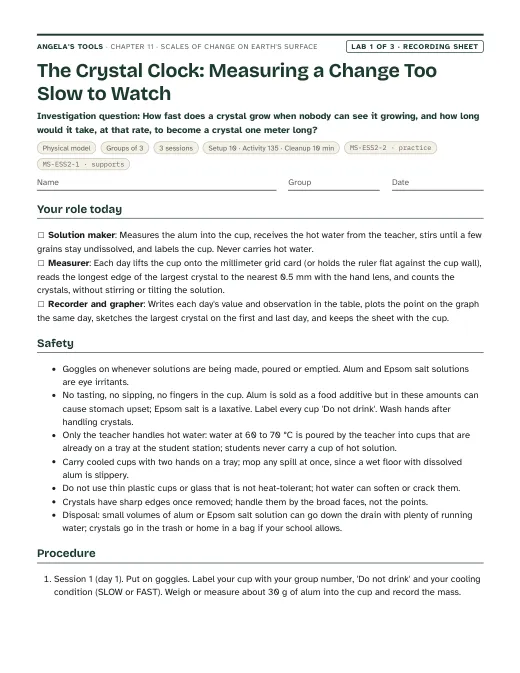
First page of the The Crystal Clock: Measuring a Change Too Slow to Watch recording sheet
Lab 1 · Physical model

The Crystal Clock: Measuring a Change Too Slow to Watch

How fast does a crystal grow when nobody can see it growing, and how long would it take, at that rate, to become a crystal one meter long?

Groups of 33 sessions135 min activityEst. 8 to 14 per classAlum (potassium aluminum sulfate), grocery spice aisleClear, sturdy heat-tolerant cup or small jar (glass jar or thick clear plastic deli cup)Hot tap water or kettle water at about 60 to 70 °C MS-ESS2-2 · practiceMS-ESS2-1 · supports
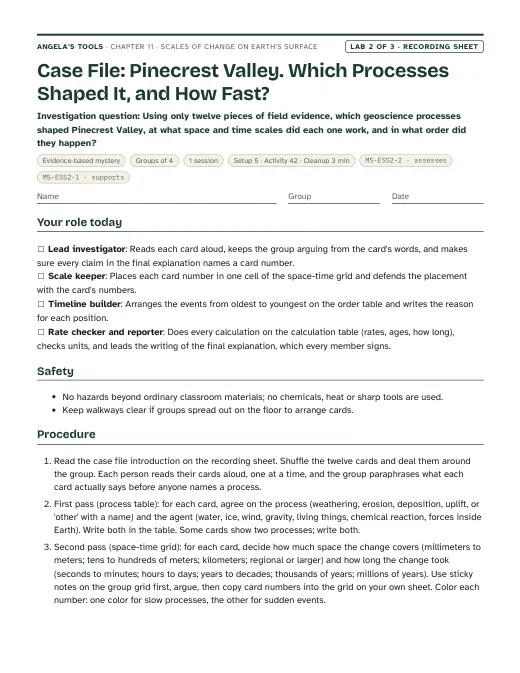
First page of the Case File: Pinecrest Valley. Which Processes Shaped It, and How Fast? recording sheet
Lab 2 · Evidence-based mystery

Case File: Pinecrest Valley. Which Processes Shaped It, and How Fast?

Using only twelve pieces of field evidence, which geoscience processes shaped Pinecrest Valley, at what space and time scales did each one work, and in what order did they happen?

Groups of 41 session42 min activityEst. 2 to 5 per classEvidence card set (12 cards printed from the recording sheet and cut apart)Recording sheet with the process table, space-time grid, calculation table, order table and explanation pageCalculator MS-ESS2-2 · assessesMS-ESS2-1 · supports
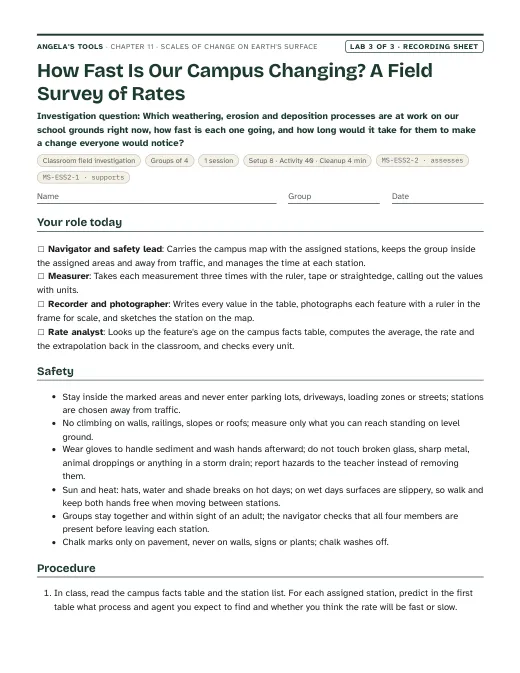
First page of the How Fast Is Our Campus Changing? A Field Survey of Rates recording sheet
Lab 3 · Classroom field investigation

How Fast Is Our Campus Changing? A Field Survey of Rates

Which weathering, erosion and deposition processes are at work on our school grounds right now, how fast is each one going, and how long would it take for them to make a change everyone would notice?

Groups of 41 session40 min activityEst. 3 to 10 per classRuler marked in millimetersTape measure (3 m or longer)Straightedge (a 30 cm ruler or a strip of stiff cardboard) to lay across worn surfaces MS-ESS2-2 · assessesMS-ESS2-1 · supports

Teacher guidance

Suggested sequence (7 steps)
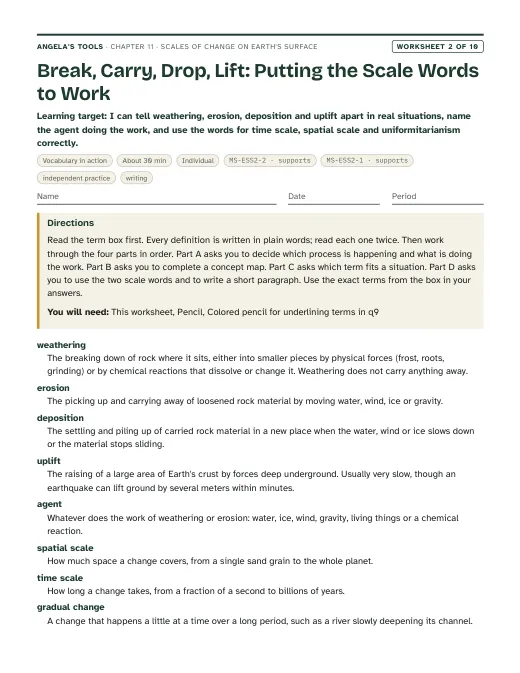
  1. Period 1: Presentation slides 1-8 (Yosemite phenomenon, targets, weathering, erosion, deposition, the sand grain's path, the agents of change). W1 phenomenon worksheet opens the period; W2 vocabulary relationships closes it.
  2. Period 2: Lab 1 session 1 (make the saturated solutions and set up the fast- and slow-cooling cups). Then slides 9-10 (space scale ladder, the 'can a change you cannot see build a dune?' discussion). W3 reading passage as homework.
  3. Period 3: Lab 1 session 2 at the start (choose and measure the largest crystal; daily 5-minute check-ins begin). Slides 11-16 (slow changes, uplift and rate vocabulary, the rate check, fast changes, the two-rulers chart, the big-and-fast check). W5 data worksheet on rates follows.
  4. Period 4: Lab 2, the valley evidence mystery (one session). Slide 17 (the San Andreas connection at Wallace Creek) fits at the end as a real version of the slow-sum, sudden-jolt pattern. W8 collaborative worksheet uses the same evidence-sorting skill if Lab 2 is skipped.
  5. Period 5: Lab 3, the campus field investigation of rates (one session outdoors; indoor abrasion alternative if the grounds or weather do not allow). W4 diagram worksheet on the hoodoo model can be homework.
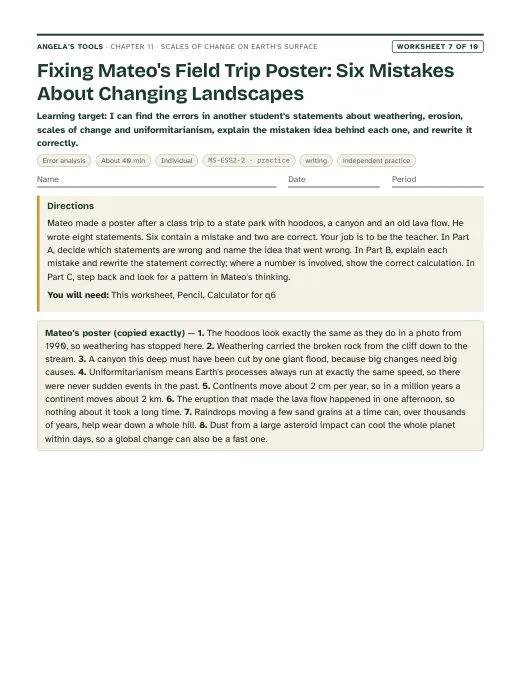
  6. Period 6: Lab 1 session 3 (final crystal measurement, graph, rate, extrapolation, fast-versus-slow cooling comparison). Slides 18-23 (rate detectives task, hoodoo patterns and model, the 'fifty years from now' discussion, uniformitarianism, the uniformitarianism check). W7 misconception repair.
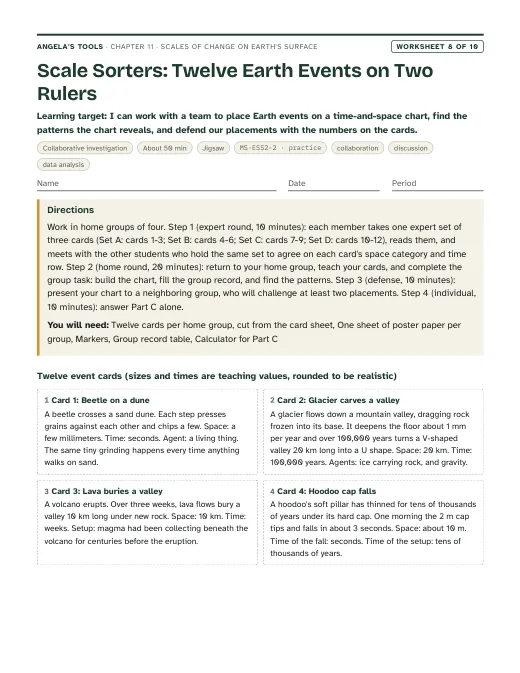
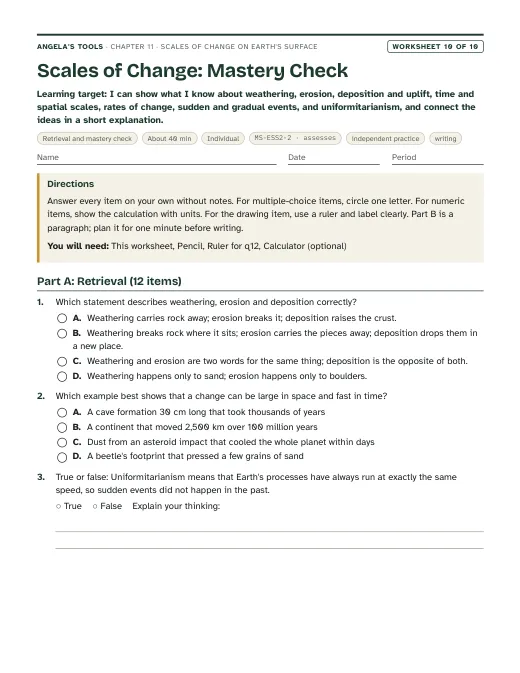
  7. Period 7: Slides 24-26 (misconception about the unchanging cliff, synthesis, exit ticket). W6 CER on the Yosemite evidence as the written assessment; W9 transfer task for students who finish early; W10 mastery as the quiz.

Materials overview: Lab 1 needs alum (potassium aluminum sulfate, sold in the grocery spice aisle) or Epsom salt, clear sturdy cups, hot water from a kettle that only the teacher handles, goggles, millimeter grid paper and rulers. Lab 2 needs only printed evidence cards, a printed space-time grid and the recording sheet. Lab 3 needs tape measures, millimeter rulers, a straightedge, chalk, a camera or phone for photographs, clipboards and access to the school grounds; the indoor alternative needs lidded jars, sidewalk chalk and aquarium gravel. No open flames anywhere in the chapter.

Common misconceptions (6)
“If a landscape looks the same from one year to the next, nothing is happening to it.”
Why it happens: Human senses work on a time scale of seconds to years, and most surface processes change things by fractions of a millimeter in that span.
Correction: The cliff, the hoodoo and the hillside are all changing; the change per year is simply smaller than the eye can detect. Measuring over decades, or multiplying a measured rate by thousands of years, reveals the change.
“Big features need big, sudden events, and small changes stay small.”
Why it happens: Dramatic events such as landslides and eruptions are the ones people see and film; slow accumulation is invisible in a lifetime.
Correction: Most of Earth's largest features, including canyons, sand seas and mountain ranges, are the sum of countless small changes over millions of years. A rate of a few centimeters a year becomes tens of kilometers over a million years.
“Fast changes are small and slow changes are large.”
Why it happens: Students pair the two scales in their heads because the familiar examples (a footprint is quick and small; a canyon is slow and big) happen to line up.
Correction: Space and time are separate rulers. Dust from a large asteroid impact cools the entire planet within days (fast and global); a cave formation only tens of centimeters long grows for thousands of years (slow and small).
“Uniformitarianism means everything on Earth has always happened at the same speed and nothing sudden ever happened.”
Why it happens: The word uniform suggests sameness, and the textbook's wording ('in the same way') can be read as 'at the same rate'.
Correction: The principle says the same kinds of processes, obeying the same natural laws, act across time. Rates can speed up or slow down (ice ages, wetter and drier climates), and sudden events such as impacts and giant floods are part of Earth's history.
“Weathering and erosion are the same thing.”
Why it happens: Both words describe rock being worn away, and everyday speech uses them loosely.
Correction: Weathering breaks rock apart where it is. Erosion carries the pieces away. A boulder can be weathered into gravel on a flat field with no erosion at all, and a river can erode already-loose sand with no new weathering.
“Sudden events come out of nowhere.”
Why it happens: The event itself (a landslide, a toppling hoodoo, an earthquake) takes seconds to minutes, so it seems causeless.
Correction: The conditions build slowly: weeks of rain soak a hillside, centuries of weathering thin a hoodoo's pillar, decades of plate motion store strain on a fault. The sudden event is the release of a slow build-up.
Differentiation suggestions (5)
  • Multilingual learners: Pre-teach the four process verbs as actions with gestures (break, carry, drop, lift) and post them with pictures; provide the two-rulers chart with the axis labels in the home language and English; pair students for Lab 2 so each evidence card is read aloud and paraphrased before it is placed.
  • Students who need more support: Give a rate-calculation frame (change ÷ time = rate; rate × time = change) with units pre-filled; supply the Lab 1 table with day numbers and the graph axes already scaled; reduce the Lab 2 card set to eight cards with the two clearest sudden events kept in.
  • Students ready for extension: Ask them to estimate how many freeze-thaw cycles a Bryce Canyon hoodoo has survived if the site averages about two hundred a year and the pillar is ten thousand years old, to research why the Grand Canyon's age is debated among geologists, or to design a rate measurement for their own neighborhood.
  • Students who need movement or alternative output: Run the time scale as a floor line across the room with students holding process cards and physically stepping to their position; let the Lab 2 explanation be recorded as a two-minute spoken 'geologist's report'; allow the hoodoo model (W4) to be built from stacked foam or clay instead of drawn.
  • Students with low vision or limited fine-motor control: Provide large-print evidence cards and a tactile scale strip with raised markers; in Lab 1 let a partner read the ruler while the student records and calls out the daily value; in Lab 3 assign the measuring role to a partner and the recording and rate-calculating role to the student.
Accuracy notes: where the textbook simplifies (17)
  • Uniformitarianism (pp. 141, 148, 149): the book says processes happened 'in the same way' in the past and act 'the same way everywhere'. Teach the modern version: the same kinds of processes and the same natural laws operate across time, but rates and intensities vary (ice ages, wetter or drier climates), and sudden catastrophic events are part of Earth's history. Never assess 'same rate'.
  • Stromatolites (p. 147): the Key Science Concept card calls them the remains of algae colonies. Stromatolites are layered mounds built by mats of cyanobacteria (microbes once called blue-green algae) trapping sediment. Also, the chart's 'billions of years' for this card is how old the oldest fossils are, not how long one took to form; keep stromatolites off any 'how long does this process take' task.
  • Continental motion (p. 144): the book gives 1 to 3 cm per year. Plates move at different speeds; the Australian plate moves about 7 cm per year, and seafloor spreading rates run from under 2.5 to over 15 cm per year. Say 'a few centimeters a year, about as fast as fingernails grow' and use a stated rate in any calculation.
  • Sandstone (p. 144): the book says the weight of overlying layers cements sand together. Weight compacts the grains; cementation happens when minerals carried by groundwater are deposited between the grains and glue them. Teach both steps by name.
  • Caves (p. 144): the book says a chemical reaction between water and limestone dissolves the rock. Add that the water is weakly acidic because it carries dissolved carbon dioxide (carbonic acid), which is why it can dissolve limestone. Cave passages widen by about a millimeter a year at most.
  • Eruption length (p. 145): the book says eruptions can last several weeks. Historic eruptions have lasted from under a day to decades or longer; a typical one is on the order of weeks. Treat 'weeks' as typical, not a rule.
  • Asteroids (p. 145): the book defines an asteroid as a mountain-sized chunk of rock. Asteroids range from a few meters to about 500 km across. Say 'a rocky body orbiting the Sun; the ones that leave big craters are kilometers across'.
  • Flash floods and landslides (p. 145): heavy rain over a short time is the usual cause of a flash flood, but so are a dam or levee failing and an ice or debris jam letting go. Earthquakes trigger landslides, not floods; the book's sentence linking both to 'unstable ground' fits landslides only.
  • Namib Desert (pp. 142-143): it lies along the southwest coast of Africa, mostly in Namibia, not 'western Africa'. Its tallest dunes are a little over 300 m (the book says 240 m). The 80,000 km² figure is close to the whole desert, which includes rocky plains; the sand sea itself is about 34,000 km². The 55-million-year figure is an estimate of the desert's age, not a measured age of the sand; individual dunes dated so far are thousands of years old.
  • Uplift timing (pp. 141, 144, 146): the lesson gives 100 million years, 'hundreds of millions of years' and 'about 30 million years' (Rockies) in different places. Say that uplift raises mountain ranges over millions to tens of millions of years, and do not assess a specific figure. Also, uplift is not always slow: in the 1964 Alaska earthquake land rose as much as about 11 m within a few minutes.
  • Eruption area (p. 147): the card says eruptions can add hundreds of thousands of km² of new material in days or months. Lava fields that large took hundreds of flows over about a million years. Ash fall can blanket tens of thousands of km² in hours (Mount St. Helens in 1980 covered more than 57,000 km² in about nine hours), so the claim fits ash, not lava.
  • Crystal timing (p. 147): the card says crystals several meters across form as magma cools over tens of millions of years. Growth times for giant crystals vary enormously and this figure could not be verified. Lab 1 uses the crystal as a model of slow, invisible growth that adds up, not as a measured geologic rate; the Naica cave's gypsum crystals, up to about 11 m long, are estimated to have grown over hundreds of thousands of years.
  • Hoodoos (p. 148): the book says hoodoos everywhere formed 'the same way'. The general recipe is shared (a tougher cap protects a softer pillar), but the details differ by site. At Bryce Canyon, frost wedging during about two hundred freeze-thaw cycles a year and weakly acidic rain do most of the work.
  • Grand Canyon (p. 146): the card gives about 5 million years for the canyon's formation. The age of the connected canyon is commonly placed at 5 to 6 million years, but some segments may be much older and geologists still debate it. Use the depth (about 1.6 km) with a stated age for any rate calculation, and say the age is an estimate.
  • The time-and-space chart (pp. 146-147): each step on the axes is a jump of many times the step before, so distances on the chart do not show true proportions of time or size. Point this out before students read placements from it.
  • Weathering by organisms (p. 142): the beetle grinding sand grains is physical weathering by abrasion. Living things also weather rock chemically (lichens, plant acids) and physically (roots). Both count.
  • Yosemite phenomenon: the valley was deepened by glaciers during several ice ages over roughly the last two million years; the last glacier to fill the valley melted back about fifteen thousand years ago. The park documents dozens of rockfalls in a typical year; the figure varies from year to year, so avoid quoting one exact number.

Review status: reviewed · 2026-10-19 · Re-solved every numeric and multiple-choice item in W1-W10, the three labs and the presentation (task, checks, exit ticket); all keys agreed with the independent solutions. W4 Part B rebuilt: it had students draw a second two-ruler chart, duplicating W8's card sort, and the chapter plan, slide 20 and evidenceOfLearning all describe W4 as the hoodoo model. Part B is now a four-stage hoodoo model with a rate item (0.4 mm/yr narrowing, 2,500 years) and keys; event L's size corrected to match its Continental column. W3 passage trimmed from 745 to about 695 words to meet the 450-700 limit; all quoted phrases used by the questions kept. W2 q7 prompt rewritten: it asked which measurement 'could describe both' and called the dune sentence 'neither', contradicting its own key. Lesson wording removed and rewritten in four places: the W10 q5 key sentence on the cap rock, the slide 22 motto bullet, the W8 card 11 asteroid sentence, and the W6 reasoning prompt and key sentence on past processes. Lab 2 valley length changed from 25 km to 45 km so the pink granite source 40 km up-valley is inside the valley; W8 card 5 made internally consistent (about 1 mm/yr at most; at least 2,000 years). caGrade added to the labs' standards entries. Wallace Creek figures match the published Sieh and Jahns survey values (about 130 m, about 34 mm/yr, about 9.5 m in 1857); still confirm against a current USGS page before testing them. Labs remain untested physically; see each lab's modelLimitations.

Source references

Verified against the student edition of Bring Science Alive! 7th Grade Integrated (Student Edition). Printed page numbers appear in the book; PDF pages are the physical pages of the 524-page scan (printed + 36). The textbook is not reproduced on this site.

SectionPrinted pagesPDF pagesUsed for
Introduction: the mountain landscape, lesson question and vocabulary box140, 141176, 177Essential question, the five vocabulary terms, the publisher's standards box (MS-ESS2-2, Scale, Stability and Change).
1. Small and Large Changes on Earth's Surface: the beetle, the Namib dunes, systems interacting142, 143178, 179Weathering, erosion and deposition definitions, the small-to-large space ladder, the 'many small changes add up' idea, the dune-field connection to Earth's systems.
2. Slow and Fast Changes on Earth's Surface: plates, uplift, sandstone, caves, eruptions, impacts, floods, landslides144, 145180, 181Slow processes and their rates, sudden events and their slow-building causes, compaction and cementation, chemical weathering of limestone.
Key Science Concept: Earth Processes at Different Scales of Time and Space146, 147182, 183The two-rulers chart, the idea of the human scale, the process placements used in the two-rulers diagram and the rate-detectives task.
3. Patterns of Change: hoodoos, arches and uniformitarianism148, 149184, 185Hoodoo formation and collapse, the pattern argument for uniformitarianism, the stable-looking landscape idea.
Lesson Summary149185Checking that every big idea of the lesson appears in the synthesis slide and the chapter overview.

External references used for accuracy checks

Related chapters