Chapter 22 · Unit 7: Resources in Ecosystems · Segment 3

Changing Ecosystems

How do ecosystems change over time, and how can we use evidence to argue that a change to one part of an ecosystem affects the populations living there?

MS-LS2-4 · assessesMS-ETS1-1 · practiceMS-ETS1-2 · practiceMS-LS2-1 · supports Textbook pp. 284–293 1 presentation · 10 worksheets · 3 labs

Overview

Students figure out that every ecosystem is a dynamic system that is always changing, sometimes over centuries as a pond fills in and sometimes in minutes when a volcano erupts, and that living things rebuild a damaged place through ecological succession. They use the 1980 eruption of Mount St. Helens and its decades of recovery as an anchor, then trace how changing one living part (a prairie dog town) or one nonliving part (a beaver dam, river sediment) shifts resources and sends ripples through many other populations. The core skill is argument from evidence: students learn to compare places with and without a change, read before-and-after data, and decide which claims the evidence actually supports. The chapter closes with the engineering strand, where criteria and constraints shape how engineers rebuild coastal wetlands.

Estimated class time: presentation about 140 minutes · worksheets about 425 minutes in total · labs 4 sessions. Eight 50-minute periods: one for the phenomenon and dynamic systems; one for succession and the Lab 1 mystery; one for the Lab 1 reveal, living-part changes and the reading; one for the Lab 2 string web; one for nonliving-part changes and the data worksheet; two for Lab 3 (field day and data day); and one for the argument checklist, the engineering strand and the closing slides. W2, W3, W6 and W7 work as homework; W8 and W9 can run as extension days or stations; W10 is the quiz.

Phenomenon

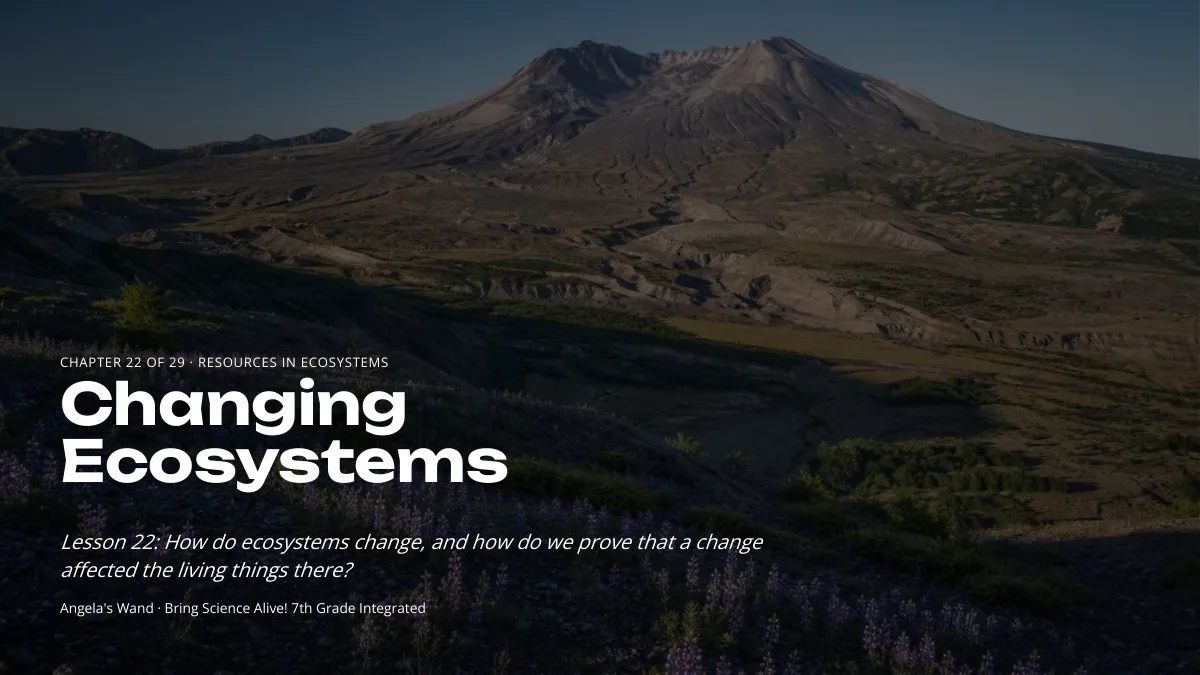
The mountain that blew its top and grew back green

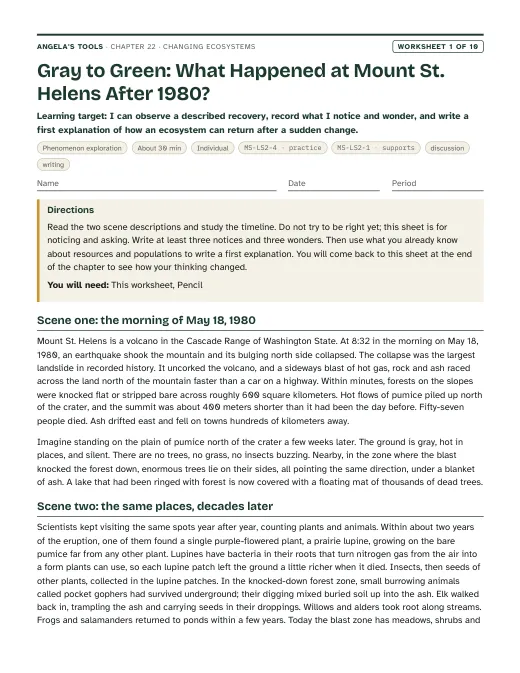
On the morning of May 18, 1980, the north side of Mount St. Helens in Washington State collapsed in the largest landslide ever recorded. A sideways blast of hot gas and rock flattened or scorched forests across roughly 600 square kilometers, and flows of hot pumice buried the valley north of the crater under a bare gray plain. Photographs from that summer show a landscape that looks like another planet: no trees, no grass, no visible animals. Photographs of the same valley forty years later show meadows of purple lupine, thickets of willow and alder, herds of elk, and ponds full of frogs. No one planted the plain; it was left to recover on its own. How did life come back, where did it come from, and why is the new ecosystem still not the old forest?

Notice and wonder prompts

  • What do you notice is different between the 1980 photograph and the recent one? What looks the same?
  • Where could the first plants have come from if the ground was buried under hot pumice?
  • Which do you think arrived first: plants, insects, or large animals like elk? Why?
  • Will this valley ever look exactly like it did before 1980? What would convince you either way?

Learning targets

  • I can describe gradual and sudden changes to ecosystems and explain why every ecosystem is a dynamic system.
  • I can explain how ecological succession rebuilds a community on bare ground or after a disturbance, and tell primary succession from secondary succession.
  • I can trace how a change to a living part or a nonliving part of an ecosystem changes resources and shifts other populations, including cascading effects from a keystone species.
  • I can construct an argument from empirical evidence, such as with-and-without comparisons and before-and-after data, that a change to an ecosystem affected populations.
  • I can identify criteria and constraints that shape an engineering solution for restoring a damaged ecosystem.

What shows the learning happened

  • A sequenced succession timeline for two zones of Mount St. Helens (Lab 1), with every placement justified by a field-note card, a rate comparison from plant-cover data, and an explanation of why primary succession on the pumice plain is slower than secondary succession in the blowdown zone.
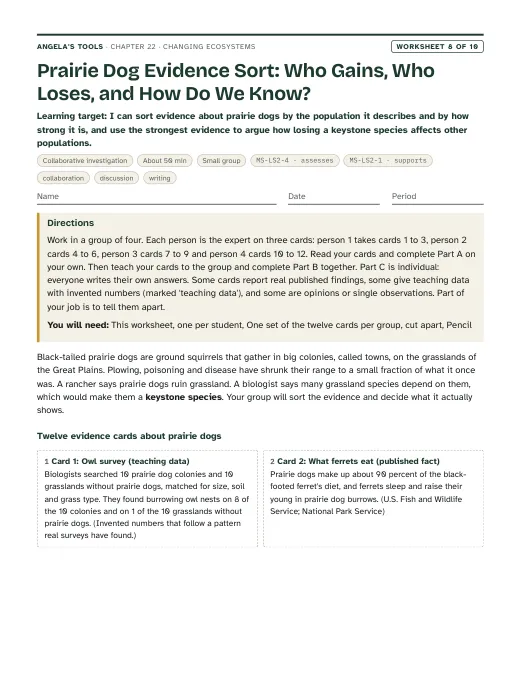
  • A completed trial table and bar graph (Lab 2) showing how many populations changed when each part of a prairie web was removed or weakened, with the keystone species identified from the counts and an argument from real burrowing owl survey data.
  • A pooled class comparison of walked-on and rarely walked-on campus plots (Lab 3) with class means, two bar graphs, and an argument that trampling changed a soil condition and the populations living there.
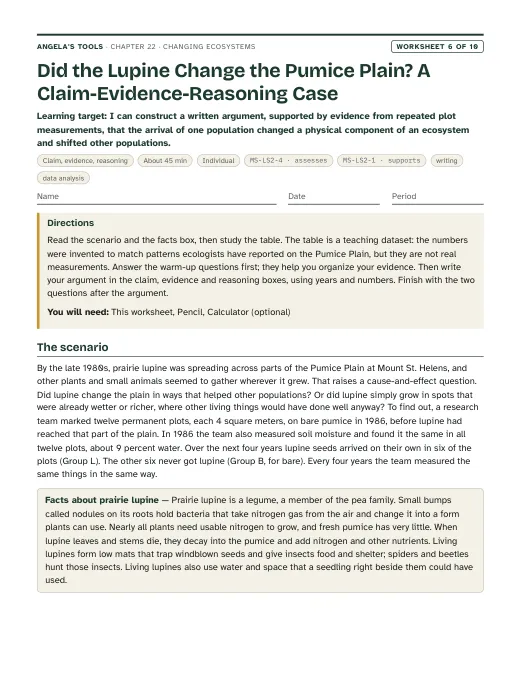
  • A Claim-Evidence-Reasoning paragraph (W6) arguing from plots with and without lupine that a pioneer's arrival changed soil nitrogen and other populations on the pumice plain.
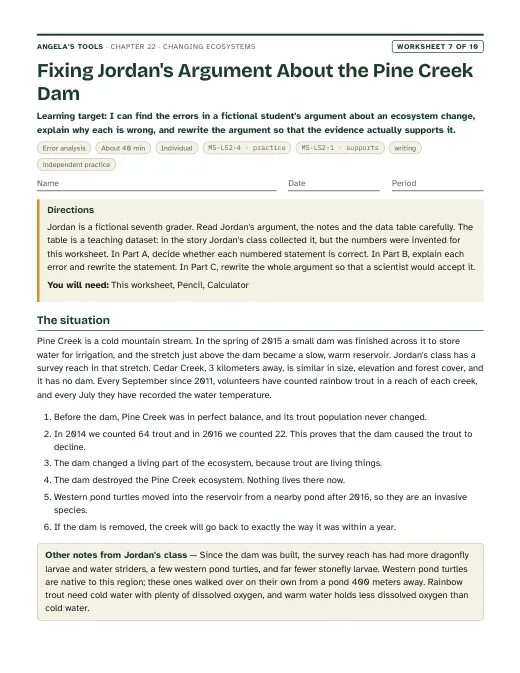
  • A corrected version of a fictional student's argument about a creek dam (W7) that separates a pattern from a cause and adds the missing comparison creek.
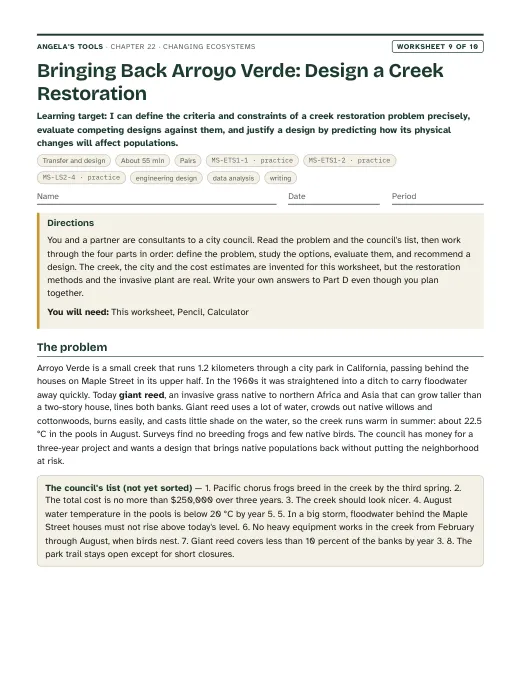
  • A creek restoration recommendation (W9) that sorts criteria from constraints, makes a vague criterion measurable, meets every constraint, and plans how to collect evidence of population change.

Key vocabulary 12 terms

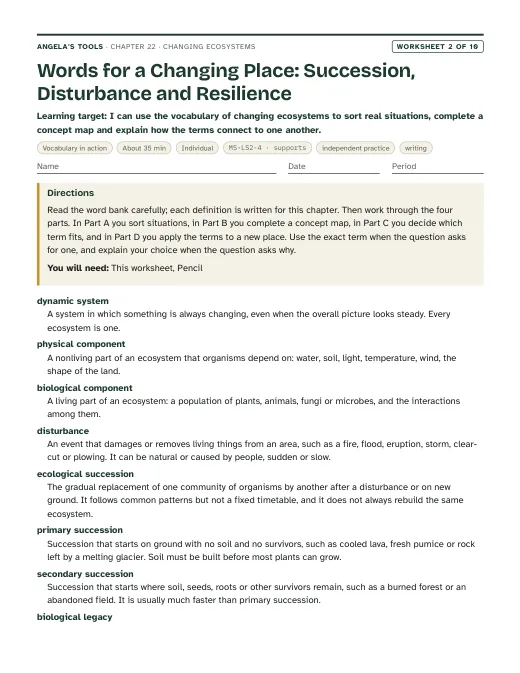
dynamic systemA system whose parts are always changing, whether the change is slow or fast, small or large. Every ecosystem is one, because its living things, water, soil and climate never stay fixed.Because a pond is a dynamic system, a study that counts its frogs only once cannot tell whether the population is rising or falling.
disturbanceAn event that damages or removes living things from part of an ecosystem and changes the resources there. Fires, floods, eruptions, storms, logging and land clearing are disturbances.Ecologists call the 1980 eruption a disturbance because it removed the forest and reset the valley to bare ground.
ecological successionThe gradual replacement of one community of organisms by another as living things change the conditions of a place. Early arrivals make soil, shade and shelter that let later arrivals move in.Succession on the pumice plain has moved from scattered lupine patches to meadows and willow thickets over four decades.
primary successionSuccession that starts on brand-new ground with no soil, such as cooled lava, fresh pumice, or gravel left behind by a melting glacier.Primary succession is slow because the first plants must survive without soil and then build it as they live and die.
secondary successionSuccession that starts after a disturbance that leaves soil behind, often with roots, seeds and buried animals still alive. It is usually much faster than primary succession.A hillside burned by a wildfire goes through secondary succession because the soil and many seeds survive the fire.
pioneer speciesA hardy organism, such as a lichen, moss, lupine or fireweed, that can settle bare or damaged ground first and begin to improve conditions for the species that follow.Prairie lupine acted as a pioneer species on the pumice plain because it can grow in nutrient-poor volcanic ash.
biological legacyLiving things or their remains that survive a disturbance in place, such as buried seeds, roots, fungi, logs, or animals in burrows, and give recovery a head start.Pocket gophers that survived the blast in their burrows were a biological legacy; their digging mixed buried soil up into the ash.
keystone speciesA species whose presence shapes the ecosystem far more than its numbers suggest, because many other species depend on what it does. Removing it can change the whole community.Prairie dogs are a keystone species on the Great Plains: their burrows shelter owls and snakes and their digging changes the soil.
cascading changeA chain of effects in which a change to one population alters resources for a second population, which then alters a third, and so on through the food web.When sea otters disappeared from a kelp forest, the sea urchins they ate multiplied, and the urchins then ate the kelp, a cascading change through three levels.
resilienceThe ability of an ecosystem to absorb a disturbance and recover its main populations and functions, rather than switching permanently to a different kind of ecosystem.A grassland that regrows the same grasses within two years of a fire shows high resilience.
invasive speciesA species that people moved, on purpose or by accident, into a region where it did not live before, and that spreads there and harms native populations or the way the ecosystem works.Water hyacinth is an invasive species in the Sacramento-San Joaquin Delta, where its floating mats shade out native plants.
empirical evidenceInformation gathered by observing or measuring the real world, such as population counts, photographs taken over time, or comparisons between similar places that differ in one way.Counting owls in ten grasslands with prairie dogs and ten without gives empirical evidence about whether the two species are linked.

Standards alignment

California NGSS, Grade 7 Preferred Integrated Course Model. Each entry says whether this chapter's work assesses the performance expectation, gives practice toward it, or supports it as background; the resource lists below repeat this for every worksheet and lab.

MS-LS2-4Assesses: the full PE: constructing an argument supported by empirical evidence that a change to a physical or biological component affects populationsCA Grade 7

Construct an argument supported by empirical evidence that changes to physical or biological components of an ecosystem affect populations.

This is the chapter's performance expectation. Students construct arguments supported by empirical evidence in Lab 3 (their own pooled disturbed-versus-undisturbed plot data), the Lab 2 closing argument (real survey counts of burrowing owls on active and inactive prairie dog colonies), W6 (a CER from with-and-without and before-and-after plot data), the W8 individual argument from published prairie dog findings, and W10 items 9 and 12. W5 and the slide 20 task practice reading the same kinds of data, and Lab 1 and the Lab 2 string-web trials practice the reasoning with observation cards and a model before students use measured data.

MS-ETS1-1Practice toward: identifying criteria and constraints of an environmental design problemCA Grade 6-8

Define the criteria and constraints of a design problem with sufficient precision to ensure a successful solution, taking into account relevant scientific principles and potential impacts on people and the natural environment that may limit possible solutions.

The lesson's engineering spread shows how criteria and constraints shaped two different wetland-rebuilding designs in Louisiana. Students identify criteria and constraints in the W9 transfer task and the slide 25 discussion, but they do not define a full design problem with precision, so the role is practice rather than assesses.

MS-ETS1-2Practice toward: evaluating given design options against criteria and constraints with a decision matrixCA Grade 6-8

Evaluate competing design solutions using a systematic process to determine how well they meet the criteria and constraints of the problem.

In W9 students evaluate five creek-restoration options and one combination systematically, eliminating any that break a constraint before scoring the rest against the criteria. The options and cost estimates are supplied rather than designed by students, so the role is practice. The slide 24 comparison of two Louisiana wetland designs previews the same reasoning.

MS-LS2-1Supports: resource availability as the link between an ecosystem change and a population changeCA Grade 7

Analyze and interpret data to provide evidence for the effects of resource availability on organisms and populations of organisms in an ecosystem.

Every cascading change in this chapter runs through resources: a beaver dam changes water depth and light, prairie dogs change shelter and soil, and succession changes soil and shade. Students use the resource-population relationship from Lesson 20 as background rather than producing new evidence for it.

Science and engineering practices

  • Engaging in Argument from Evidence. Students write claims about population change and back them with data they collected in the field (Lab 3), real survey counts (Lab 2) or teaching datasets (slide 20 task, W5, W6), and they repair a fictional student's weak argument in W7 and the misconception slide.
  • Analyzing and Interpreting Data. Students read before-and-after bar data, with-and-without comparison tables and their own plot counts, looking for patterns that repeat across sites rather than single observations (W5, Lab 3).
  • Developing and Using Models. Students build a string-web model of a shortgrass prairie (Lab 2), use it to count how many populations change when one species is removed or the soil water is weakened, and then test one prediction against real burrowing owl survey data to see what the model leaves out.
  • Asking Questions and Defining Problems. Students identify the criteria and constraints behind two wetland-restoration designs and propose their own for a local restoration problem (W9, slide 25).

Disciplinary core ideas

  • LS2.C Ecosystem Dynamics, Functioning, and Resilience. Ecosystems are dynamic; their characteristics vary over time; a disruption to any physical or biological component can shift all of its populations. Succession, keystone effects and cascading change are the mechanisms students trace.
  • LS2.A Interdependent Relationships in Ecosystems. Populations are linked by food, shelter and other resources, so a change in one population or resource travels along those links to others (prairie dogs, beavers, otters and urchins).
  • ETS1.A Defining and Delimiting Engineering Problems. The wetland-rebuilding spread shows that the more precisely criteria and constraints are stated, the more likely the design works for its specific place.
  • ETS1.B Developing Possible Solutions. In W9 students use a decision matrix, a systematic process, to judge how well five restoration options and one combination meet the criteria and constraints, checking constraints first.

Crosscutting concepts

  • Stability and Change. Students contrast gradual change (pond to forest) with sudden change (eruption), explain why a small change in one part of a system can cause large changes elsewhere, and describe resilience as a kind of stability that includes recovery.
  • Cause and Effect. Students distinguish a pattern in data (owls are rarer where prairie dogs are absent) from a causal explanation (burrows provide shelter) and design comparisons that keep other factors alike.
  • Systems and System Models. The string-web lab makes the links between populations visible and lets students test what happens when one node is removed, while also naming what the model cannot show.

Presentation 28 slides

Changing Ecosystems: how a damaged place stages its comeback. Original, editable slides with speaker notes: a phenomenon opener, learning targets, the chapter's concepts with diagrams, vocabulary in context, 3 checks for understanding, 2 discussion prompts, an application task, a misconception check, a synthesis and an exit ticket.

Worksheets 10 of 10

Ten different tasks, one per instructional blueprint. Each has a student PDF (low ink, US Letter), an editable DOCX, an HTML preview, and a separate teacher answer key with reasoning.

First page of Bringing Back Arroyo Verde: Design a Creek Restoration
Worksheet 9 · Transfer and design

Bringing Back Arroyo Verde: Design a Creek Restoration

I can define the criteria and constraints of a creek restoration problem precisely, evaluate competing designs against them, and justify a design by predicting how its physical changes will affect populations.

55 minpairsExtensionEngineering designData analysisWriting MS-ETS1-1 · practiceMS-ETS1-2 · practiceMS-LS2-4 · practice

Collaborative labs 3 of 3

Three different investigation approaches. Each has a teacher guide (purpose, materials with quantities, estimated cost, prep, safety, procedure, expected observations, debrief, answer key, assessment criteria, accessibility adaptations, low-cost alternative) and a student recording sheet.

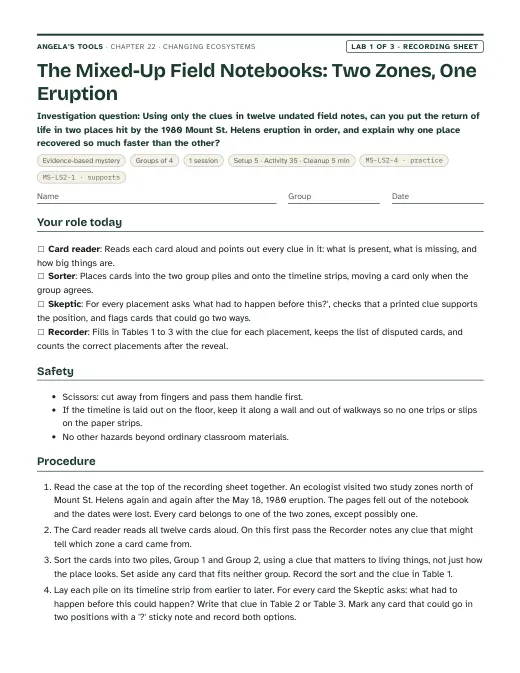
First page of the The Mixed-Up Field Notebooks: Two Zones, One Eruption recording sheet
Lab 1 · Evidence-based mystery

The Mixed-Up Field Notebooks: Two Zones, One Eruption

Using only the clues in twelve undated field notes, can you put the return of life in two places hit by the 1980 Mount St. Helens eruption in order, and explain why one place recovered so much faster than the other?

Groups of 41 session35 min activityEst. 3 to 6 per classField-note card set (12 cards from the recording sheet) printed on cardstock and cut apartTimeline strips about 1 m long (adding-machine tape or sentence strips) marked 'earlier' at one end and 'later' at the otherSmall sticky notes MS-LS2-4 · practiceMS-LS2-1 · supports
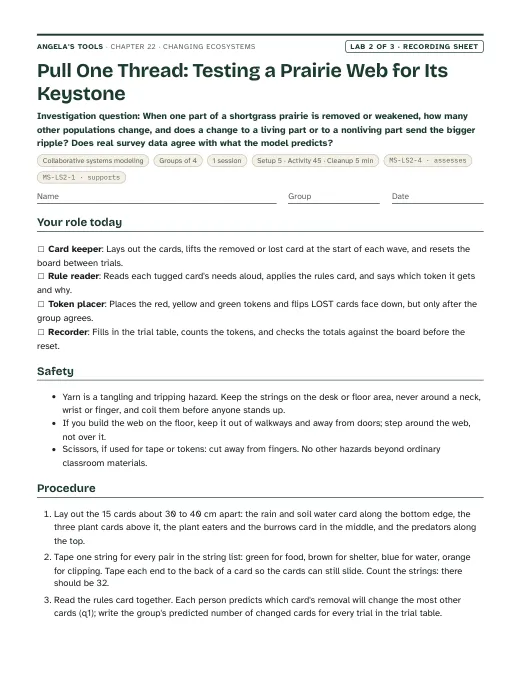
First page of the Pull One Thread: Testing a Prairie Web for Its Keystone recording sheet
Lab 2 · Collaborative systems modeling

Pull One Thread: Testing a Prairie Web for Its Keystone

When one part of a shortgrass prairie is removed or weakened, how many other populations change, and does a change to a living part or to a nonliving part send the bigger ripple? Does real survey data agree with what the model predicts?

Groups of 41 session45 min activityEst. 8 to 14 per classPrairie web card set (15 cards from the recording sheet) printed on cardstock and cut apartYarn pre-cut into 50 cm lengths: green (food), brown (shelter), blue (water) and orange (clipping)Masking tape MS-LS2-4 · assessesMS-LS2-1 · supports
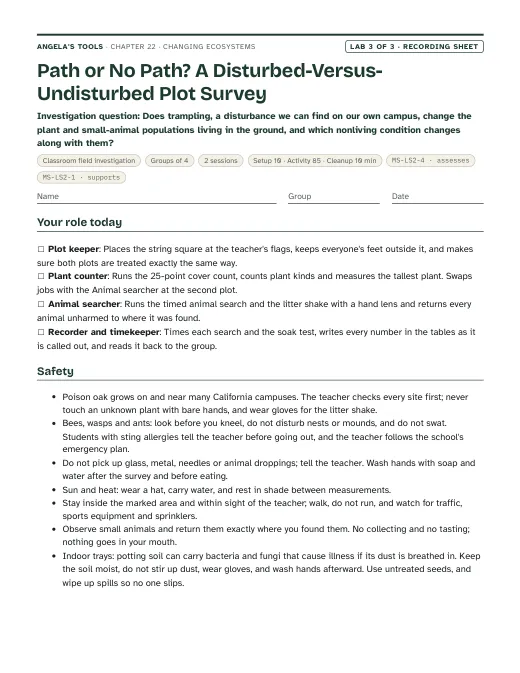
First page of the Path or No Path? A Disturbed-Versus-Undisturbed Plot Survey recording sheet
Lab 3 · Classroom field investigation

Path or No Path? A Disturbed-Versus-Undisturbed Plot Survey

Does trampling, a disturbance we can find on our own campus, change the plant and small-animal populations living in the ground, and which nonliving condition changes along with them?

Groups of 42 sessions85 min activityEst. 10 to 20 per class for the field version; add 15 to 25 for the indoor traysString square: 2.1 m of string knotted into a loop and marked every 50 cm, plus 4 small stones or bean bags to hold the cornersMeter stick or 50 cm rulerHand lens MS-LS2-4 · assessesMS-LS2-1 · supports

Teacher guidance

Suggested sequence (8 steps)
  1. Period 1: Slides 1-7 (Mount St. Helens phenomenon, targets, dynamic systems, gradual and sudden change, first check). W1 phenomenon worksheet in class; W2 vocabulary for homework.
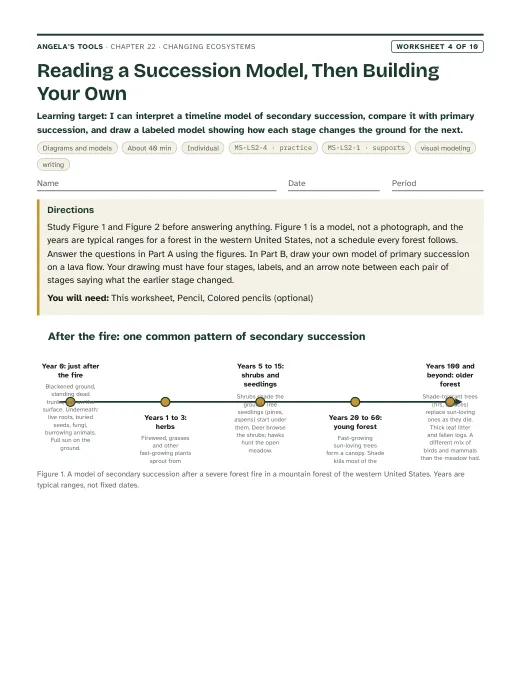
  2. Period 2: Slides 8-10 (succession, primary versus secondary, biological legacies), then Lab 1, the field-notebook sequencing mystery (sort, sequence, reveal, graph). Hold slide 11 until after the reveal; Lab 1 analysis questions for homework.
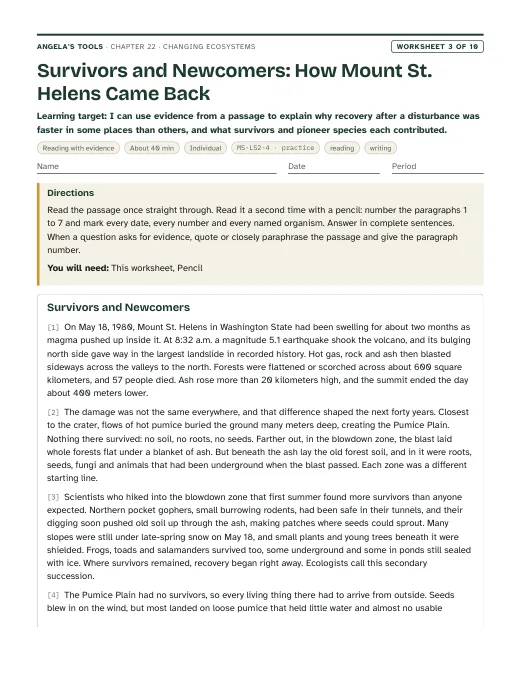
  3. Period 3: Slides 11-12 as the Lab 1 debrief, then slides 13-16 (prairie dogs, keystone species, the good-or-bad discussion). W3 reading passage on the Mount St. Helens recovery, finished at home; W4 diagram worksheet as a follow-up.
  4. Period 4: Lab 2, the prairie string web: build it, run four trials (prairie dogs, bison, grasshoppers, drought), then test the owl prediction against real survey data.
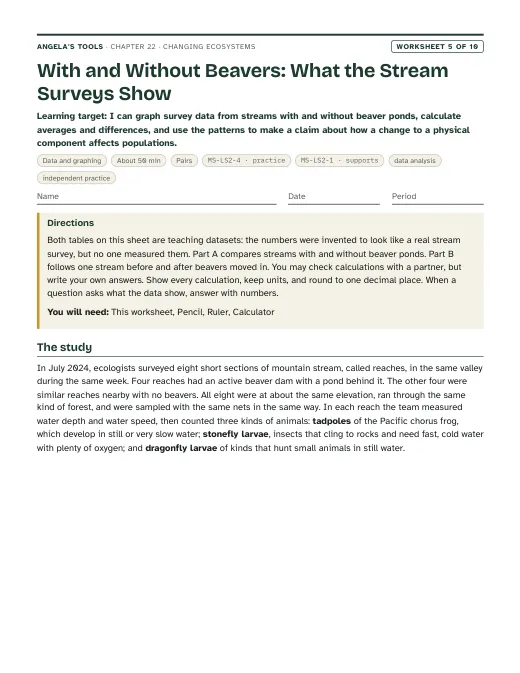
  5. Period 5: Slides 17-19 (beaver dams, the cascading-change chain, which-part-changed check) and W5, the beaver stream data worksheet. Brief students on Lab 3 and check allergy information.
  6. Period 6: Lab 3 session 1, the walked-on versus rarely walked-on campus plot survey (or the indoor tray alternative).
  7. Period 7: Lab 3 session 2 (pool class data, graph, argue), then slides 20-22 (marsh evidence task, kelp forest connection, what makes an argument strong). W7 misconception repair (Jordan's dam argument) for homework.
  8. Period 8: Slides 23-28 (invasive species, criteria and constraints, the creek discussion, misconception, synthesis, exit). W6 CER on the lupine plots as homework (students who miss exit question 3 revisit their W7 corrections first); W8 prairie dog evidence sort and W9 creek restoration design as extension days or stations; W10 mastery as the quiz.

Materials overview: No chemicals and no heat. Lab 1 uses printed field-note cards, timeline strips and sticky notes. Lab 2 uses printed web cards, pre-cut yarn in four colors, masking tape and paper tokens. Lab 3 uses string squares, a meter stick, hand lenses, paper plates, bottomless plastic cups, water, a timer and gloves; the indoor alternative needs four shallow trays, potting soil and untreated fast-growing seeds started ten to fourteen days ahead. Printed before-and-after photographs of Mount St. Helens (public domain from the U.S. Geological Survey) make the phenomenon vivid.

Common misconceptions (5)
“A healthy ecosystem stays the same; change means something has gone wrong.”
Why it happens: Nature documentaries and park signs present ecosystems as finished scenery, and students rarely watch one place long enough to see it change.
Correction: Every ecosystem is a dynamic system. Ponds fill in, forests burn and regrow, and populations rise and fall with resources. Change is normal; the questions are how fast, caused by what, and whether the system can recover.
“A big disturbance like an eruption kills everything, so recovery has to start from zero with life arriving from far away.”
Why it happens: The textbook says an eruption can kill all living things in an area, and the 1980 photographs of Mount St. Helens look lifeless.
Correction: Even the 1980 blast left survivors: pocket gophers in burrows, plants under late snowbanks, seeds and fungi in the soil, and amphibians in lakes. These biological legacies, plus new arrivals carried by wind and animals, both drive recovery. Where soil and survivors remained (secondary succession) recovery was much faster than on the bare pumice (primary succession).
“Succession runs on a fixed schedule toward one final ecosystem, and it always rebuilds what was there before.”
Why it happens: Textbook figures label stages with tidy year numbers, and the word 'predictable' suggests a timetable.
Correction: Succession follows broad patterns, not a clock. Its pace depends on climate, soil, survivors and chance, and the community that develops can differ from the one before the disturbance. The textbook's own text admits the recovered ecosystem is sometimes different.
“If two things change together, one must have caused the other, so a single before-and-after observation is proof.”
Why it happens: A pattern feels like an explanation, and students have not yet practiced asking what else changed at the same time.
Correction: A before-and-after graph shows what changed, not why. Scientists strengthen an argument by comparing many sites with and without the change, by keeping other conditions similar, and by proposing a mechanism (such as burrows providing shelter) that can be tested.
“A species that helps some populations is simply 'good' for the ecosystem, and one that harms some is 'bad'.”
Why it happens: Students want a single verdict, and the prairie dog story is usually told from the side of the species that benefit.
Correction: Most changes help some populations and hurt others. Prairie dogs shelter owls and ferrets but clip back shrubs that other animals use. Beaver ponds create habitat for pond species and remove it for fast-water species. Scientists describe the direction of each effect rather than giving the species a grade.
Differentiation suggestions (5)
  • Multilingual learners: Pre-teach disturbance, succession, pioneer, keystone and evidence with a photo card set (eruption, lupine, prairie dog, beaver dam); pair the Lab 1 evidence cards with simple icons; allow the Lab 3 claim to be drafted in the home language and then translated with a partner; provide sentence frames for the CER ('Before the change, ___. After, ___. This shows ___ because ___').
  • Students who need more support: Give Lab 1 a reduced deck of eight cards with the first and last stages already placed; pre-tape the Lab 2 strings so groups start with the rules; provide a partly filled comparison table and a word bank for W7; let W10 be taken open-notes.
  • Students ready for extension: Ask them to research the sea star wasting disease and the northern California kelp collapse and build a cascading-change diagram from published summaries; have them add a sixteenth card to the Lab 2 web (a badger or a mountain plover, for example), write its needs, and predict its effect before testing; let them design the Lab 3 survey for a second disturbance type and compare.
  • Students who need movement or alternative output: Run Lab 2 as a standing web, with students holding cards on clipboards so a removal is felt as a tug; run Lab 1 as a floor timeline across the room; allow the W6 argument to be recorded as a 90-second spoken explanation with the data table in hand; let the synthesis be a labeled sketch of the pumice plain at three dates.
  • Students with limited mobility or who cannot go outside: Use the indoor tray alternative for Lab 3 (pressed and unpressed trays of seedlings started ten to fourteen days ahead), or assign the counter and recorder roles at the plot edge on a paved path; provide large-print cards and a hand lens for the survey.
Accuracy notes: where the textbook simplifies (12)
  • Eruptions and survivors: the textbook (p. 287) says an eruption can kill every living thing nearby and erase the ecosystem entirely. That is too absolute. At Mount St. Helens in 1980, pocket gophers, plants under snowbanks, seeds, spores, fungi, ground-dwelling insects and amphibians in some lakes survived, and these biological legacies were central to recovery. Teach 'kills most living things nearby' and name survivors as one source of recovery alongside new arrivals.
  • Succession is a pattern, not a schedule: the textbook (pp. 285-286) calls succession 'predictable' and its pond-to-forest figure labels stages Year 1, 500, 1000 and 1500. Those years are illustrations. Succession follows broad patterns whose pace and endpoint depend on climate, soil, survivors and chance, and the textbook itself (p. 287) says the recovered ecosystem may differ from the original. Avoid assessing specific year counts.
  • Primary versus secondary succession: the lesson describes both (glacier gravel and cooled lava versus a cleared forest) without naming them. The deck uses the standard terms. On Mount St. Helens the pumice plain is primary succession (new substrate, no soil) and the blowdown zone is mostly secondary (soil, roots and seeds survived under the fallen trees).
  • Prairie dogs and plants: the textbook (pp. 288-289) says burrows make grass more abundant for bison and that prairie dogs reduce flowering plants and shrubs so pronghorn decline. National Park Service sources describe something different: prairie dog clipping produces regrowth that is more nutritious, which draws bison and pronghorn to colonies, and clearing opens space for forbs. The shrub reduction is well supported (shrubs were several times more abundant where prairie dogs were removed in a five-year experiment). The deck says prairie dogs change which plants grow and limit shrubs, says grazers favor the regrowth, and never uses pronghorn as the losing species. Grass is itself a flowering plant, so avoid 'flowering plants versus grass'.
  • Prairie dog decline: the textbook's '2 percent of 100 years ago' is a dated estimate; the National Park Service says the species' range has shrunk to about 5 percent of its original extent. Describe the decline as 'very large' and do not assess a percentage.
  • Cattle egrets were not introduced by people: the Key Science Concept spread (p. 291) says cattle egrets 'were introduced' after humans altered Gulf of Mexico landscapes. Cattle egrets crossed from Africa to South America on their own in the late 1800s and reached North America around the 1950s; farmland and livestock helped them spread. The deck calls them a species that arrived and spread, not an introduced or invasive species. The p. 291 graph is a stylized illustration with no units; the deck's before-and-after dataset is labeled simulated.
  • Wax Lake and the 2.8 figure: the textbook's Figure 4 label says the channel links the Mississippi River to the Gulf, but the Wax Lake Outlet (opened 1941) carries Atchafalaya River water. NASA reports one estimate of about 2.8 square kilometers per year for the Atchafalaya and Wax Lake deltas combined, with Wax Lake alone near 1.2, and growth varies with floods and hurricanes. Name the Atchafalaya and present the rate as one estimate for two deltas together.
  • Caernarvon diversion: the textbook presents it as a project to rebuild wetlands that protect New Orleans. Louisiana's coastal agency says its main goal is reducing saltwater intrusion in the Breton Sound basin; it was built 1988-1991, is operated by opening and closing gates (closed during flood advisories), and how much land it builds is debated. The deck keeps only the gate logic and the idea that criteria and constraints differ by place.
  • Keystone species: the term is not in the textbook, but the prairie dog example is the classic case and the National Park Service calls prairie dogs a keystone species. Use the term for a species whose effect on the community is large relative to its abundance; do not use it for every abundant species.
  • Mount St. Helens numbers used in this chapter: the eruption was May 18, 1980; the collapse of the north flank was the largest landslide in recorded history; the lateral blast devastated forest across roughly 600 square kilometers (about 230 square miles), reaching as far as about 30 kilometers (19 miles) from the volcano; 57 people died. A lone prairie lupine was the first plant found on the pumice plain, but published accounts disagree on the year: a 2000 Washington State University report says 1981, and a magazine account of the ecologist credited with the find describes June 1982, when the plant already had a ring of seedlings, so the deck says 1981-1982 and the worksheets say 'within about two years'. As a nitrogen-fixing legume, lupine enriched the pumice around it. The national volcanic monument was created in 1982 and most of the blast zone inside it was left to recover naturally, while land outside it was salvage-logged and replanted (Lab 1 card C). Any counts of lupine, plant cover, elk or insects in the worksheets and labs are simulated teaching data unless a source is cited.
  • Invasive versus introduced: an introduced species is any species people moved outside its native range; it is called invasive only if it spreads and causes harm. Most introduced species do not become invasive.
  • Lab 2's string web is deliberately strict: it marks prairie dog burrows as a must-have for burrowing owls, so it predicts owls are lost when prairie dogs disappear. Real survey data (Sidle and others, 2001) show a large drop, not a total loss: owls on 69 percent of active colonies versus 11 percent of inactive ones. The lab uses that mismatch on purpose; teach the survey result, not the model's prediction, as the empirical finding.

Review status: reviewed · 2026-10-19 · Mount St. Helens facts checked against USGS: 8:32 a.m. magnitude 5.1 earthquake on May 18, 1980, largest debris avalanche in recorded history, about 600 square kilometers (230 square miles) devastated with damage reaching about 30 km (19 miles), 57 deaths, summit about 400 m lower, ash above 24 km, monument created 1982. The phenomenon, slide 2 and the W1 timeline now say forests were 'flattened or scorched/killed' (the 600 square kilometers include standing dead forest), and slide 2 notes, accuracy note 10 and the lateral-blast reference no longer say trees were flattened 30 km out. The dead USGS eruption URL was replaced. First lupine: a 2000 Washington State University report says 1981 and a magazine account of the ecologist credited with the find says June 1982, when the plant already had seedlings. W1 (scene, q1 key, notes) and W3 (paragraph 4, notes; passage now 690 words) say 'within about two years' instead of 'within two years'; slide 11 notes and accuracy note 10 no longer call the 1982 source 'the finder's own account'. Survivor and biological-legacy statements match the USGS monument ecology page. Re-solved every numeric, multiple-choice, true/false and table item in W1-W10 and Labs 1-3; W5 beaver means (115.0/30.0 cm, 5.5/46.0 cm/s, 60.0/5.0, 3.0/38.0, 17.5/2.5), ratios 12 and 7, 92.1 percent, reach J 4.75 to 57.0 and 40.0 to 4.3; W6, W7, W9 matrix (A 4, B2 3, D 2, A+B2 6, B1 and C eliminated), W10 total 23, Lab 1 rates and Lab 3 practice means (36.0/74.0 percent cover, 5 of 6 pairs; 215/60 s, about 3.6 times) are all correct. Fixed: W3 q7 key cited paragraph 7 as 'earlier' evidence (now paragraph 6); W7 q5 and q9 keys now treat 2015 (18 °C) as the transition year. Lab 2 string web re-simulated independently from the card needs, the 32-string list and the wave rules: prairie dogs 12 changed (8 in wave 1, then owls and cottontails, then grasshoppers and deer mice; burrows, ferrets and owls LOST), bison 1, grasshoppers 7, drought 14 over three waves with none lost, and every single-removal total in the teacher notes matches; no MIXED card arises. Sidle and others (2001) confirmed: 582 colonies surveyed in 1998, owls on 307 of 444 active (69 percent) and 15 of 138 inactive (11 percent). q8(b) now says the wildflower UP prediction is for removing prairie dogs. Standards: MS-ETS1-2 (practice, caGrade 6-8) added to chapter.json to match W9's decision-matrix evaluation of given options, with ETS1.B added to threeDimensions; the MS-LS2-4 note now names the tasks that actually carry 'assesses' (Lab 2 closing argument, Lab 3, W6, W8, W10) and lists W5 and the slide 20 task as practice. caGrade is present and matches standards.json on every entry. Vocabulary trimmed from 13 to 12 by removing 'criteria and constraints', which L21, L27, L29 and the earlier engineering chapters teach as vocabulary; the ideas stay on slide 24 and in W9 and W10, and the remaining twelve terms all appear in the W2 word bank. Consistency: the period 7 and 8 sequence now assigns W7 before the exit ticket and W6 after it, so the slide 28 advice (students who miss question 3 revisit W7 before writing W6) can be followed; W6 and W7 notes match. Slide 27 notes no longer imply lab evidence goes into W6. Lab 1 debrief corrected: the cover slopes are equal from 2000 to 2010 and the pumice line is steeper after 2010. Other checks: giant reed (native to northern Africa and western and central Asia; Cal-IPC High; heavy water use, poor stream shading and warmer water, fire fuel) with the W9 origin wording corrected; prairie dog range about 5 percent of original (slide 14 notes reworded, plague added); ferret captures by 1987 and releases since 1991; plague about 1900; northern California bull kelp loss over 90 percent and the 2018 abalone closure; Wax Lake 1941; Caernarvon 1988-1991. No six-word run is shared with the lesson text; two five-word echoes about 'squirrels that live in large' groups were reworded. Labs 1 and 2 now say they have not been physically tested, like Lab 3.

Source references

Verified against the student edition of Bring Science Alive! 7th Grade Integrated (Student Edition). Printed page numbers appear in the book; PDF pages are the physical pages of the 524-page scan (printed + 36). The textbook is not reproduced on this site.

SectionPrinted pagesPDF pagesUsed for
Introduction: the melting glacier and the lesson question284, 285320, 321Lesson question, dynamic system and succession vocabulary, the glacier-forefield example of primary succession, publisher standards (MS-LS2-4, MS-ETS1-1).
1. Ecosystems Change Over Time: gradual change, sudden change, succession286, 287322, 323Pond-to-forest sequence, eruption as sudden change, natural versus human-caused disturbances, Lab 1 two-zone sequencing mystery, slides 5-11.
2. Changes to Living Parts of Ecosystems: prairie dogs288, 289324, 325With-and-without comparison as evidence, species that gain and lose, keystone idea, Lab 2 string web, slides 13-16.
3. Changes to Nonliving Parts of Ecosystems: beaver dams290326Water depth, water speed and light as nonliving resources; downstream effects; slides 17-19 and W4.
Key Science Concept: Ecosystem Changes Shift Populations291327Before-and-after population comparison as a form of evidence; the slide 20 task uses an original simulated dataset in the same spirit.
4. Rebuilding Wetland Buffers: criteria, constraints, Wax Lake and Caernarvon292, 293328, 329Engineering strand: criteria versus constraints, why two places needed two designs, slides 24-25 and W9.
Lesson Summary293329Check that the four big ideas (change over time, living parts, nonliving parts, engineering) are all covered in the synthesis slide.

External references used for accuracy checks

Related chapters