Chapter 26 · Unit 9: Earth's Natural Hazards · Segment 4

Mass Wasting, Tsunamis, and Floods

How do scientists use patterns in data to forecast where and when mass wasting, tsunamis and floods are likely, and how do those forecasts shape the technologies and plans people use to reduce the harm?

Overview

Students figure out why some places are hit again and again by slope failures, tsunamis or floods, and what kinds of data let scientists forecast where each hazard is likely and how much warning a place will get. They tilt and soak model hillsides to find when slopes fail, use the rule that tsunami speed depends on water depth to turn distance into arrival time, and read flood records as yearly chances rather than a schedule. Engineering runs through the chapter: students test and combine bridge designs in a flooding stream tray, follow how NOAA engineers made the DART tsunami sensors reliable by combining three fixes, and write and test their own tsunami warning procedure. California supplies the cases: Crescent City's 1964 tsunami, atmospheric-river floods, and coastal and post-fire debris flows.

Estimated class time: presentation about 139 minutes · worksheets about 430 minutes in total · labs 5 sessions. Eight 50-minute periods: one to launch with the Del Norte phenomenon and slope failure; two for the landslide tray lab; one for the tsunami slides; one for the tsunami warning data lab; one for floods, atmospheric rivers and the bridge task; two for the bridge design lab and the close. Most worksheets fit homework or spare class time; the W8 jigsaw and W9 transfer task each need about a full period if a ninth or tenth period is available.

Phenomenon

One county, one year, two kinds of killer water

Del Norte County is California's far northwest corner. On the evening of March 27, 1964, a magnitude 9.2 earthquake struck Alaska, about 2,600 kilometers away. Roughly four hours later the sea began surging into Crescent City. The first surges did little damage, and during a lull some people went back downtown. The fourth surge, about 6 meters high, wrecked about 30 blocks, and 11 people in the town died. Nine months later, in December 1964, a series of atmospheric-river storms swelled the Klamath River until floating logs and the current knocked out spans of the Highway 101 bridge, and the town of Klamath was nearly wiped out. Just south of Crescent City, the same highway crosses Last Chance Grade, a stretch that landslides have damaged for decades. Why does one stretch of coast face all three hazards, and why can some of them be forecast hours or days ahead while others give almost no notice?

Notice and wonder prompts

  • Which of the three hazards started far away, and which started close to home?
  • Why might the first tsunami surge have done little damage while the fourth did the most? What did some people do after the first one?
  • What do a sliding hillside, a flooding river and a tsunami have in common, and what makes each one different?
  • If you were in charge of keeping Highway 101 open, what data would you collect, and where would you put your instruments?

Learning targets

  • I can explain how slope steepness, water content, shaking and lost plant roots work together to make a slope fail, and tell creep, slides, debris flows and rock falls apart.
  • I can explain what makes a tsunami and use the rule that tsunami speed depends on water depth to calculate when waves will reach different coasts.
  • I can explain how runoff and storm surge cause floods and interpret flood records as yearly chances, such as a 1 percent chance each year, rather than as a schedule.
  • I can analyze hazard data, such as maps, past events, rainfall, sensor readings and travel times, to forecast where a hazard is likely and how much warning a place will get.
  • I can evaluate competing designs, such as bridges and warning procedures, against criteria and constraints, and combine the best features of several into a better one.

What shows the learning happened

  • A class graph of failure angle against water added (Lab 1) with a written explanation of why damp sand stood steeper than dry sand while saturated sand failed at the lowest angle, and one slope-protection idea that follows from the result.
  • A tsunami arrival-time table and a written warning procedure (Lab 3): each segment's distance divided by the speed for its depth, thresholds derived from the record of past events, and a test against twelve events with counts of misses, false alarms and late warnings, plus a combined procedure built from two groups' best steps.
  • A bridge decision matrix comparing at least three tested designs (Lab 2), a redesign that combines features from other groups, and retest data showing which criteria improved.
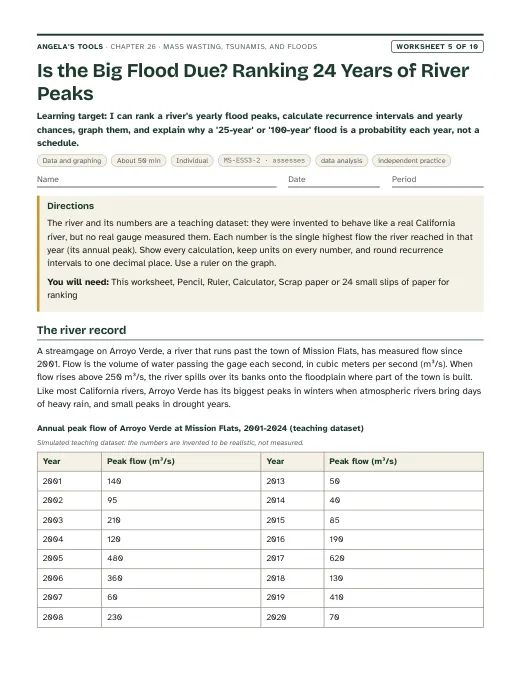
  • A ranked record of yearly flood peaks (W5) with recurrence intervals, yearly chances and a graph, and a sentence explaining why a big flood is never 'due'.
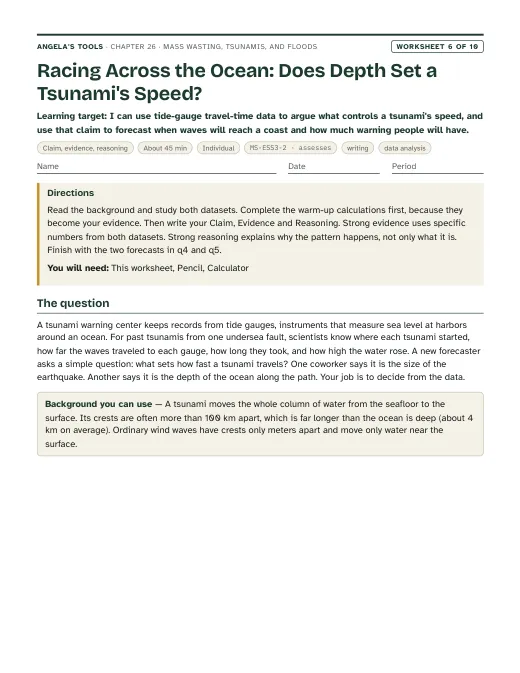
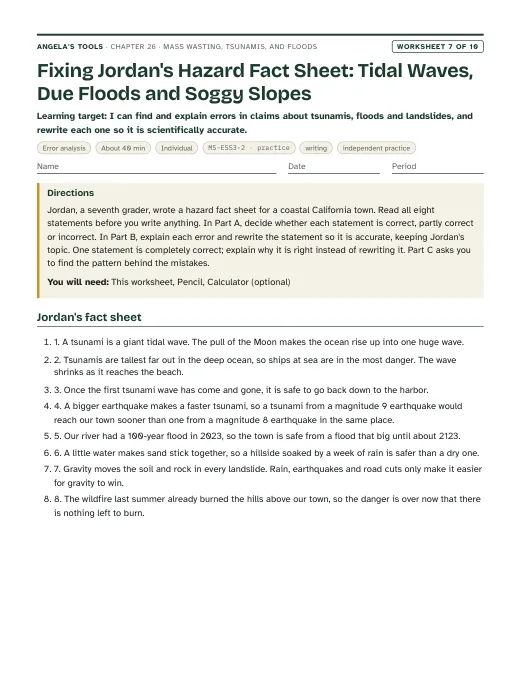
  • A claim-evidence-reasoning argument (W6) that water depth controls a tsunami's speed, using travel-time data to forecast arrival and warning time, and a misconception repair (W7) correcting claims about tidal waves, 'due' floods and soggy slopes.
  • A debris-flow defense plan for a burned canyon (W9) that combines the best features of competing defenses, and a mastery quiz (W10) covering slope failure, tsunami speed and depth, flood chances and matching mitigation to warning time.

Key vocabulary 12 terms

mass wastingAny downhill movement of soil, rock or other earth material that gravity drives, whether it takes years or seconds.The geologists' map of the bluff showed mass wasting of every speed, from slow creep near the top to fresh slides at the base.
creepMass wasting too slow to watch, often a few millimeters to a few centimeters a year, noticed through clues such as tilted fence posts, cracked walls and trees with curved trunks.Years of creep had tilted the old retaining wall so far that its top leaned out over the sidewalk.
landslideA general name for a mass of rock, soil or debris that breaks loose and moves down a slope; many scientists use it for every kind of slope movement.After the wet winter, the highway crew counted twelve new landslides along a single mile of coastal road.
debris flowA fast, water-soaked slurry of mud, sand, boulders and often trees that pours down a channel like wet concrete. A mudflow is a debris flow made mostly of fine particles.A short burst of intense rain on the burned slope turned loose ash and soil into a debris flow that filled the creek bed with boulders.
saturatedHolding as much water as the spaces between its grains can take. In saturated soil the water pressure lightens the grip between grains and the soil gets heavier, so slopes fail more easily.The sensor showed the soil had been saturated for three days before the hillside finally let go.
tsunamiA series of very long ocean waves made when a large volume of water is suddenly pushed up or down, most often by an undersea earthquake. Tides and wind do not cause tsunamis.The tsunami crossed the deep Pacific at about the speed of a jet, then slowed and grew taller as it reached the shallow shelf.
DART systemNOAA's network of deep-ocean tsunami stations. A pressure sensor on the seafloor sends its readings by sound to a surface buoy, which relays them by satellite to warning centers.Readings from a DART system station in the Gulf of Alaska confirmed that the earthquake had made a tsunami and showed how large it was.
runoffWater from rain or melting snow that flows over the land surface instead of soaking in, collecting in gullies, streams and low places.Pavement and burned hillsides both increased the runoff, so the creek rose within an hour of the storm's start.
storm surgeA rise of the sea above the normal tide caused mainly by a storm's winds pushing water toward shore, with a smaller boost from the storm's low air pressure.The storm surge arrived at high tide, so the water reached houses two blocks inland.
atmospheric riverA long, narrow band of air carrying a large amount of water vapor, often from the tropics. When it reaches mountains the air rises and cools, and it can drop days of heavy rain and snow.Forecasters tracked the atmospheric river for four days before it reached the Sierra Nevada, so reservoir managers had time to make room for the runoff.
mitigationAction that reduces the harm a hazard can do, such as walls, drains, warning systems, building rules and evacuation plans. Mitigation lowers risk but cannot remove it.The town's mitigation plan paired a taller sea wall with tsunami evacuation signs and a yearly drill.
scourErosion of a streambed or bank by fast-moving water around a bridge pier or abutment, which can undermine the bridge's foundation.Divers found two meters of scour around the bridge's middle pier after the flood, so the bridge was closed until it was repaired.

Standards alignment

California NGSS, Grade 7 Preferred Integrated Course Model. Each entry says whether this chapter's work assesses the performance expectation, gives practice toward it, or supports it as background; the resource lists below repeat this for every worksheet and lab.

MS-ESS3-2Assesses: analyzing hazard data (slope and rain conditions, tsunami travel times and sensor readings, flood records) to forecast where and how soon a hazard will strike, and using the forecast to shape mitigationCA Grade 7

Analyze and interpret data on natural hazards to forecast future catastrophic events and inform the development of technologies to mitigate their effects.

Lab 3 is the main evidence: students compute tsunami arrival times from distance and depth, use a record of past earthquakes and seafloor-sensor readings to set warning thresholds, and test their procedure against that record. Lab 1 and Lab 2 add model data and a simulated flood record that inform slope protection and a bridge's design flood. The deck keeps the clarification statement's contrast in view: atmospheric-river floods and distant tsunamis can be forecast hours to days ahead, while local tsunamis and most landslides give little or no notice.

MS-ETS1-2Practice toward: evaluating competing bridges and warning procedures systematically against criteria and constraintsCA Grade 6-8

Evaluate competing design solutions using a systematic process to determine how well they meet the criteria and constraints of the problem.

Students score bridge designs in a decision matrix built from shared test data (Lab 2, slide 24) and score warning procedures by misses, false alarms and lead time against a record of past events (Lab 3). The criteria are supplied and the scoring frame is teacher-built, so this practices the PE rather than assessing it.

MS-ETS1-3Practice toward: identifying the best characteristics of several tested designs and combining them into a new solutionCA Grade 6-8

Analyze data from tests to determine similarities and differences among several design solutions to identify the best characteristics of each that can be combined into a new solution to better meet the criteria for success.

The lesson's DART story shows engineers combining a wider sound beam, a tiltmeter and new software into a more reliable design. Students do the same with their own work: in Lab 2 they borrow features from other groups' bridges and retest, and in Lab 3 they merge the strongest steps of two warning procedures. The redesign cycle is short and framed by the teacher, so the role is practice.

MS-ESS2-2Supports: slow surface processes punctuated by sudden, local eventsCA Grade 7

Construct an explanation based on evidence for how geoscience processes have changed Earth’s surface at varying time and spatial scales.

Creep moves a slope millimeters a year, while a debris flow or slide reshapes a hillside in minutes, and floods move sediment and cut channels. This illustrates the clarification statement's point that gradual processes are punctuated by catastrophic events and that rapid landslides are small-scale surface change; the full explanation that PE asks for is built in Lesson 11, not assessed here.

MS-ESS2-4Supports: atmospheric rivers and runoff as parts of the water cycleCA Grade 6

Develop a model to describe the cycling of water through Earth’s systems driven by energy from the sun and the force of gravity.

This is a Grade 6 PE in the California sequence, so students should arrive knowing the water cycle. Here it is background only: atmospheric rivers carry water evaporated from the ocean inland, mountains force the moist air up to make rain and snow, and runoff is the share that does not soak in. No new water-cycle model is assessed.

Assessment boundary: A quantitative understanding of the latent heats of vaporization and fusion is not assessed.

Science and engineering practices

  • Analyzing and Interpreting Data. Students find the pattern in class failure-angle data (Lab 1), turn a simulated stream record into yearly flood chances (Lab 2), read magnitude, depth and seafloor-sensor data from past earthquakes to set warning thresholds (Lab 3), and compare bridge test results on the slide 24 task.
  • Developing and Using Models. A tilting sand tray models a hillside (Lab 1), a stream tray models a river in flood (Lab 2), a speed-depth graph and a cross-section model show how a tsunami slows and grows over a rising seafloor (slide 13, W4) and how a warning moves from seismometer to siren (slide 17).
  • Using Mathematics and Computational Thinking. Students convert rise heights to slope angles, calculate travel time as distance divided by speed for each depth zone of a tsunami's path, and compute yearly chances and expected numbers of floods over a bridge's life.
  • Constructing Explanations and Designing Solutions. Students explain why damp sand stands steeper than dry sand but saturated sand fails lowest, design and redesign a bridge for a chosen flood, and write a warning procedure that meets criteria for lead time and false alarms.

Disciplinary core ideas

  • ESS3.B Natural Hazards. Mapping where slides, tsunamis and floods have happened, combined with knowing the forces behind them (steep wet slopes, subduction zones, atmospheric rivers), lets scientists forecast where they are likely; sensors and forecasts then give warning times that range from days to almost none.
  • ESS2.C The Roles of Water in Earth's Surface Processes. Water soaking into slopes triggers mass wasting, water flowing over land becomes runoff and floods, and moving water scours streambeds around bridges.
  • ETS1.B Developing Possible Solutions. Bridge designs and warning procedures are tested and compared systematically against criteria and constraints, as NOAA engineers did with DART prototypes off Oregon.
  • ETS1.C Optimizing the Design Solution. No single design wins every test; students identify the best feature of each tested bridge or procedure and combine them, mirroring the three combined DART fixes.

Crosscutting concepts

  • Patterns. Hazard maps and records show where events cluster: steep wet coastal ranges for slides, the Pacific Ring of Fire for tsunamis, low river valleys for floods.
  • Cause and Effect. Students trace causes to effects at each step: water content to slope failure, seafloor depth to tsunami speed, rain rate versus soaking rate to runoff, pier placement to debris jams and scour.
  • Stability and Change. A slope or a levee stays stable until a threshold is crossed, then changes suddenly; Lab 1 measures that threshold directly.
  • Influence of Science, Engineering, and Technology on Society and the Natural World. Warning centers, DART buoys, reservoir operations guided by atmospheric-river forecasts, and slope and bridge designs all show science-based technology changing how communities live with hazards, and at what cost.

Presentation 27 slides

Mass Wasting, Tsunamis, and Floods: reading the data before the ground, the sea or the river moves. Original, editable slides with speaker notes: a phenomenon opener, learning targets, the chapter's concepts with diagrams, vocabulary in context, 3 checks for understanding, 2 discussion prompts, an application task, a misconception check, a synthesis and an exit ticket.

Worksheets 10 of 10

Ten different tasks, one per instructional blueprint. Each has a student PDF (low ink, US Letter), an editable DOCX, an HTML preview, and a separate teacher answer key with reasoning.

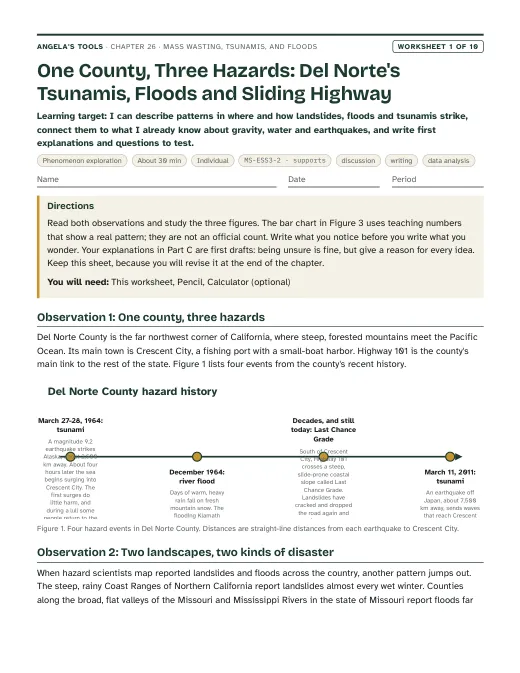
First page of One County, Three Hazards: Del Norte's Tsunamis, Floods and Sliding Highway
Worksheet 1 · Phenomenon exploration

One County, Three Hazards: Del Norte's Tsunamis, Floods and Sliding Highway

I can describe patterns in where and how landslides, floods and tsunamis strike, connect them to what I already know about gravity, water and earthquakes, and write first explanations and questions to test.

30 minindividualActivates prior knowledgeDiscussionWritingData analysis MS-ESS3-2 · supports
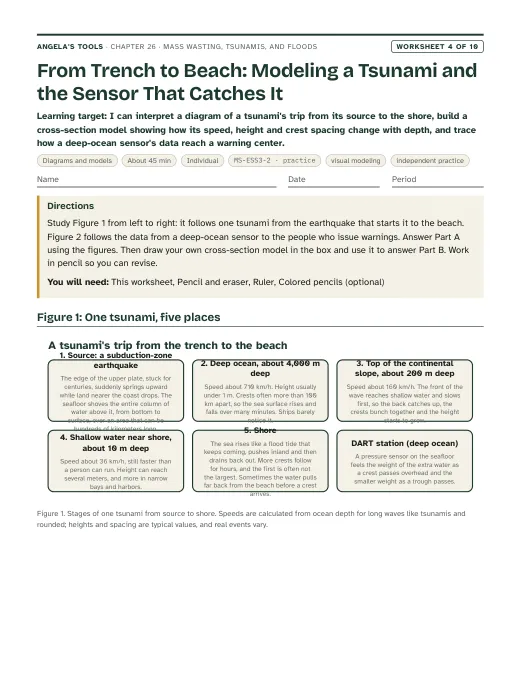
First page of From Trench to Beach: Modeling a Tsunami and the Sensor That Catches It
Worksheet 4 · Diagrams and models

From Trench to Beach: Modeling a Tsunami and the Sensor That Catches It

I can interpret a diagram of a tsunami's trip from its source to the shore, build a cross-section model showing how its speed, height and crest spacing change with depth, and trace how a deep-ocean sensor's data reach a warning center.

45 minindividualPracticeVisual modelingIndependent practice MS-ESS3-2 · practice
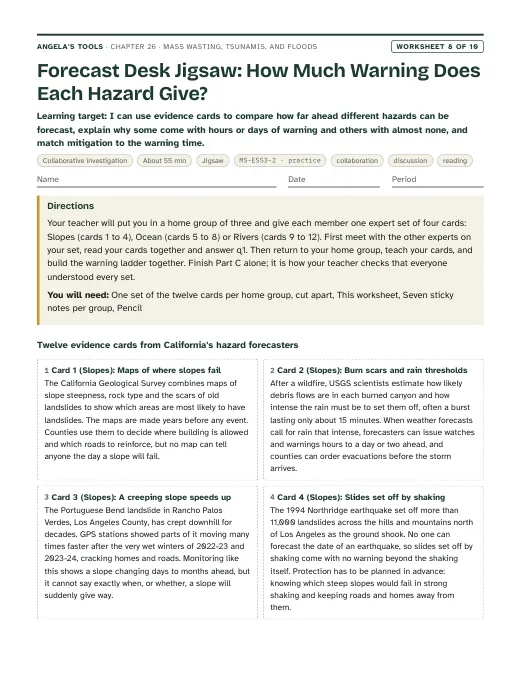
First page of Forecast Desk Jigsaw: How Much Warning Does Each Hazard Give?
Worksheet 8 · Collaborative investigation

Forecast Desk Jigsaw: How Much Warning Does Each Hazard Give?

I can use evidence cards to compare how far ahead different hazards can be forecast, explain why some come with hours or days of warning and others with almost none, and match mitigation to the warning time.

55 minjigsawPracticeCollaborationDiscussionReading MS-ESS3-2 · practice
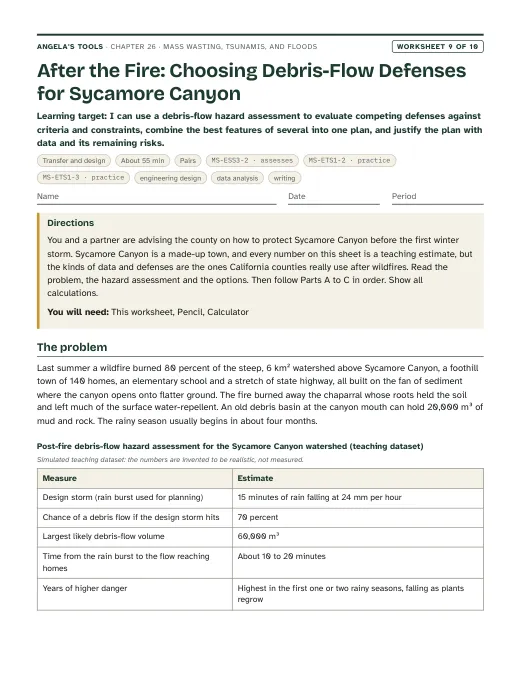
First page of After the Fire: Choosing Debris-Flow Defenses for Sycamore Canyon
Worksheet 9 · Transfer and design

After the Fire: Choosing Debris-Flow Defenses for Sycamore Canyon

I can use a debris-flow hazard assessment to evaluate competing defenses against criteria and constraints, combine the best features of several into one plan, and justify the plan with data and its remaining risks.

55 minpairsExtensionEngineering designData analysisWriting MS-ESS3-2 · assessesMS-ETS1-2 · practiceMS-ETS1-3 · practice

Collaborative labs 3 of 3

Three different investigation approaches. Each has a teacher guide (purpose, materials with quantities, estimated cost, prep, safety, procedure, expected observations, debrief, answer key, assessment criteria, accessibility adaptations, low-cost alternative) and a student recording sheet.

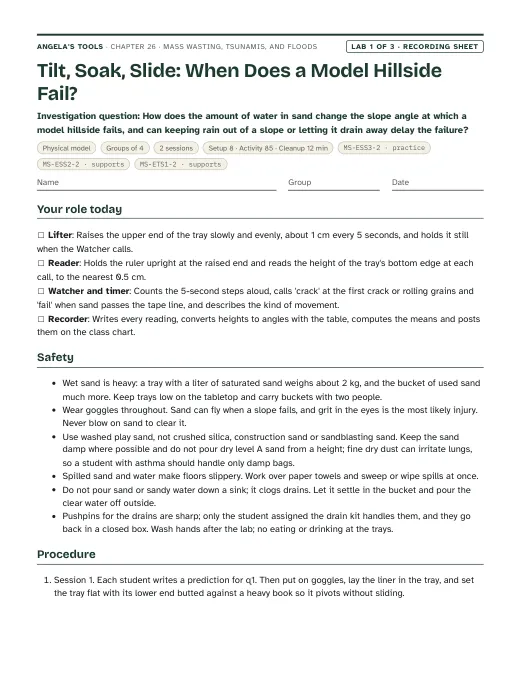
First page of the Tilt, Soak, Slide: When Does a Model Hillside Fail? recording sheet
Lab 1 · Physical model

Tilt, Soak, Slide: When Does a Model Hillside Fail?

How does the amount of water in sand change the slope angle at which a model hillside fails, and can keeping rain out of a slope or letting it drain away delay the failure?

Groups of 42 sessions85 min activityEst. 30 to 55 per class (estimate)Shallow plastic tray or disposable aluminum roasting pan, about 30 cm long, 20-25 cm wide and at least 5 cm deepNon-slip rubber shelf liner cut to fit the tray bottomWashed play sand, premixed by the teacher in sealed 1-liter bags at water levels A-E MS-ESS3-2 · practiceMS-ESS2-2 · supportsMS-ETS1-2 · supports
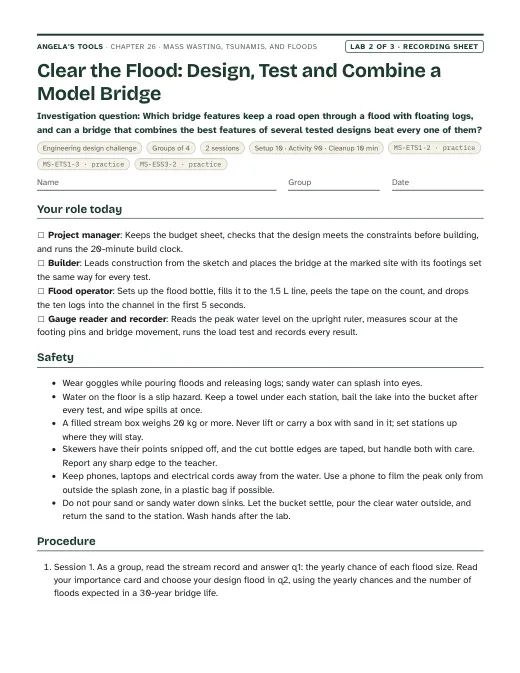
First page of the Clear the Flood: Design, Test and Combine a Model Bridge recording sheet
Lab 2 · Engineering design challenge

Clear the Flood: Design, Test and Combine a Model Bridge

Which bridge features keep a road open through a flood with floating logs, and can a bridge that combines the best features of several tested designs beat every one of them?

Groups of 42 sessions90 min activityEst. 40 to 80 per class (estimate); about 15 to 25 if the school has stream tables and reuses the Lab 1 sandStream-tray station: a school stream table or a long plastic under-bed storage box (about 80 x 45 x 15 cm)Washed play sand (dried Lab 1 sand works)Flood bottles: 2 L soda bottles with the bottoms cut off and 2, 4 or 6 holes about 5 mm wide drilled in the caps, labeled Small, Design-size and Record MS-ETS1-2 · practiceMS-ETS1-3 · practiceMS-ESS3-2 · practice
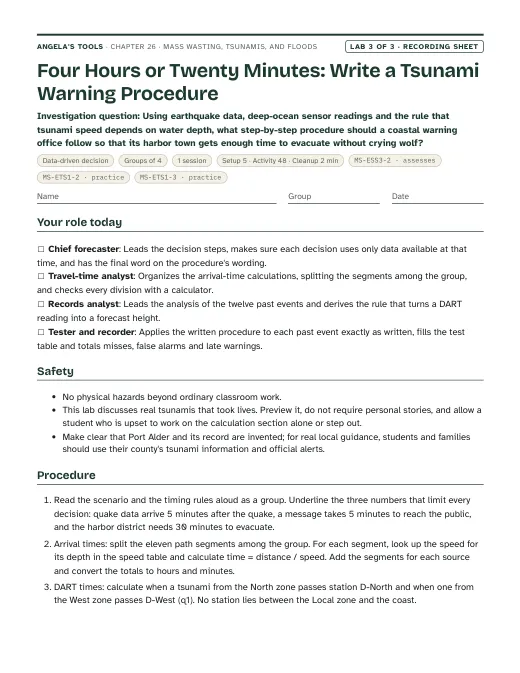
First page of the Four Hours or Twenty Minutes: Write a Tsunami Warning Procedure recording sheet
Lab 3 · Data-driven decision

Four Hours or Twenty Minutes: Write a Tsunami Warning Procedure

Using earthquake data, deep-ocean sensor readings and the rule that tsunami speed depends on water depth, what step-by-step procedure should a coastal warning office follow so that its harbor town gets enough time to evacuate without crying wolf?

Groups of 41 session48 min activityEst. 1 to 3 per class (estimate)Printed data packet: speed table, path table, DART station locations, record of past events, alert definitions and timing rulesCalculatorColored pencils (green, yellow, red) for marking alert levels MS-ESS3-2 · assessesMS-ETS1-2 · practiceMS-ETS1-3 · practice

Teacher guidance

Suggested sequence (8 steps)
  1. Period 1: Presentation slides 1-8 (the Del Norte 1964 phenomenon, targets, three hazards and one pull, four ways a slope moves, the slope tug-of-war, vocabulary, first check). W1 phenomenon worksheet as the opener; W2 vocabulary worksheet for homework.
  2. Period 2: Lab 1 session 1, Tilt, Soak, Slide: groups tilt sand beds at two assigned water contents, three trials each, and post means to the class chart.
  3. Period 3: Lab 1 session 2: rain on a 30-degree slope with and without a mitigation (cover and gutter, buried drains, or a toe wall), then graph the class data. Slides 9-11 (California's restless coast, debris flows after fire, the wall-drain-or-move discussion). W3 reading worksheet for homework.
  4. Period 4: Slides 12-20 (what makes a tsunami, speed and depth, from deep water to shore, the arrival-time check, Crescent City 1964, from earthquake to warning, engineering the DART, vocabulary, when the earthquake is the warning). W4 diagram worksheet for homework.
  5. Period 5: Lab 3, Four Hours or Twenty Minutes: groups compute arrival times from three sources, set thresholds from the past-event record, write a warning procedure and test it against twelve events. W6 CER on depth and tsunami speed for homework.
  6. Period 6: Slides 21-24 (two ways to flood, California's atmospheric rivers, the flood-chance check, the three-bridges task). Start the W5 data worksheet on yearly flood peaks and finish it for homework; W7 misconception repair as a second homework or warm-up.
  7. Period 7: Lab 2 session 1, Clear the Flood: groups turn the stream record into yearly chances, choose a design flood for their bridge's use, build version 1 and run the three flood tests.
  8. Period 8: Lab 2 session 2: class decision matrix, combine features from other groups, build and retest version 2. Slides 25-27 (the first-wave misconception, synthesis, exit ticket). W10 mastery as the quiz at the start of the next lesson. If time allows, add a period for the W8 forecast-desk jigsaw and a period for the W9 debris-flow defense task, or assign W9 to pairs as a project.

Materials overview: No flames, heat or chemicals. Lab 1 uses washed play sand, shallow trays or disposable roasting pans lined with non-slip shelf liner, measuring cups, spray bottles, rulers and plastic wrap, straws and craft sticks for the mitigations. Lab 2 uses four shared stream-tray stations (a school stream table or long under-bed storage boxes) filled with the Lab 1 sand, cut 2-liter bottles as repeatable flood makers, craft sticks, straws, tape, modeling clay, aquarium gravel, twigs as floating logs and about 200 grams of pennies or masses for the load test. Lab 3 is paper only: the data packet and calculators. Goggles are needed for Labs 1 and 2.

Common misconceptions (6)
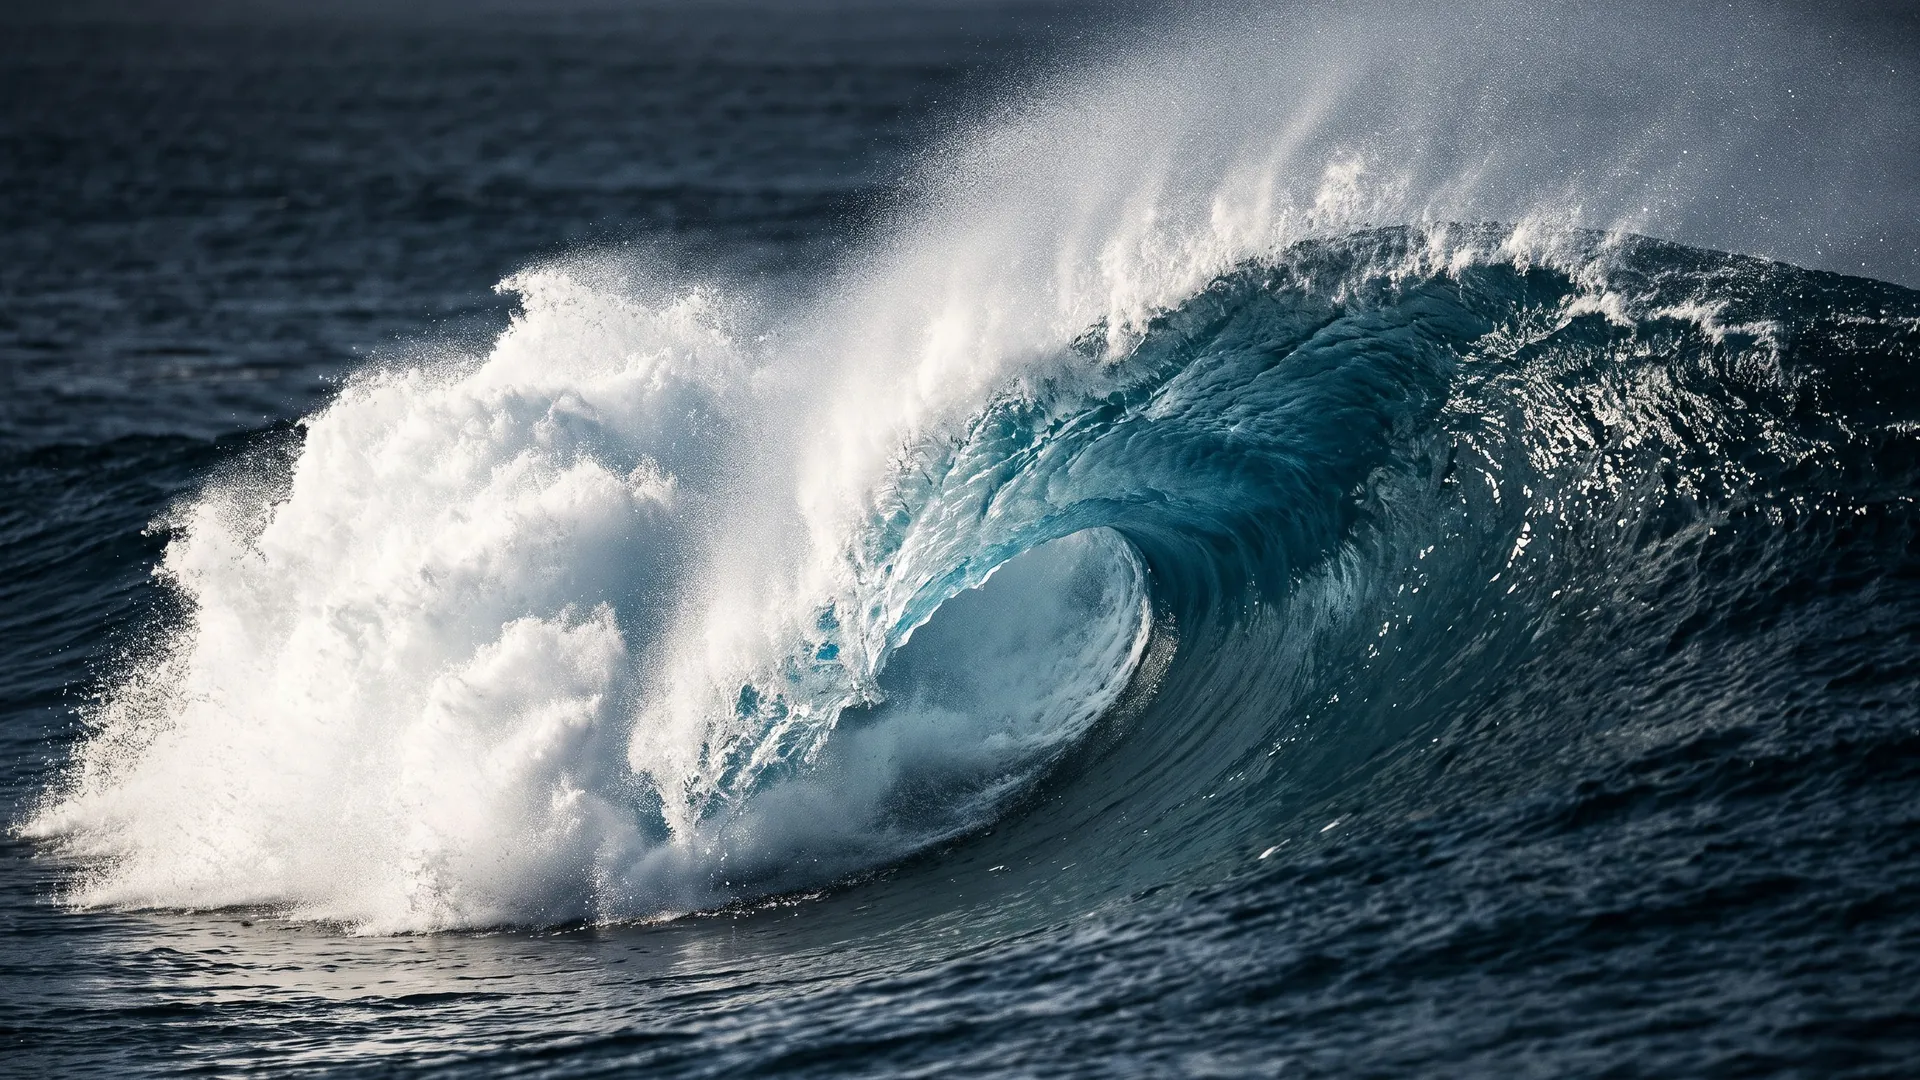
“A tsunami is one giant curling wave, and once it has hit and drained away the danger is over.”
Why it happens: Movies and surfing photos show a single towering breaker, and the old name 'tidal wave' suggests one event.
Correction: A tsunami arrives as several surges that can keep coming for hours. Most look like a fast-rising flood or a churning wall of foam rather than a curling breaker, and the sea may pull back first. The first surge is often not the largest: at Crescent City in 1964 the fourth was the most destructive. Coasts stay evacuated until officials end the warning.
“Tsunamis are caused by tides or by strong winds.”
Why it happens: The everyday name 'tidal wave', and the fact that all the other waves students see are made by wind.
Correction: Tsunamis are made when a large volume of water is suddenly lifted or dropped, most often by an undersea earthquake, and sometimes by underwater landslides, volcanic eruptions or asteroid impacts. Tides come from the pull of the Moon and Sun; wind waves are short and only stir the surface, while a tsunami moves the whole depth of the ocean.
“Water makes slopes slide by acting like a lubricant, so any added water makes soil weaker.”
Why it happens: Mud feels slippery, and the textbook says wet slopes move faster than dry ones without explaining why.
Correction: A little water can make sand stronger: thin films between grains pull them together, which is why damp sand builds steep castles. Danger comes when soil becomes saturated. Then water pressure in the gaps lightens the grain-to-grain contact so friction drops, and the extra water adds weight. Lab 1 shows both effects.
“A '100-year flood' happens once every 100 years, so after one, a town is safe for a century.”
Why it happens: The name sounds like a schedule, and people remember long gaps between big floods.
Correction: A 100-year flood is a flood size with a 1 percent chance of happening in any year. Two can happen in back-to-back years. Over 30 years the chance of at least one is about 26 percent.
“Scientists can predict exactly when the next landslide, tsunami or flood will happen.”
Why it happens: Weather forecasts are familiar, and the textbook says tsunamis 'can be accurately predicted'.
Correction: Scientists forecast likelihoods and, once a triggering event has started, arrival times. Nobody can say when the next tsunami-making earthquake will strike; warning centers forecast a tsunami's arrival only after the quake. Atmospheric rivers can often be seen several days ahead, and burned slopes have rain thresholds for debris flows, but the exact moment a given slope fails cannot be predicted.
“A sea wall, levee or dam makes the area behind it completely safe.”
Why it happens: Structures look solid and permanent, and they work during ordinary events.
Correction: Every structure is built for a design event. Bigger events can overtop or break it: in 2011 waves overtopped many Japanese sea walls, and in 2023 the Pajaro River broke through a levee and flooded the town of Pajaro. Structures lower risk, so communities pair them with warnings, evacuation plans and land-use rules.
Differentiation suggestions (6)
  • Multilingual learners: Pre-teach slope, soak, saturated, wave, depth, flood and warning with photos and gestures (tilt a hand for slope; spread fingers apart for grains pushed by water). Offer sentence frames: 'The slope failed at ___ degrees because ___' and 'The wave will arrive in ___ hours because it travels ___ km at ___ km/h.' Let students label the Lab 2 sketch in their home language first.
  • Students who need more support: Give the Lab 1 height-to-angle table already highlighted at 5-degree steps, a Lab 3 arrival-time table with the first segment of each path worked, and a warning-procedure template with the if-then blanks laid out. In Lab 2, provide two starter bridge sketches to modify rather than a blank page.
  • Students ready for extension: Ask them to use speed = square root of (9.8 x depth) to check three values on the speed chart, to calculate the chance of at least one 1-percent flood in 30 years (1 - 0.99^30), or to read the USGS post-fire debris-flow hazard maps for a recent California fire and explain what the rainfall thresholds mean.
  • Students who need movement or alternative output: Run the tsunami as a hallway model: students walk the deep-ocean leg with long strides and the shelf and shore legs with tiny steps, so the class sees the front slow and bunch up. Accept a recorded spoken procedure for Lab 3 and a labeled photo series of the Lab 1 slope as the written record.
  • Students who have lived through a fire, flood, landslide or evacuation: Preview the California cases a day ahead, never require personal stories, and give a quiet alternative task if a photo or account is upsetting. Keep the emphasis on what data, design and planning let people do, and know your school counselor's referral process before Period 1.
  • Students with limited fine-motor control or low vision: Assign the Watcher or Recorder role in Lab 1 and the data-checker role in Lab 3; use a ruler with large, high-contrast centimeter marks taped upright beside the tray; read the Lab 3 tables aloud in pairs; let a partner place bridge pieces while the student directs the design.
Accuracy notes: where the textbook simplifies (15)
  • Forecasting is not predicting: Section 4 (p. 348) says tsunamis 'can be accurately predicted' because they have precursor events. Warning centers cannot predict when or where the next tsunami will strike. After an earthquake they issue a first message from earthquake data alone, then use DART and coastal sea-level data and models to forecast whether waves formed, when they will arrive and how large they will be. Near-source tsunamis can arrive within minutes, before any detailed forecast. The chapter uses 'forecast' throughout and teaches the difference on slides 17 and 20 and in Lab 3.
  • How a tsunami starts: Section 3 (p. 346) says the subducting plate moves down and the water 'moves with it'. In a large subduction-zone earthquake the edge of the upper plate springs upward and seaward, raising the seafloor and the water above it, while nearby areas drop. The chapter says the seafloor is suddenly lifted or dropped, and slide 12 names the upper plate springing up.
  • Tsunami speed depends on depth: the text (p. 347) gives speeds 'over 800 kilometers per hour' in deep water. Long waves travel at about the square root of gravity times depth, so roughly 700 km/h over 4,000 m of water, 800 km/h over 5,000 m and 870 km/h over 6,000 m, slowing to tens of km/h near shore. The slide 13 chart and the Lab 3 speed table are calculated from that rule and labeled as calculated values.
  • What arrives at the coast: the text (p. 347) describes 'moving walls of water' and wave heights 'sometimes more than 30 meters'. Most tsunamis come ashore as a fast-rising flood or a turbulent bore, sometimes after the sea pulls back, and they arrive as a series over hours. The largest heights quoted for 2011 are run-up, the height the water climbed on land, which reached about 40 m in one place. The chapter separates wave height offshore from run-up on land.
  • Mass-wasting types are simplified: Figure 1 (p. 344) gives each type one speed and trigger, calls earthflows fast and says creep happens 'on all slopes'. Geologists classify slope movements in more detail (falls, topples, slides, spreads and flows), and USGS describes earthflows as ranging from very slow to rapid. The textbook's 'mudflow' is close to what geologists usually call a debris flow; a mudflow is the fine-grained kind. The chapter teaches debris flow as the vocabulary term and describes earthflows as slow to fast.
  • Water does not lubricate slopes: the text (p. 344) says material moves faster down wet slopes than dry ones without the mechanism. Saturation causes failure because water pressure in the pores lightens grain-to-grain contact (cutting friction) and adds weight; a small amount of moisture actually strengthens sand through capillary films. Lab 1 is designed to show both effects, and the misconception list addresses 'water as lubricant'.
  • La Conchita did not come 'out of nowhere' (p. 344): it sits below a bluff about 180 m high that USGS reports has had landslides since at least 1865 and for thousands of years before. The 2005 slide was a remobilization of part of the 1995 deposit, and a steel-and-timber wall built after 1995 was tilted and overtopped. The text's 16.47 inches of rain in 15 days (p. 345) comes from a gauge not named in the book; USGS reports 14.9 inches at Ventura for the same 15 days. No rainfall figure is tested.
  • Sea walls have limits: the text (p. 349) says sea walls 'can block waves'. In 2011 many Japanese breakwaters and sea walls built for smaller design tsunamis were overtopped or destroyed, though damaged structures still reduced flooding behind them, and evacuation saved many lives. The chapter treats walls as one layer of mitigation with a design limit.
  • Event totals are dated estimates: the 2011 figures (waves of 3 to 38 m, up to 300,000 buildings, up to 20,000 deaths, p. 346), the 2004 Indian Ocean totals (p. 349) and the Houston and Baton Rouge flood totals (pp. 353-354) are early or rounded. Later surveys give about 40 m maximum run-up and about 19,000 dead and missing for 2011. None of these totals is used in an assessed item.
  • Hurricane Harvey (p. 353): the text says 'hundreds of billions of dollars' of damage and about 60 deaths. NOAA's National Hurricane Center estimates $125 billion and at least 68 direct deaths, nearly all from freshwater flooding rather than storm surge. The text's statement that storm surge is the greatest hurricane threat matches NHC's general guidance, but Harvey was a rain-flood disaster; the chapter uses it only as a runoff example.
  • Storm surge in California: the lesson's storm-surge examples are Gulf and North Sea coasts. California almost never sees hurricanes; its coastal flooding comes mostly from winter storm waves and very high tides with a smaller surge on top. Slide 21 says so, so students do not picture hurricane surge as a California hazard.
  • Flood risk is a probability: Section 7 (p. 354) says single floods are hard to predict and that risk can be estimated from past events. A risk rating is a yearly chance, not a calendar; a '100-year flood' has a 1 percent chance each year and can recur in consecutive years. Figure 7 counts reported flood events by county for 1996-2013, so counties with more people and more reporting can show more events; it is a frequency map, not a severity map.
  • Figure 4B (p. 349) labels the 1700 earthquake 'near Portland, Oregon' and the 1946 earthquake 'Central Aleutian Islands'. The 1700 event was a rupture of the roughly 1,000 km Cascadia Subduction Zone offshore, and the 1946 quake struck off Unimak Island at the eastern end of the Aleutians. The chapter uses Figure 4B only for its broad pattern.
  • Dams and levees (p. 355): reservoirs reduce floods only when space is kept empty for the storm, and structures can fail; the 2017 Oroville spillway emergency and the 2023 Pajaro levee break both came during atmospheric-river storms. At Lake Mendocino, operators now use atmospheric-river forecasts to decide when to hold or release water. Slide 22 notes this as an example of a forecast informing a technology.
  • Phenomenon figures: accounts of Crescent City in 1964 differ slightly (29 versus 'about 30' blocks; four or five surges; 10 or 11 deaths in Crescent City and 12 to 13 in California). In 1964 the warning reached Del Norte County officials late, and deputies were still evacuating when the first surge arrived; residents' earlier experience of small surges and false alarms, and a lull after the second surge, drew people back to the waterfront. The chapter uses 'about 30 blocks', 'the fourth surge, about 6 m' and '11 people in the town' and does not test them. The December 1964 Klamath flood figures (up to 15 inches of rain in 24 hours; 47 deaths across the whole region) come from the National Park Service. The textbook's own phenomenon, Northern California's mass wasting compared with Missouri's floods, is used in the notes for slide 4.

Review status: reviewed · 2026-10-19 · Scope: read all 15 files against the lesson text (pp. 342-355), the standards file and the Fun House L26 review flags; solved every numeric, multiple-choice, true/false, fill and table item in W1-W10 and Labs 1-3 independently. No 6-word run matches the lesson text; all slide text limits, key coverage, codes and caGrade values check out. Slide links and sequence verified: the links on slides 3, 5, 10, 12, 13, 15, 20, 22 and 24 now match the worksheets and labs as written. Slide 16 pointed to W6 for the 1964 story, which W6 does not use; it now points to W7 q4, W8 card 7 and the W6 extension. The sequence assigns W6 (tsunami CER) after the tsunami lab in Period 5 and W5 (flood peaks) with the flood slides in Period 6, which matches the content order. Tsunami speed: slide 13 and the Lab 3 speed table listed 357 km/h (1,000 m) and 618 km/h (3,000 m), and Lab 3 listed 160 km/h (200 m); with the stated rule speed = square root of (9.8 x depth) these are 356, 617 and 159, and they were corrected. The Lab 3 North total is now 3.506 + 0.421 + 0.354 + 0.139 = 4.420 h (still 4 h 25 min). All other arrival times (West 9 h 55 min, Local about 20 min, D-North 1 h 24 min, D-West 3 h 46 min, slide 15, exit ticket, W6 and W10) recomputed correctly. Flood recurrence verified: W5 ranks, T = 25/m, chances and the 87 and 39 percent 50-year figures; W2 q5, W7 q7 and W10 q8-q9; the 26 percent 30-year chance; Lab 2's 55, 10 and 2.5 percent and 3 and 0.75 expected floods. Lab 2 q1 now also accepts the W5 (n + 1)/m method (about 54, 10 and 2.4 percent). Lab 1 trigonometry verified: every height in the 30 cm table equals 30 x sine of the angle to 0.1 cm, and 15.0 cm gives 30 degrees. The tray-length instruction now says to measure the bottom length from the pivot edge to the raised edge, because flared roasting pans are shorter at the bottom than at the rim and the inside rim length would skew the angles. Crescent City 1964: checked against Pararas-Carayannis (first surge 4.1 h, fourth surge largest at about 20-21 ft after the harbor drained, 11 deaths, about 30 blocks) and Dengler's Humboldt columns. People went back to the waterfront during a lull after the early surges, not after the first one, and the warning reached the county late while deputies were still going door to door; the phenomenon, slides 2 and 16, W1 Figure 1 and the Lab 3 q10 key were adjusted. Slide 16's unsupported claim that residents heard radio and television alerts was replaced. Crescent City 2011 (forecast 7:23 a.m., observed 7:34 a.m., 2.47 m, no deaths in town, one drowning near the Klamath River mouth) and the July 2025 H Dock result were confirmed. December 1964 Klamath flood: the NPS page confirms up to 15 inches of rain in 24 hours, two south-end spans of the Douglas Memorial Bridge battered out by logs, the town wiped out and 47 deaths across the region. The W1 claim that Klamath lay under about 4.5 m (15 ft) of water rests only on a secondary listing, so W1 now says the river nearly wiped out the town. Other cases confirmed: La Conchita 2005 (180 m bluff at about 35 degrees, slides reported since 1865, 14.9 in at Ventura in 15 days, about 10 m/s, 10 deaths, 13 houses destroyed and 23 damaged, remobilized 1995 deposit); Montecito 2018 (23 deaths, more than 400 homes, 0.86 in in 15 minutes at Carpinteria, about a 100-year rate, boulders over 4 m); Mud Creek 2017 (May 20, a quarter mile of Highway 1 under more than 65 ft of debris, reopened July 18, 2018; slide 9 notes now say about 20 m, since 65 ft is 19.8 m); Pajaro levee break during an atmospheric river in March 2023; the 1861-62 flood; Last Chance Grade tunnel (Caltrans, August 20, 2026). Hurricane Harvey's book figures are flagged in accuracyNotes and nowhere tested. Rancho Palos Verdes: the FOX 11 source (March 16, 2026) says movement was about 2 inches a week and picking up again after rain, not steadily slowing; the slide 9 notes and the reference entry now say so. Lab 3 whyThisHelps said the magnitude-only rule 'misses one dangerous wave'; its key and debrief count two misses (E2 needs an advisory, E11 a warning), so the sentence now matches. The model procedure in the teacher notes was re-run on all twelve events: 0 misses, 1 false alarm (E10), 1 late warning (E11). Kept as written: 'about 2,600 km' from the 1964 source to Crescent City (the epicenter is about 2,660 km away but the uplifted source area reaches closer); W5-W10 needed no edits.

Source references

Verified against the student edition of Bring Science Alive! 7th Grade Integrated (Student Edition). Printed page numbers appear in the book; PDF pages are the physical pages of the 524-page scan (printed + 36). The textbook is not reproduced on this site.

SectionPrinted pagesPDF pagesUsed for
Introduction: the 2016 Minamiaso landslide and the lesson question342, 343378, 379Lesson question, the vocabulary the book defines, the standards the publisher lists, and the earthquake-triggered landslide used in slide 6 notes.
1. Causes of Mass Wasting: four types and La Conchita344380Types of mass wasting, steep wet slopes, earthquake triggers (slides 4-8, Lab 1); the simplifications corrected in accuracy notes.
2. Planning for Mass Wasting Events: data, the potential map and mitigation345381Data scientists use to map mass-wasting potential, slope covers, diversion channels and walls (slides 9-11, Lab 1 session 2).
3. Causes of Tsunamis: sources and how waves change toward shore346, 347382, 383Tsunami sources, deep-water and shallow-water behavior, the Ring of Fire pattern (slides 12-14); generation mechanism corrected in accuracy notes.
4. Planning for Tsunamis: warning networks, travel times and mitigation348, 349384, 385Seismic and sea-level networks, arrival time from speed and distance, near-source danger, warning signs and sea walls (slides 15-17 and 20, Lab 3).
5. Designing a Tsunami Early Warning System: the DART system350, 351386, 387Seafloor sensor, acoustic modem, buoy and satellite; prototype testing off Oregon and data dropouts (slide 18, Lab 3 framing).
Key Science Concept: Using the Engineering Process to Improve Tsunami Warnings352388Combining three solutions into a better design, the model for MS-ETS1-3 practice (slides 18 and 24, Lab 2 session 2, Lab 3 q8).
6. Causes of Floods: runoff and storm surge353389Runoff and storm-surge floods (slide 21); Harvey figures corrected in accuracy notes.
7. Planning for Floods: flood predictions, the county flood map and mitigation structures354, 355390, 391Factors scientists analyze, flood frequency as risk, dams and surge barriers, cost decisions (slides 22-24, Lab 2).
Lesson Summary355391Check that every summary idea is covered by a target and a slide.

External references used for accuracy checks

Related chapters