Chapter 23 · Unit 8: States of Matter · Segment 3

The Motion of Particles

How does the motion of particles explain what a solid, a liquid and a gas can do, and what happens to that motion when thermal energy is added or removed?

MS-PS1-4 · assessesMS-PS3-4 · supports Textbook pp. 296–307 1 presentation · 10 worksheets · 3 labs

Overview

Students figure out that the particles of every substance are always moving, and that how they move, vibrating in place, sliding past each other, or flying freely, is what makes a sample a solid, a liquid or a gas. They connect temperature to the average motion of those particles, use that link to explain why a drop of dye spreads faster in warm water, and build a model that predicts what happens to particle motion, temperature and state when thermal energy is added or removed. They then add pressure to the model, read a state diagram, and see why scientists report the conditions of every measurement. This chapter is the particle foundation for thermal energy and heat transfer in the lessons that follow.

Estimated class time: presentation about 129 minutes · worksheets about 420 minutes in total · labs 3 sessions. Seven 50-minute periods: two for the dye phenomenon, the three states and the temperature-motion link; two for the energy-in, energy-out model of changes of state; two for pressure, state diagrams and standard conditions; one for synthesis and mastery. Labs 1 and 2 each fit one period; Lab 3 fits one period with the cooling run as an optional second session.

Phenomenon

Two drops, two speeds, and nobody stirred

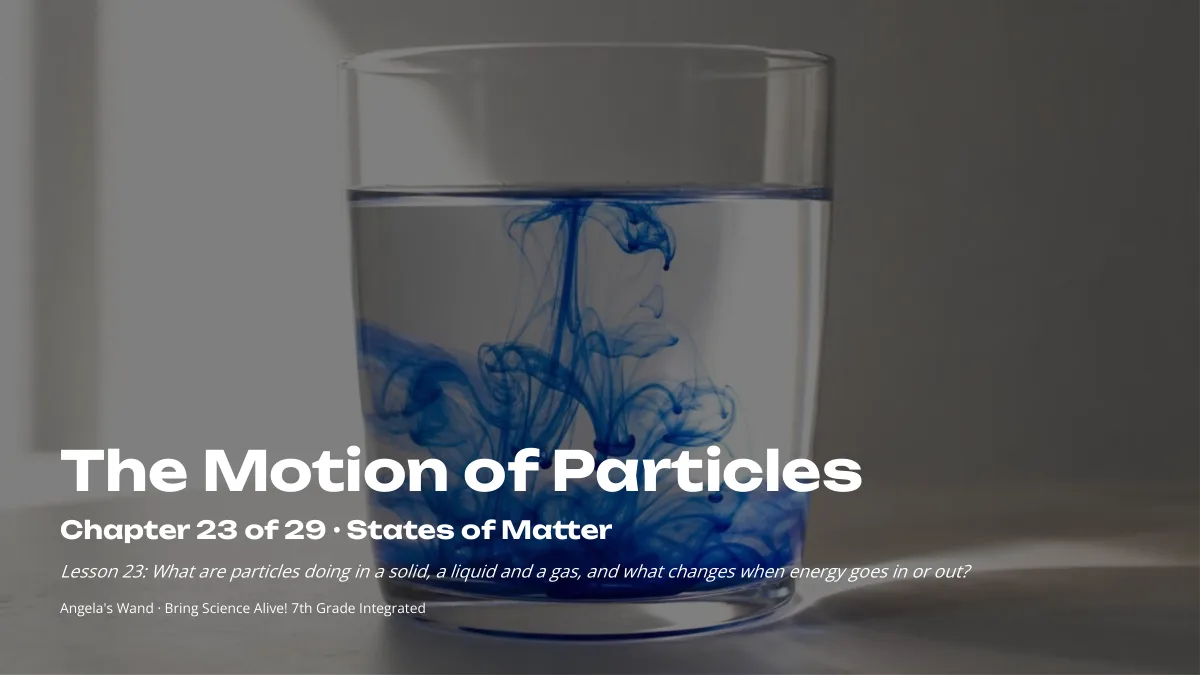
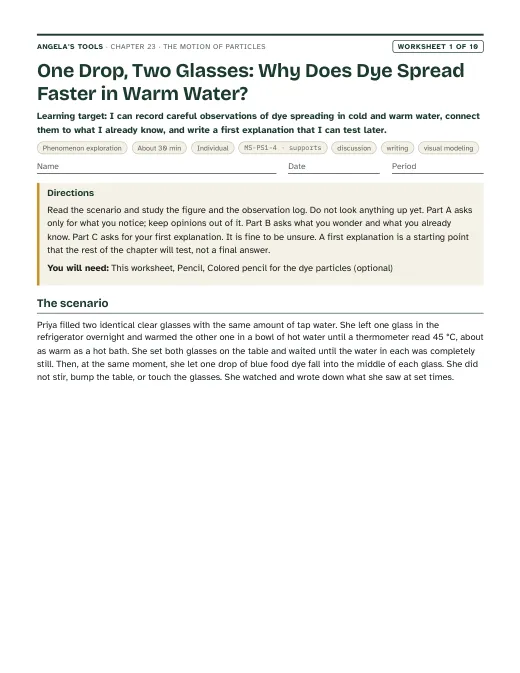
Two clear cups sit on a desk. One holds water chilled in a refrigerator; the other holds water warmed to about the temperature of a hot bath. A student lets one drop of blue food coloring fall into each cup at the same moment and then does not touch either cup. In the warm cup the blue threads curl outward and the whole cup is evenly tinted in about two minutes. In the cold cup a dark blob sits near the bottom and is still streaky ten minutes later. No spoon, no shaking, no fan. What inside the water is moving the dye, and why does temperature change how fast it moves?

Notice and wonder prompts

  • What exactly is different about the warm water, if both cups hold the same substance?
  • If no one stirred, what is moving the color through the water?
  • Would the cold cup ever become evenly blue if you waited long enough?
  • What would happen with a drop of dye in ice? In steam?

Learning targets

  • I can describe how particles are arranged and how they move in a solid, a liquid and a gas, and use that to explain each state's shape and volume.
  • I can explain that temperature is a measure of the average motion of particles, so warmer particles move faster on average.
  • I can develop a model that predicts how particle motion, temperature and state change when a pure substance gains or loses thermal energy.
  • I can explain how colliding gas particles create pressure and how pressure and temperature together decide the state of a substance.
  • I can use melting points, boiling points and a state diagram to predict the state of a pure substance at a given temperature and pressure.

What shows the learning happened

  • A three-panel particle drawing of one pure substance as solid, liquid and gas, with particles the same size in every panel and a one-sentence motion label under each (W4, Lab 2).
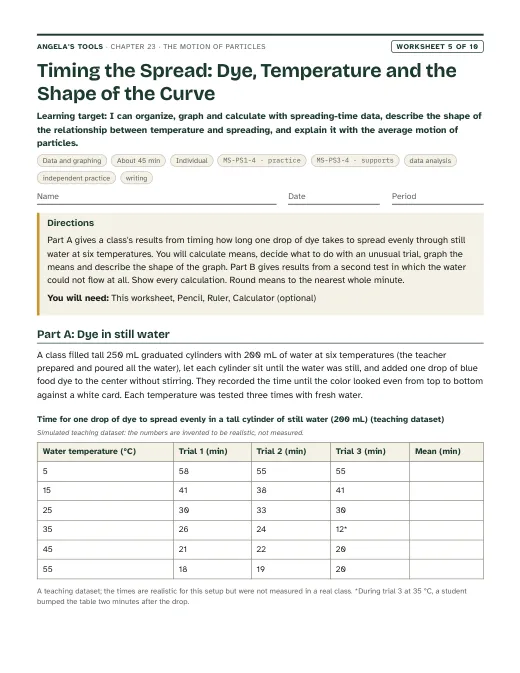
  • A completed dye-spread data table and graph (Lab 1, W5) with a written claim that connects faster spreading to faster average particle motion at higher temperature.
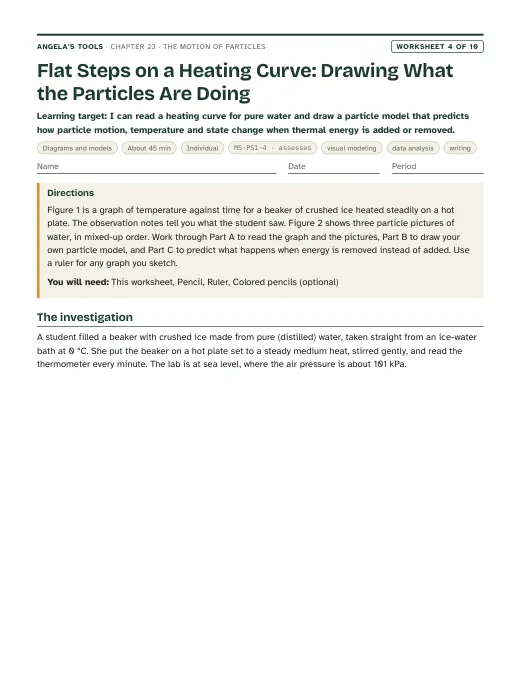
  • A plotted heating curve from the token model (Lab 3) that shows temperature rising, holding steady during melting and boiling, and rising again, with an explanation of where the added energy goes during the flat steps.
  • A Claim-Evidence-Reasoning paragraph (W6) predicting what happens to particle motion, temperature and state when a stated substance is cooled, citing melting or boiling points at a stated pressure.
  • Correct state predictions for water, carbon dioxide and gallium at given temperatures and pressures using a state diagram or a reference table (presentation task, W10).
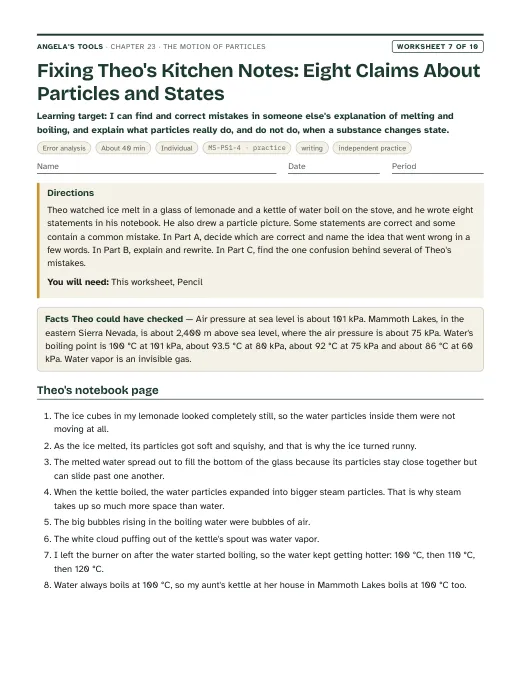
  • A corrected explanation of a fictional student's claim that particles grow or soften during melting (W7).

Key vocabulary 12 terms

state of matterThe form a sample takes, solid, liquid or gas, set by how close its particles are and how freely they move.Ice, liquid water and water vapor are three states of matter of a single substance.
solidA state in which particles are packed closely in a fixed pattern and can only vibrate around their positions, so the sample keeps its own shape and nearly its own volume.Because the particles of a solid cannot trade places, a coin keeps its shape whether it is in a pocket or on a desk.
liquidA state in which particles stay close together but are free to slide past one another, so the sample flows and takes the shape of its container while keeping nearly the same volume.Water poured from a bottle into a bowl is still a liquid: its volume is the same, only its shape changed.
gasA state in which particles are far apart and move freely in straight lines until they collide, so the sample spreads to fill any container it is given.The helium in a sealed tank is a gas, and its particles are hitting every part of the tank's inner wall every instant.
temperatureA measure of how fast the particles of a sample are moving on average. A higher temperature means more average kinetic energy per particle.Two cups of water at the same temperature have particles moving at the same average speed, even if one cup holds more water.
thermal energyThe total energy of motion of all the particles in a sample. Adding thermal energy usually makes particles move faster, and during a change of state it loosens or separates them instead.A bathtub of warm water holds far more thermal energy than a teacup at the same temperature because it has far more moving particles.
diffusionThe spreading of particles from where they are crowded to where they are fewer, caused only by their own random motion.A drop of food coloring on a dish of set gelatin spreads into a slowly widening ring by diffusion, because the gel stops any currents from carrying it.
melting pointThe temperature at which a pure solid turns into a liquid when it gains thermal energy, at a stated pressure. Freezing happens at the same temperature when energy is removed.Gallium's melting point is about 30 °C at sea-level pressure, so a piece of it melts in a warm hand.
boiling pointThe temperature at which a pure liquid turns into a gas throughout the liquid when it gains thermal energy, at a stated pressure. Lower pressure means a lower boiling point.Water's boiling point is 100 °C at sea level but only about 85 °C near the top of Mount Whitney, where the air pressure is lower.
pressureThe amount of force pushing on each unit of area. A gas makes pressure when its particles collide with the walls of their container.Air at sea level presses on a tabletop with a pressure of about 101 kilopascals, which is about 101,000 newtons on every square meter.
state diagramA graph with temperature on one axis and pressure on the other, divided into regions that show where a substance is solid, liquid or gas. Scientists also call it a phase diagram.A state diagram for water shows that at 50 kPa water boils at about 81 °C, not 100 °C.
sublimationA change straight from solid to gas with no liquid in between, which carbon dioxide does at ordinary air pressure.Dry ice shrinks on a plate without leaving a puddle because the solid carbon dioxide sublimates.

Standards alignment

California NGSS, Grade 7 Preferred Integrated Course Model. Each entry says whether this chapter's work assesses the performance expectation, gives practice toward it, or supports it as background; the resource lists below repeat this for every worksheet and lab.

MS-PS1-4Assesses: the whole PE: a qualitative particle model that predicts motion, temperature and state as thermal energy is added or removedCA Grade 7

Develop a model that predicts and describes changes in particle motion, temperature, and state of a pure substance when thermal energy is added or removed.

Every strand of this chapter builds or uses a particle model of solids, liquids and gases. Lab 2 and Lab 3 have students run a model in which adding or removing energy changes particle motion and then the state, and record the result as data; W4, W6 and W9 ask for drawn and written models that predict what happens when a pure substance is heated or cooled. No task asks for a calculation of energy or heat.

MS-PS3-4Supports: only the idea that temperature measures the average kinetic energy of particlesCA Grade 6

Plan an investigation to determine the relationships among the energy transferred, the type of matter, the mass, and the change in the average kinetic energy of the particles as measured by the temperature of the sample.

This is a Grade 6 PE in the California integrated sequence, taught before this lesson. The chapter leans on its core idea, that a thermometer reports the average motion of particles, to explain why warm water spreads dye faster (Lab 1), but no activity here plans the mass-and-energy investigation the PE describes.

Assessment boundary: Assessment does not include calculating the total amount of thermal energy transferred.

Science and engineering practices

  • Developing and Using Models. Students draw particle pictures of the three states, run a tilted marble-tray model in which shaking harder stands for adding energy (Lab 2), act out a token-driven model of melting, boiling and evaporation (Lab 3), and revise each model after naming where it stops matching real particles.
  • Planning and Carrying Out Investigations. Students score the spread of dye at fixed times in three cups of unknown temperature (Lab 1), controlling volume, drop size and stirring, and rank the temperatures before a thermometer reveals them.
  • Analyzing and Interpreting Data. Students graph dye spread scores over time and pool class scores against temperature (Lab 1), graph mean spreading times against temperature (W5), plot the token model's heating curve with its flat steps (Lab 3) and interpret a heating curve for water (W4), read water's state diagram (slide 22), build its boiling line from evidence cards (W8), and use melting and boiling points at stated pressures to predict states (slide 23, W10).

Disciplinary core ideas

  • PS1.A Structure and Properties of Matter. Solids, liquids and gases differ in how their particles are arranged and move; the changes of state that come with changes in temperature or pressure can be described and predicted with a particle model.
  • PS3.A Definitions of Energy. Temperature is a measure of the average kinetic energy of particles; adding thermal energy raises that average or, at a change of state, loosens the particles instead.

Crosscutting concepts

  • Cause and Effect. Adding thermal energy causes faster particle motion, which causes faster diffusion and, at a threshold, a change of state; more collisions per area cause more pressure.
  • Scale, Proportion, and Quantity. What students see at the cup scale (a blob of dye spreading, a bottle crumpling, a puddle of melted gallium) is explained by what trillions of particles do at a scale no eye can see.
  • Energy and Matter. Energy moves into and out of a sample; the particles themselves are not created, destroyed, or changed in size by a change of state.

Presentation 28 slides

The Motion of Particles: how particles move, and what changes when energy goes in or out. Original, editable slides with speaker notes: a phenomenon opener, learning targets, the chapter's concepts with diagrams, vocabulary in context, 3 checks for understanding, 2 discussion prompts, an application task, a misconception check, a synthesis and an exit ticket.

Worksheets 10 of 10

Ten different tasks, one per instructional blueprint. Each has a student PDF (low ink, US Letter), an editable DOCX, an HTML preview, and a separate teacher answer key with reasoning.

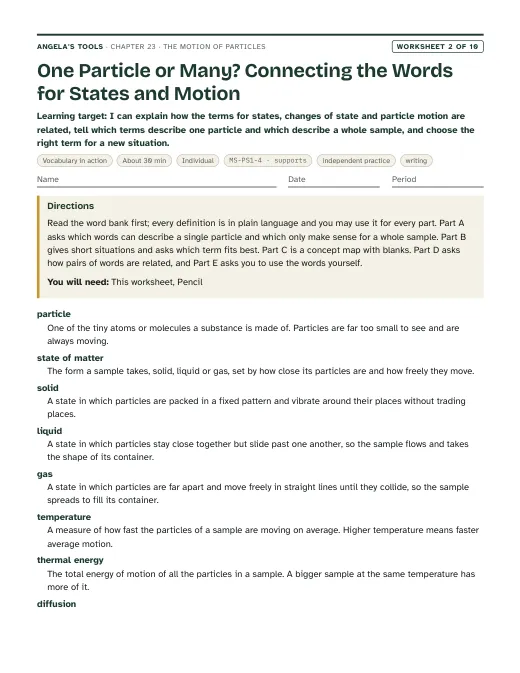
First page of One Particle or Many? Connecting the Words for States and Motion
Worksheet 2 · Vocabulary in action

One Particle or Many? Connecting the Words for States and Motion

I can explain how the terms for states, changes of state and particle motion are related, tell which terms describe one particle and which describe a whole sample, and choose the right term for a new situation.

30 minindividualBuilds understandingIndependent practiceWriting MS-PS1-4 · supports
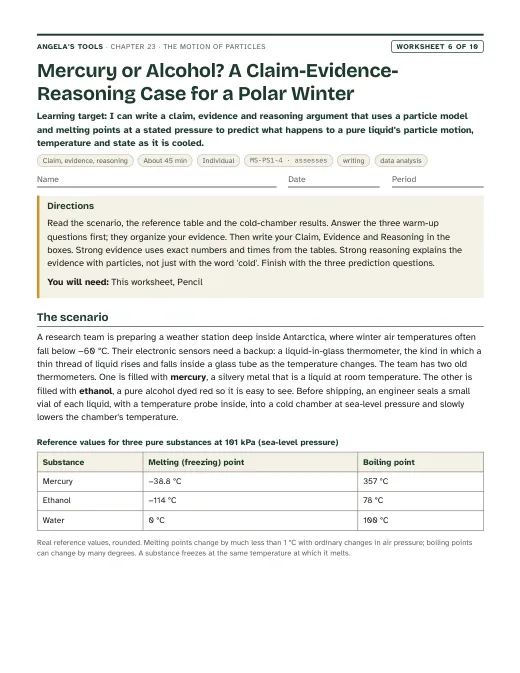
First page of Mercury or Alcohol? A Claim-Evidence-Reasoning Case for a Polar Winter
Worksheet 6 · Claim, evidence, reasoning

Mercury or Alcohol? A Claim-Evidence-Reasoning Case for a Polar Winter

I can write a claim, evidence and reasoning argument that uses a particle model and melting points at a stated pressure to predict what happens to a pure liquid's particle motion, temperature and state as it is cooled.

45 minindividualAssessmentWritingData analysis MS-PS1-4 · assesses
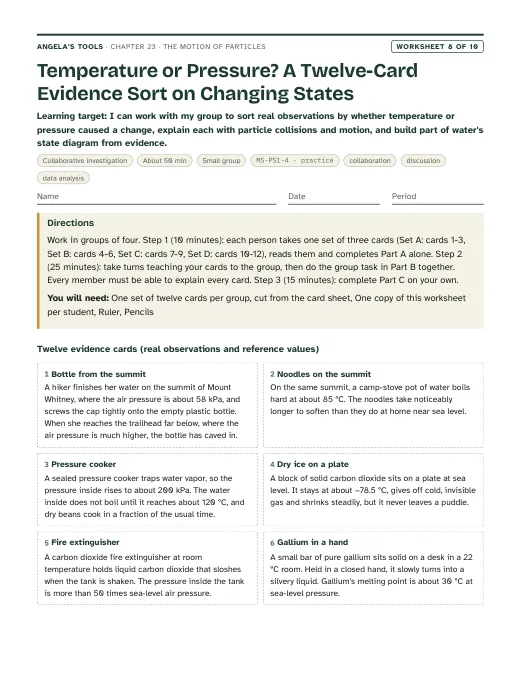
First page of Temperature or Pressure? A Twelve-Card Evidence Sort on Changing States
Worksheet 8 · Collaborative investigation

Temperature or Pressure? A Twelve-Card Evidence Sort on Changing States

I can work with my group to sort real observations by whether temperature or pressure caused a change, explain each with particle collisions and motion, and build part of water's state diagram from evidence.

50 minsmall groupPracticeCollaborationDiscussionData analysis MS-PS1-4 · practice
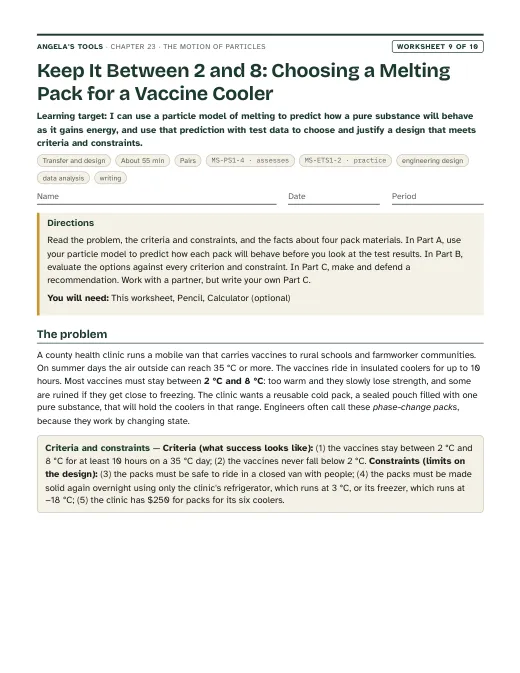
First page of Keep It Between 2 and 8: Choosing a Melting Pack for a Vaccine Cooler
Worksheet 9 · Transfer and design

Keep It Between 2 and 8: Choosing a Melting Pack for a Vaccine Cooler

I can use a particle model of melting to predict how a pure substance will behave as it gains energy, and use that prediction with test data to choose and justify a design that meets criteria and constraints.

55 minpairsExtensionEngineering designData analysisWriting MS-PS1-4 · assessesMS-ETS1-2 · practice

Collaborative labs 3 of 3

Three different investigation approaches. Each has a teacher guide (purpose, materials with quantities, estimated cost, prep, safety, procedure, expected observations, debrief, answer key, assessment criteria, accessibility adaptations, low-cost alternative) and a student recording sheet.

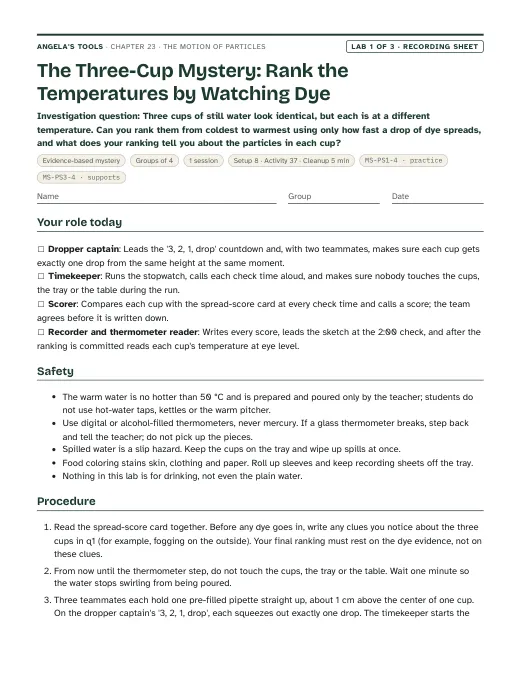
First page of the The Three-Cup Mystery: Rank the Temperatures by Watching Dye recording sheet
Lab 1 · Evidence-based mystery

The Three-Cup Mystery: Rank the Temperatures by Watching Dye

Three cups of still water look identical, but each is at a different temperature. Can you rank them from coldest to warmest using only how fast a drop of dye spreads, and what does your ranking tell you about the particles in each cup?

Groups of 41 session37 min activityEst. 10 to 15 per class (add about 20 if eight alcohol thermometers must be bought)Identical clear plastic cups, about 300 mL (10 oz), labeled X, Y and Z on masking tapeWater at three temperatures, poured by the teacher: cold (about 5 to 10 °C), room (about 20 to 23 °C) and warm (about 40 to 45 °C)Plastic transfer pipettes (droppers), each pre-filled by the teacher with blue food coloring from the same bottle MS-PS1-4 · practiceMS-PS3-4 · supports
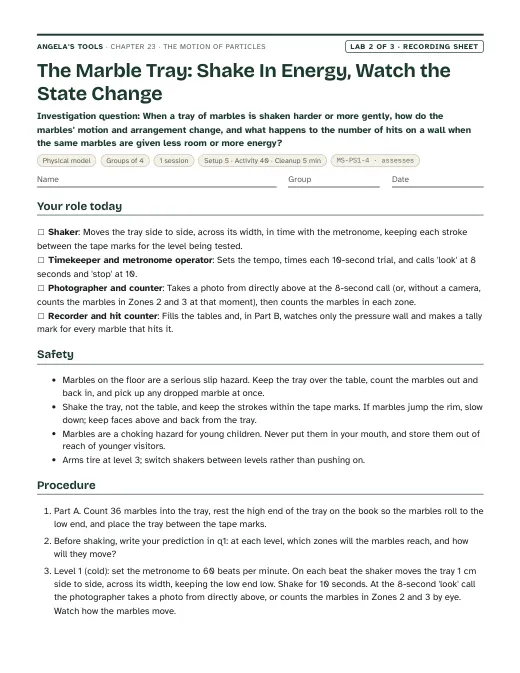
First page of the The Marble Tray: Shake In Energy, Watch the State Change recording sheet
Lab 2 · Physical model

The Marble Tray: Shake In Energy, Watch the State Change

When a tray of marbles is shaken harder or more gently, how do the marbles' motion and arrangement change, and what happens to the number of hits on a wall when the same marbles are given less room or more energy?

Groups of 41 session40 min activityEst. 15 to 30 per class (marbles and trays last for years)Rimmed baking tray or plastic cafeteria tray, inner floor about 30 cm by 20 cm, rim at least 2 cm highGlass marbles, all the same size (about 16 mm)Closed paperback book or wooden block about 2 cm thick, to tilt the tray MS-PS1-4 · assesses
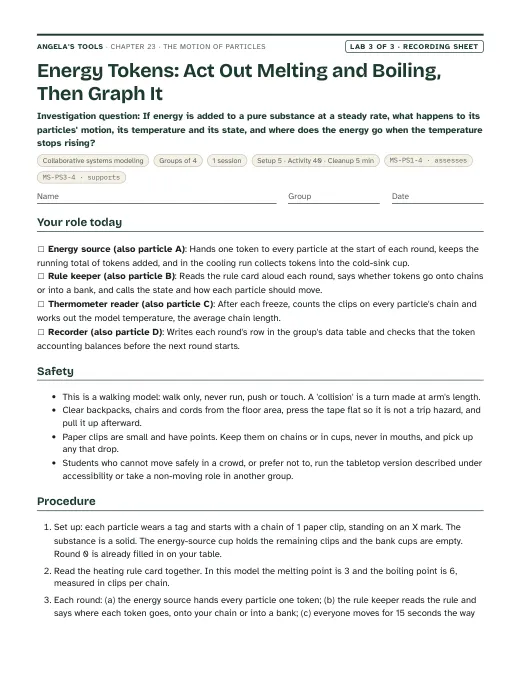
First page of the Energy Tokens: Act Out Melting and Boiling, Then Graph It recording sheet
Lab 3 · Collaborative systems modeling

Energy Tokens: Act Out Melting and Boiling, Then Graph It

If energy is added to a pure substance at a steady rate, what happens to its particles' motion, its temperature and its state, and where does the energy go when the temperature stops rising?

Groups of 41 session40 min activityEst. 5 to 10 per classMasking tape for a floor container about 2 m by 3 m, a line marking off a liquid strip, and four X marks for the solid positionsStandard paper clips (energy tokens)Paper cups labeled 'Energy source', 'Loosening bank (melting)', 'Separating bank (boiling)' and 'Cold sink' MS-PS1-4 · assessesMS-PS3-4 · supports

Teacher guidance

Suggested sequence (7 steps)
  1. Period 1: Presentation slides 1-10 (phenomenon, targets, one substance in three states, the particle panels, solids, liquids, gases, the which-state check, vocabulary for the three states). Run the two-cup dye demonstration live if possible. W1 phenomenon worksheet as the opener; W2 vocabulary relationships to close.
  2. Period 2: Lab 1, the three-cup mystery (one session). Groups score the dye spread at fixed times in three cups of unknown temperature, commit to a ranking, then reveal the temperatures with a thermometer. Follow with slides 11-14 (temperature as average motion, the spread-time bar diagram, the cold-cup discussion, motion and energy vocabulary). W5 data worksheet uses the same reasoning on a larger simulated dataset.
  3. Period 3: Lab 2, the marble tray (one session). Groups shake a tilted tray of marbles at three metronome-set 'temperatures', count how many marbles reach each zone, ease off to model cooling, and count wall hits in a full and a half tray. Slides 15-16 (check on adding energy to ice, the heating curve). W3 reading passage for homework.
  4. Period 4: Lab 3, the energy-token kinesthetic model (session 1: heating run and the uneven evaporation round). Groups record the model temperature after each round of tokens and plot the curve with its flat steps. Slide 17 (melting point, boiling point and sublimation as properties). W4 diagram worksheet: read a heating curve and complete particle models.
  5. Period 5: Slides 18-21 (the Mount Whitney boiling-point connection, pressure from collisions, the gas-to-liquid piston panels, the syringe check). W7 misconception repair. Optional Lab 3 session 2: run the cooling sequence and compare curves.
  6. Period 6: Slides 22-25 (reading water's state diagram, the prediction task with water, gallium and carbon dioxide, the dry-ice fog discussion, standard temperature and pressure). W8 collaborative evidence sort and W9 transfer problem.
  7. Period 7: Slides 26-28 (misconception, synthesis, exit ticket). W6 CER as the written assessment, then W10 mastery as the quiz.

Materials overview: No open flames, and no water above 50 °C in any hands-on activity; the teacher prepares and pours the warm water. Lab 1 uses clear cups, plastic pipettes, food coloring, a thermometer, refrigerator water and warm tap water. Lab 2 uses 36 matching marbles (or dried lima beans), a rimmed tray tilted on a book, masking tape, a cardboard divider and a metronome app. Lab 3 uses masking tape on the floor, four paper cups and about fifty paper clips per group as energy tokens. The dye demonstration for the phenomenon needs two clear cups, one cold and one warm, and a white sheet of paper behind them.

Common misconceptions (5)
“Particles in a solid do not move at all.”
Why it happens: A rock or an ice cube looks perfectly still, and students treat the sample's stillness as the particles' stillness.
Correction: The particles of a solid vibrate constantly around fixed positions; they simply cannot trade places. Warming a solid makes the vibration larger, which is why a metal lid loosens under hot water.
“When a substance melts or boils, its particles get bigger, softer or lighter.”
Why it happens: The sample visibly changes, spreads out or rises, so students assume the particles themselves changed.
Correction: A water molecule in ice, in liquid water and in water vapor is the same molecule with the same size and mass. Only the spacing and the motion of the particles change. A gas takes up more room because its particles are far apart, not because they grew.
“Water must reach 100 °C before any of it can become a gas, and 100 °C is a fixed number.”
Why it happens: The boiling point is memorized as a single fact, and boiling is the only liquid-to-gas change most students have watched.
Correction: Boiling happens at 100 °C only at sea-level pressure; at lower pressure water boils at a lower temperature. Evaporation at the surface happens at any temperature, because the fastest particles in a liquid can always escape.
“The white cloud over dry ice or a kettle is carbon dioxide gas or water vapor that you can see.”
Why it happens: The textbook's photographs and everyday language call the fog 'vapor' or 'smoke'.
Correction: Carbon dioxide gas and water vapor are both invisible. The white cloud is made of tiny droplets of liquid water that condensed from water vapor as it was cooled; the invisible gas is what carried the cold.
“Temperature and thermal energy are the same thing.”
Why it happens: Both go up when something is heated, and everyday speech uses 'heat' for both.
Correction: Temperature is an average per particle; thermal energy is a total for the whole sample. A bathtub of warm water has a lower temperature than a cup of tea but far more thermal energy, because it contains vastly more moving particles.
Differentiation suggestions (5)
  • Multilingual learners: Pair each of the three states with a gesture (fists together and trembling for solid; palms sliding over each other for liquid; hands flying apart for gas) and use the gestures on every slide; provide a bilingual word card for solid, liquid, gas, temperature, pressure and melting; let Lab 1 observations be called out orally while a partner writes.
  • Students who need more support: Tape a picture strip of the five Lab 1 spread scores beside the cups, give Lab 3 a pre-filled 'tokens added so far' column, provide a three-panel drawing frame with particle circles already printed for W4, and offer a sentence frame for the CER ('When ___ is cooled to ___ °C at ___ kPa, its particles ___, so it becomes a ___').
  • Students ready for extension: Ask them to explain why ice floats using the particle model (water is unusual: its solid is less dense than its liquid), to find the boiling point of water at the elevation of a California town using a pressure table, or to rewrite the Lab 3 rule card so the boiling plateau is longer than the melting plateau, as it is for real water, run it, and compare their curve with the class curve.
  • Students who need movement or alternative output: Lab 3 is built for movement; let the same students present their W6 reasoning as a 60-second recorded explanation while acting out the three states, and accept a labeled photo of their marble tray in place of the Lab 2 drawing.
  • Students with low vision or limited fine-motor control: Use large, high-contrast cups and dark blue dye in Lab 1 with a white card behind each cup; provide large marbles or wooden beads and a tray with a high rim in Lab 2; let a partner handle timing while the student calls the spread score; offer a tactile heating curve made of a string glued to card.
Accuracy notes: where the textbook simplifies (14)
  • Temperature and particle motion: the lesson text (pp. 301-303) links temperature to state but never says what temperature measures. Teach that temperature is a measure of the average kinetic energy of the particles, so at a higher temperature particles move faster on average; a sample at one temperature still contains slower and faster particles. No energy calculations are asked anywhere in the chapter.
  • Changes of state and the flat steps: while a pure substance melts or boils at constant pressure, its temperature holds steady even though thermal energy is still being added; the energy goes into loosening or separating the particles rather than speeding them up. The textbook does not show this heating curve, but it is part of the MS-PS1-4 model, so the deck (slide 16) and Lab 3 include it qualitatively.
  • Heating-curve proportions: real water needs nearly seven times as much energy to boil a sample as to melt it, so its boiling plateau is far longer than its melting plateau (the deck's idealized curve on slide 16 shows this). Lab 3 deliberately gives both changes the same number of tokens to keep the model simple, and says so in its limitations; no task asks for the energy values.
  • Fog is not gas: the opener (pp. 296-297) calls the cloud over dry ice 'smoky vapor', and Figures 5B and 6B and the Key Science Concept (pp. 303, 305, 306) draw gases as white clouds. Carbon dioxide gas and water vapor are invisible. The white cloud is tiny liquid water droplets condensed from the air by the cold gas; the book's own Figure 3 caption (p. 300) says this for steam.
  • 'All substances have a specific melting point' (p. 301): sharp melting and boiling points belong to pure substances, and only at a stated pressure, as the book itself says on p. 303. Glass, wax, butter and most mixtures soften over a range of temperatures. Every prediction task in this chapter names the substance as pure and states the pressure.
  • Solids and 'fixed' volume (p. 298): the book says an ice cube's molecules can neither spread apart nor move closer. Solids and liquids expand slightly when warmed because their particles vibrate harder and sit a little farther apart on average; the particles themselves never grow. Say 'nearly fixed volume'.
  • Liquid versus solid spacing: the deck's particle panels draw the liquid slightly looser than the solid, which is true for most substances, but water is the famous exception: ice is less dense than liquid water, which is why ice floats. Do not teach 'solids are always denser than their liquids'.
  • Inconsistent numbers in the book: the text gives 50 kPa where Figure 5B shows 52 kPa (p. 303); Figure 5A labels 62 kPa and 98 kPa while the text uses about 101 kPa at sea level (p. 302); p. 304 puts the mountain cabin at 62 kPa and then works the example at 80 kPa; and water's boiling point at 80 kPa is about 93.5 °C, so the book's point (95 °C, 80 kPa) sits barely inside the gas region. This chapter uses reference values (water boils at about 81 °C at 50 kPa, 100 °C at 101 kPa and 120 °C at 200 kPa) and keeps every state prediction at least 10 °C from a boundary. The one deliberate exception is W9, where a phase-change pack is chosen because its melting point sits inside the 2-8 °C vaccine range; there the margins are a few degrees, and the teacher notes say so.
  • Water at STP (p. 307): the book says water is a solid at standard temperature and pressure, but STP's 0 °C is water's melting point, a boundary where ice and liquid water coexist. Teach STP as 0 °C and 100 kPa, which is the current IUPAC value (many references still use the older 101.325 kPa), and do not ask for water's state at a boundary temperature.
  • Gallium: the photo caption (p. 305) gives a melting point of 29.78 °C; the reference value is 29.76 °C. Say 'about 30 °C at sea-level pressure' and never assess the decimals.
  • Carbon dioxide: it sublimates at −78.5 °C at 101 kPa and cannot be a liquid below about 518 kPa, so 'you have never seen liquid carbon dioxide' (p. 305) is true at ordinary pressures only; fire extinguishers and some tanks do hold liquid carbon dioxide under high pressure.
  • Analogies have limits (pp. 299-300): sand grains are tiny solids, and a racquetball slows down and stops, while gas particles in a container at a steady temperature keep the same average speed. Lab 2's marbles also stop when the shaking stops; name this limit with students.
  • Dye spreading in Lab 1 is not pure diffusion: the dye drop is slightly denser than water and sinks, and small temperature differences set up currents that carry color. Faster particle motion at higher temperature is still the main reason the warm cup mixes sooner, but call the observation 'spreading' rather than 'diffusion alone'.
  • Pressure vocabulary: the book's kilopascal definition (1 kPa = 1,000 N/m²) and sea-level value (about 101 kPa) are correct. Keep the 'more collisions per area means more pressure' explanation; do not introduce gas laws or formulas.

Review status: reviewed · 2026-10-19 · Re-solved every numeric, multiple-choice, true/false, fill and table item in W1-W10 and Labs 1-3, including the Lab 3 heating, uneven-round and cooling runs round by round, the slide-16 and W4 heating-curve proportions (they match water's real specific and latent heats) and the slide 23 and W10 state tables; keys agree except where changed below. Diffusion example in the vocabulary replaced: air currents, not diffusion, carry a smell across a room, so the inContext sentence now uses dye spreading in set gelatin; slide 14's diffusion example and its model sentence were corrected the same way. Dye-spread data made consistent. W1's warm glass lowered from 60 °C to 45 °C (the chapter's hands-on ceiling and the Lab 1 and slide 12 temperature), with its log, figure and q1, q2, q3 and q8 keys rewritten so the warm glass is even within minutes, as on slide 12 and in Lab 1; W5's identical-sounding '200 mL cups' that took 19-56 minutes are now tall graduated cylinders, with a teacher note on comparing patterns rather than minutes. Slide links and chapter claims checked against the sheets as written: links on slides 16, 18, 20, 22 and 25 match (W4 heating curve, W8 summit and pressure cards, Lab 2 Part B, W6 reference table); the threeDimensions claim that W4 and W10 use a state diagram was corrected (W4 reads a heating curve; W10 uses a reference table; W8 builds the boiling line); W10's two lists of PE-evidence items were made to agree. History and reference values verified: Brown 1827, Einstein 1905, Perrin about 1908-1909 and his 1926 Nobel Prize (W3); mercury −38.8 °C and ethanol −114 °C (W6); Mount Whitney 4,421 m, about 58 kPa and about 85 °C, Badwater −86 m and just above 100 °C, about 135 km apart (slide 18); Mammoth Lakes about 75 kPa and 92 °C (W7); NIST boiling-line values on slide 22. Gallium's boiling point on slide 23 changed from 'about 2,400 °C' to 'above 2,000 °C', which every reference supports and which matches W10. Boundary margins checked: every state prediction is at least 10 °C from a boundary except W9's tetradecane pack, which by design melts inside the 2-8 °C range and re-solidifies only about 3 °C below its melting point; the accuracy note and W9 key and teacher notes now say so. W10 item 6g moved from 15 °C to 10 °C so its stated '15 °C from every boundary' holds against gallium's 29.76 °C. Smaller fixes: slide 1 subtitle reworded (it echoed the lesson's opening question), the kilopascal accuracy note restated in symbols, the pressure inContext sentence made dimensionally sensible, the fog correction now says the droplets condense from water vapor, slide 20's notes say condensation begins when the pressure reaches 101 kPa, slide 24's second clue no longer says air 'gives off' vapor, W3 says 'Brown's specks' instead of 'pollen specks', W9 states the alkanes' real hazard, criteria added to W1 q2 and q8, and the 'no water above 50 °C' claims limited to hands-on work. Originality sweep against the lesson text (column-aware, 5- and 6-word runs) found no copied sentences after the subtitle change; remaining shared runs are short technical phrases or attributed quotations in accuracy notes. Not changed: the lesson has no engineering strand, so MS-ETS1-2 appears only on W9, not in chapter.json; labs are not physically tested, and the Lab 1 room-temperature cup may mix nearly as slowly as the cold cup because neither has strong currents, which the debrief already anticipates (those two cups are the pair most often confused).

Source references

Verified against the student edition of Bring Science Alive! 7th Grade Integrated (Student Edition). Printed page numbers appear in the book; PDF pages are the physical pages of the 524-page scan (printed + 36). The textbook is not reproduced on this site.

SectionPrinted pagesPDF pagesUsed for
Introduction: the dry-ice puzzle and the vocabulary list296, 297332, 333Lesson question, the sinking-fog phenomenon reworked as the dry-ice discussion slide, the publisher's standards box.
1. Molecular Motion in Solids297, 298333, 334Vibration-in-place model of solids, fixed shape and nearly fixed volume, the expansion accuracy note.
2. Molecular Motion in Liquids299335Sliding-particle model of liquids, flow and container shape, Lab 2's medium-shake state.
3. Molecular Motion in Gases300336Free, straight-line motion with collisions, gases fill their container, the invisibility of water vapor.
4. Temperature Affects the State of Matter301337Melting and boiling points as properties, the heating-curve slide and Lab 3 thresholds.
5. Pressure Affects the State of Matter302, 303338, 339Pressure from collisions, the crumpling bottle, the piston idea, boiling point dropping with pressure, Lab 2's divider test.
6. Predicting States of Matter and the Key Science Concept304, 305, 306340, 341, 342State diagram reading, water, carbon dioxide and gallium comparisons, the prediction task.
7. Standard Temperature and Pressure, and the lesson summary307343Why scientists state conditions, the STP slide and its accuracy note.

External references used for accuracy checks

Related chapters